
Abstract
The authors evaluated and compared the metabolic effects of cyclosporin A in the rat brain during normoxia and hypoxia/reperfusion. Ex vivo 31P magnetic resonance spectroscopy experiments based on perfused rat brain slices showed that under normoxic conditions, 500 μg/L cyclosporin A significantly reduced mitochondrial energy metabolism (nucleotide triphosphate, 83 ± 9% of controls; phosphocreatine, 69 ± 9%) by inhibition of the Krebs cycle (glutamate, 77 ± 5%) and oxidative phosphorylation (NAD+, 65 ± 14%) associated with an increased generation of reactive oxygen species (285 ± 78% of control). However, the same cyclosporin A concentration (500 μg/L) was found to be the most efficient concentration to inhibit the hypoxia-induced mitochondrial release of Ca2+ in primary rat hippocampal cells with cytosolic Ca2+ concentrations not significantly different from normoxic controls. Addition of 500 μg/L cyclosporin A to the perfusion medium protected high-energy phosphate metabolism (nucleotide triphosphate, 11 ± 15% of control vs. 35 ± 9% with 500 μg/L cyclosporin A) and the intracellular pH (6.2 ± 0.1 control vs. 6.6 ± 0.1 with cyclosporin A) in rat brain slices during 30 minutes of hypoxia. Results indicate that cyclosporin A simultaneously decreases and protects cell glucose and energy metabolism. Whether the overall effect was a reduction or protection of cell energy metabolism depended on the concentrations of both oxygen and cyclosporin A in the buffer solution.
Keywords
The cyclic undecapeptide cyclosporin A (Fig. 1) is the basis of most immunosuppressive protocols after organ transplantation and it is also used for the treatment of autoimmune diseases (Kahan, 1989; Faulds et al., 1993). Its immunosuppressive mechanism of action is based on the inhibition of the phosphatase calcineurin through binding of cyclosporin A to its cytosolic receptor, cyclophilin (Schreiber and Crabtree, 1992). The cyclosporin A–cyclophilin complex inhibits the activity of the Ca2+-calmodulin–regulated protein phosphatase 2B, calcineurin. Inhibition of calcineurin activity leads to subsequent inhibition of the dephosphorylation of NFAT (nuclear factor of activated T-cells) and interleukin-2 synthesis (Schreiber and Crabtree, 1992).
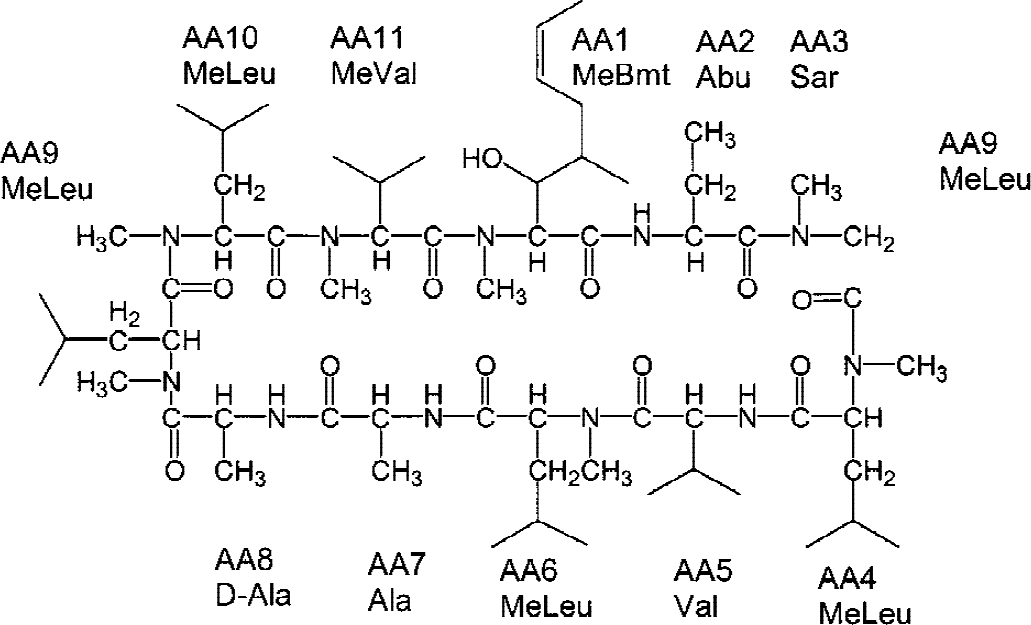
Structure of cyclosporin A. AA, amino acid.
To date, two opposite effects of cyclosporin A in the brain have been reported: neurotoxicity in transplant patients and neuroprotection during ischemia in animal models. Cyclosporin A causes neurotoxicity in up to 60% of transplant patients (Hauben, 1996; Gijtenbeek et al., 1999, Bechstein, 2000). Severe symptoms include decreased responsiveness, hallucinations, delusions, seizures, cortical blindness, aphasia, ataxia, and strokelike episodes (Hauben, 1996; Gijtenbeek et al., 1999). Minor symptoms include tremor, agitation, insomnia, anxiety, amnesia, headache, and paresthesia. The incidence of neurotoxicity is significantly increased at high cyclosporin A blood concentrations. However, neurotoxicity also occurs during long-term treatment with cyclosporin, even though blood concentrations are within the therapeutic target range (Kahan, 1989; Hauben, 1996; Gijtenbeek et al., 1999). Clinical computer tomography and magnetic resonance imaging studies showed a correlation between clinical symptoms of cyclosporin A neurotoxicity and morphologic changes in the brain, such as hypodensity of white matter, cerebral edema, metabolic encephalopathy, and hypoxic damage (de Groen et al., 1987). The biochemical mechanisms underlying cyclosporin A neurotoxicity are not yet completely understood. There is evidence that cyclosporin A in the brain (Serkova et al., 1999) and in other organs (Henke et al., 1992; Henke and Jung, 1993; Massicot et al., 1997; Salducci et al., 1996) causes mitochondrial dysfunction and inhibits mitochondrial energy production. Interestingly, the clinical symptoms of cyclosporin A neurotoxicity mimic those of mitochondrial encephalopathy (Beal, 1992; Gijtenbeek et al., 1999), suggesting a significant role of the negative effects of cyclosporin A on mitochondrial energy metabolism in clinical neurotoxicity. These neurodegenerative diseases are based on mitochondrial dysfunction resulting in a reduction of brain energy production. Binding of cyclosporin A to cyclophilin or the following inhibition of calcineurin, both of which are involved in the cyclosporin A immunosuppressive mechanism of action, have been discussed as the basic mechanisms underlying cyclosporin A toxicity (Salducci et al., 1995; Su et al., 1995).
Paradoxically, it has been shown that in animal models cyclosporin A ameliorates brain injury induced by cerebral ischemia-reperfusion in vivo (Folbergrova et al., 1997; Li et al., 1997; Uchino et al., 1998; Okonkwo and Povlishock, 1999; Okonkwo et al., 1999). The proposed mechanism of neuroprotection of cyclosporin A involves its ability to regulate the MPT pore (Bernardi, 1996). Ca2+ overload of mitochondria, the depletion of adenine nucleotides, or an increase of inorganic phosphate concentrations, oxygen radicals, or peroxides during ischemia and reperfusion injury triggers opening of the MPT. During ischemia-reperfusion injury, reperfusion rather than ischemia may cause opening of the MPT due to a burst of reactive oxygen radicals (Crompton et al., 1999). Although mitochondrial permeability transition is clearly involved in apoptosis in some cells and may trigger cell death in hypoxia-reperfusion injury (Crompton 1999), its physiologic role attributable to energy shortage during hypoxia-reperfusion is still elusive (Uchino et al., 1998). Cyclosporin A inhibits the binding of the mitochondrial matrix-specific cyclophilin D to the adenine nucleotide translocase in the inner membrane of mitochondria, which is a part of the mitochondrial permeability transition pore (Woodfield et al., 1998; Crompton 1999). By inhibiting intramitochondrial cyclophilin D, cyclosporin A reduces mitochondrial permeability transition. Additional mechanisms through which cyclosporin A may mediate its protective effects against ischemia and reperfusion injury in different organs comprise the antiinflammatory actions of cyclosporin A (Squadrito et al., 1999) and calcineurin inhibition (Shibasaki et al., 2001).
Whether cyclosporin A is neurotoxic or neuroprotective depends on cyclosporin A doses and blood concentrations. High concentrations of cyclosporin A cause neurotoxicity, whereas nanomolar concentrations below the therapeutic range are thought to be neuroprotective in animals (Bechstein, 2000; Elimadi et al., 1997). We sought to evaluate and compare the effects of cyclosporin A on rat brain metabolism under normoxic conditions and during hypoxia-reperfusion in vitro using MRS.
MATERIALS AND METHODS
Materials
Novartis Pharma AG (Basel, Switzerland) kindly provided cyclosporin A and D. Perchloric acid (60%) and potassium hydroxide were purchased from Aldrich Chemicals (Milwaukee, WI, U.S.A.) for brain tissue extractions. Deuterated chemicals (D2O, NaOD, and DCl; Cambridge Isotope Laboratories, Andover, MA, U.S.A.) and nuclear magnetic resonance tubes (5-mm and 20-mm diameter; Wilmad, Buena, NJ, U.S.A.) were used for the MRS experiments. Fluorescent agents Fura 2-AM and dichlorofluorescin diacetate were purchased from Molecular Probes (Eugene, OR, U.S.A.). Ficoll and other chemicals for the isolation of mitochondria were from Sigma Chemicals (St. Louis, MO, U.S.A.). Methanol and zinc sulfate were purchased from Fisher Scientific (Fair Lawn, NJ, U.S.A.).
During the ex vivo MRS experiments, metabolic changes of perfused rat brain slices were monitored using a Nalorac QUEST Model 4400 4.7-Tesla magnetic resonance imaging animal scanner (Nalorac, Martinez, CA, U.S.A.). The PCA extracts were analyzed using an AMX 360 MHz Bruker nuclear magnetic resonance spectrometer and data were processed with the WINNMR software (Bruker, Karlsruhe, Germany). Cyclosporin A tissue and mitochondria concentrations were measured using HPLC/HPLC-mass spectrometry (series 1100 components with mass selective detector; Hewlett-Packard, Palo Alto, CA, U.S.A.).
Animal protocols were reviewed and approved by the University of California, San Francisco Committee on Animal Research.
Monitoring of the phosphate metabolism of perfused rat brain slices using 31P magnetic resonance spectroscopy
Twenty-four rat brain slices (350-μm thick) were prepared from the cortical region of 12 7-day-old Wistar rats as described previously (Serkova et al., 2000b). Slices were transferred into a 20-mm diameter Wilmad nuclear magnetic resonance tube and perfused with fresh medium in equilibrium with a 95:5 mixture of oxygen:carbon dioxide at 37°. The perfusion medium was a modified Krebs balanced salt solution with low phosphates containing 5 mmol/L [U-13C]-labeled glucose for 13C-MRS analysis of the PCA extracts (vide infra). The total acquisition time for each 31P spectrum was 5 minutes. Chemical shifts were referenced to phosphocreatine at −2.33 ppm. 31P-MRS signals of high-energy phosphates were normalized based on the phosphomonoester signal intensity and integrated using MacFid software (Tecmag, Bellair, TX, U.S.A.). Each brain-slice preparation was used as its own control. Two hours after slice preparation (allowing for metabolic recovery) brain slices were perfused with cyclosporin A at concentrations of 100, 500, and 5000 μg/L. Brain slices were perfused for 4 hours with each cyclosporin A study concentration. During the hypoxia experiments, the oxygen in the perfusion medium was switched to nitrogen for 30 minutes, followed by reperfusion with oxygenated medium for 2 hours. After perfusion with cyclosporin A under normoxic or hypoxic conditions, the brain slices were rinsed in ice-cold sodium chloride (0.9%), frozen in liquid nitrogen, and extracted using 12% PCA for subsequent in vitro MRS experiments. Cyclosporin A brain tissue concentrations were measured using an HPLC/HPLC-mass spectrometry assay.
Multinuclear magnetic resonance spectroscopy analysis of brain-slice perchloric acid extracts
We used a modification of a previously described PCA extraction procedure for our in vitro MRS analyses (Serkova et al., 1996). All one-dimensional magnetic resonance spectra of brain PCA extracts were recorded using the AMX 360 spectrometer (Bruker). A 5-mm 1HX-inverse probe (Bruker) was used for all experiments. For 1H-MRS, the operating frequency was 360 MHz. The acquisition parameters were 128 accumulations, 40° flip angle, 12-second repetition time, 3,600-Hz spectral width, 16-K data size, and zero filling to 32 K. TSP (trimethylsilyl propionic-2,2,3,3,-d4 acid, 0.6 mmol/L) was used as external standard for the quantification of metabolites based on 1H-MRS signal intensities. The 1H chemical shifts were referenced to TSP at 0 ppm.
Subsequently, 13C magnetic resonance spectra were recorded using the same sample as for 1H-MRS analysis. The nuclear magnetic resonance parameters were 90.5-MHz operating frequency, 20,000 accumulations, 27° flip angle, 2.5-second repetition time, 17,860-Hz spectral width, 16-K data size, and zero filling to 32 K. Composite pulse decoupling was used. The C3 peak of lactate at 21 ppm was used as chemical shift reference in 13C-MRS.
Before in vitro 31P magnetic resonance spectra were recorded, 100 mmol/L edetic acid was added to each of PCA extracts for complexation of divalent ions, which significantly improved the peak resolution of the 31P spectra. The pH was adjusted to 7 using potassium hydroxide and hydrochloride. The following nuclear magnetic resonance parameters were used: 145.7-MHz operating frequency, 5,000 accumulations, 80° flip angle, 3.5-second repetition time, 5,000-Hz spectral width, 8-K data size, and 12-K zero filling. Composite pulse decoupling was used. The phosphocreatine signal at −2.33 ppm was used as chemical shift reference. The absolute concentrations of phosphocreatine were determined using 1H-MRS analysis and subsequently used as standard for the quantification of metabolites from 31P-MRS spectra.
Measurements of reactive oxygen species
After perfusion with cyclosporin A for 4 hours or subsequent hypoxia-reperfusion, the slices were loaded with the fluorescent agent 2′,7′-dichlorofluorescin diacetate for the last 30 minutes. Two rat brain slices were homogenized in 5 mL buffer solution containing 1 mg MgCl2 · 6H2O, 0.7 mg NaH2PO4 · H2O, 5 mg glucose, 1 mL HEPES buffer, and 65 μL 100-mmol/L calcium chloride. After centrifugation at 1000 g for 5 minutes, the pellets were reconstituted in 1 mL buffer. The oxidation of intracellular dichlorofluorescin to highly fluorescent dichlorofluorescein was measured using a Perkin-Elmer LS50B fluorescence spectrophotometer (excitation wavelength, 485 nm; emission wavelength, 525 nm) as described by Wang and Joseph (1999). Brain slices perfused with 1 mmol/L hydrogen peroxide for 30 minutes were used as a positive control for oxidative stress.
Quantification of intracellular Ca2+
For measurement of intracellular Ca2+, CA1 neurons from the hippocampus of Wistar rats (postnatal day 2) were isolated following the method described by Friedman and Haddad (1993). The cells were dissociated using trypsin and mixed by drawing into a single flame-polished pipette in modified Eagle's medium (MEM) containing 5-μmol/L Fura-2 AM (the acetoxymethyl ester form of Fura-2; Molecular Probes). The Fura-2–loaded cells were allowed to settle onto poly-L-lysine–treated coverslips in MEM at 37°C for 2 hours. The cytosolic concentration of free Ca2+ was analyzed under an inverted microscope (Jensen and Chui, 1991). In brief: the Fura-2 loaded neurons were perfused under a microfluorometer with Krebs balanced salt solution containing 124 mmol/L sodium chloride, 5 mmol/L potassium chloride, 0.1 mmol/L potassum phosphate, 1.2 mmol/L magnesium sulfate, 1.2 mmol/L calcium chloride, 26 mmol/L sodium bicarbonate, and 10 mmol/L glucose. In the control experiment, the medium was oxygenated with a 95:5 oxygen:carbon dioxide mixture, and cyclosporin A was added to the perfusion medium at various concentrations (0–2000 μg/L). The chamber was perfused with hypoxic (95:5 nitrogen:carbon dioxide mixture) equilibrated warmed Krebs balanced salt solution (flow, 1 mL/min) above the oil objective lens (Nikon Fluor 40/1.30) of a Nikon (Melville, NJ, U.S.A.) Diaphot 200 microscope. Neurons were individually framed and excited at 340- and 380-nm wavelengths every 0.25 seconds, and fluorescent intensity at 510 nm was recorded using a PTI D104 fluorometer (PTI, South Brunswick, NJ, U.S.A.). Ca2+i was determined for each cell by an in vivo calibration method as described by Jensen and Chiu (1991), using FELIX software (PTI).
Isolation of mitochondria
Brain slice mitochondria were isolated as previously described by Clark et al., (1987). In brief, brain tissues were homogenized in isolation medium containing 320 mmol/L sucrose, 1 mmol/L edetic acid-potassium, and 10 mmol/L Tris-hydrochloride (pH 7.4). After 3 minutes of centrifugation at 1300 g, the supernatant was decanted and the crude nuclear pellet was reconstituted and centrifuged again. The postnuclear supernatants were combined and centrifuged at 8,000 g for 10 minutes. The supernatant was decanted, leaving the mitochondrial pellet. The pellet was resuspended in isolation medium and then layered onto a two-step Ficoll gradient (bottom layer, 10% weight-to-weight-ratio Ficoll solution; top layer, 7.5% Ficoll). The resulting three-layered gradient was centrifuged at 18,000 g for 45 minutes. The free (nonsynaptosomal) mitochondria were at the bottom of the tube and separated from the myelin and synaptosomal fraction. The mitochondrial pellet was weighed and dissolved in the extraction buffer for HPLC/HPLC-mass spectrometry analysis.
Measurement of cyclosporin A concentrations in extracted tissue samples using HPLC/HPLC-mass spectrometry
We used a modification of our previously described HPLC-mass spectrometry assay with automated online sample extraction (HPLC/HPLC-mass spectrometry) for quantification of cyclosporin A in brain slices and isolated brain mitochondria (Christians et al., 2000). Briefly, rat brain tissues (wet weight, 1.0 g) were thawed and weighed. Tissue samples were homogenized with 2 mL 1-mol/L potassium phosphate buffer (pH 7.4) using an electric homogenizer. For protein precipitation, 200 μL methanol/1-mol/L zinc sulfate (80/20 volume-to-volume ratio) was added to 100 μL sample (homogenized brain tissues or isolated mitochondria). Cyclosporin D (250 μg/L) was added as an internal standard for cyclosporin A. After centrifugation, 100 μL supernatant was injected onto the extraction column. Samples were washed with a mobile phase of 40% methanol and 60% 0.1% formic acid supplemented with 1 μmol/L sodium formate. The flow was 5 mL/min and the temperature for the extraction column was set to 65°C. After 0.75 minutes, the switching valve was activated and the analytes were eluted in the backflush mode from the extraction column onto the analytical column (flow, 0.5 mL/min). The mobile phase consisted of 90% methanol and 10% 0.1% formic acid supplemented with 1 μmol/L sodium formate. The mass spectrometer was run in the selected ion mode and positive ions [M+Na]+ were recorded. For all matrices, the analytical recovery was more than 90%. The assay was linear from 1 μg/L (lower limit of quantification) to 500 μg/L cyclosporin A (r2 > 0.99).
Statistical analysis
Values are expressed as mean ± SD unless otherwise indicated. Concentrations in brain slices perfused under normoxic and hypoxic conditions with or without cyclosporin A were compared using unpaired Student's t-test or analysis of variance with Scheffé test as post hoc test. Time-dependent changes were analyzed using a repeated measures analysis of variance. The SPSS software package (version 10.07; SPSS, Chicago IL, U.S.A.) was used to calculate distribution statistics and for all statistical analyses. A P value of less than 0.05 was considered significant.
RESULTS
The effects of cyclosporin A on brain metabolism during normoxia
To assess cyclosporin A concentration–dependent effects on brain energy metabolism, rat brain slices were perfused with 0, 100, 500, and 5000 μg/L cyclosporin A (Fig. 2). After 4 hours of perfusion, cyclosporin A reached significant concentrations in the brain slices and in mitochondria (Table 1). However, there was no linear relation between cyclosporin A concentrations in the perfusion medium and cyclosporin A concentrations in brain tissue and mitochondria. To compare phosphate metabolism during cyclosporin A exposure with the controls, we calculated the relative intensities of high-energy phosphates normalized based on the phosphomonoester signal intensities: NTP/phosphomonoesters, phosphocreatine/phosphomonoesters, NAD+/phosphomonoesters, and Pi/phosphomonoesters. Phosphomonoesters are intracellular precursors of membrane components and their concentrations inside of the intact cell remained constant over the observation period of 4 hours (Serkova et al., 1999). The addition of cyclosporin A reduced high-energy phosphate concentrations of perfused rat brain slices after 4 hours of perfusion, even at the lowest tested cyclosporin A concentration of 100 μg/L. However, at this concentration the effects were not statistically different from the controls (Table 2). The decreased energy production in brain slices became statistically significant after perfusion with 500 μg/L cyclosporin A (NTP, 83 ± 9% of control, P > 0.05; phosphocreatine, 69 ± 9%; P < 0.01; NAD+, 65 ± 14%; P < 0.05, n = 8). The highest cyclosporin A concentration of 5,000 μg/L produced a large reduction of NTP, phosphocreatine, and NAD+ (Table 2) and an increase of intracellular inorganic phosphate to 142 ± 14% of the control level (P < 0.01, n = 8).
Cyclosporin A concentrations in rat brain slices and their mitochondria after 4 hours of perfusion
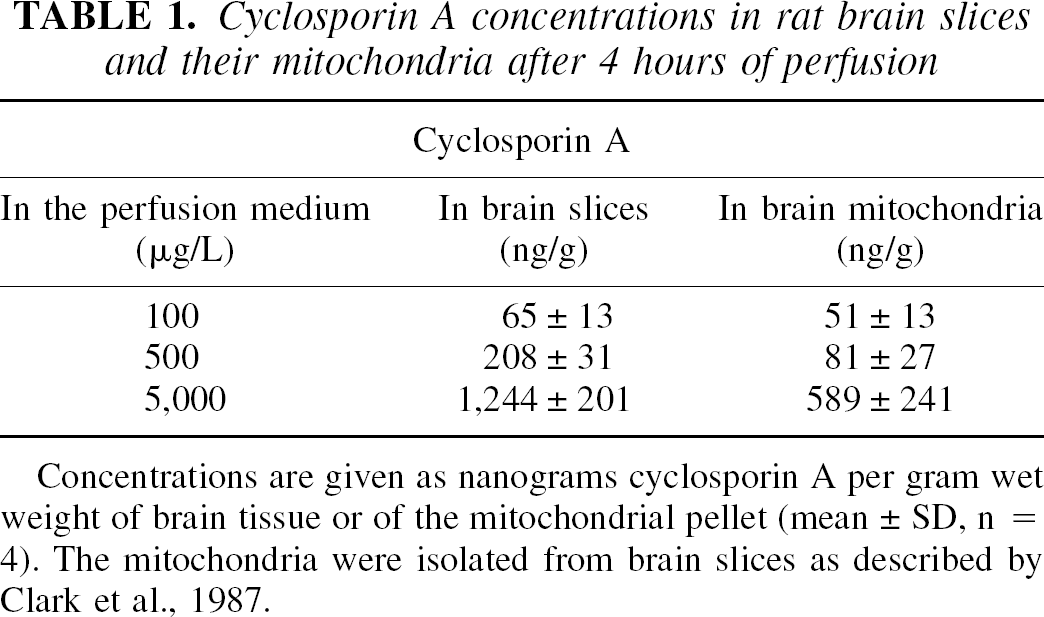
Concentrations are given as nanograms cyclosporin A per gram wet weight of brain tissue or of the mitochondrial pellet (mean ± SD, n = 4). The mitochondria were isolated from brain slices as described by Clark et al., 1987.
Concentration- and time-dependent effects of cyclosporin A (CsA) on high-energy phosphates in perfused rat brain slices evaluated using ex vivo 31 P-MRS
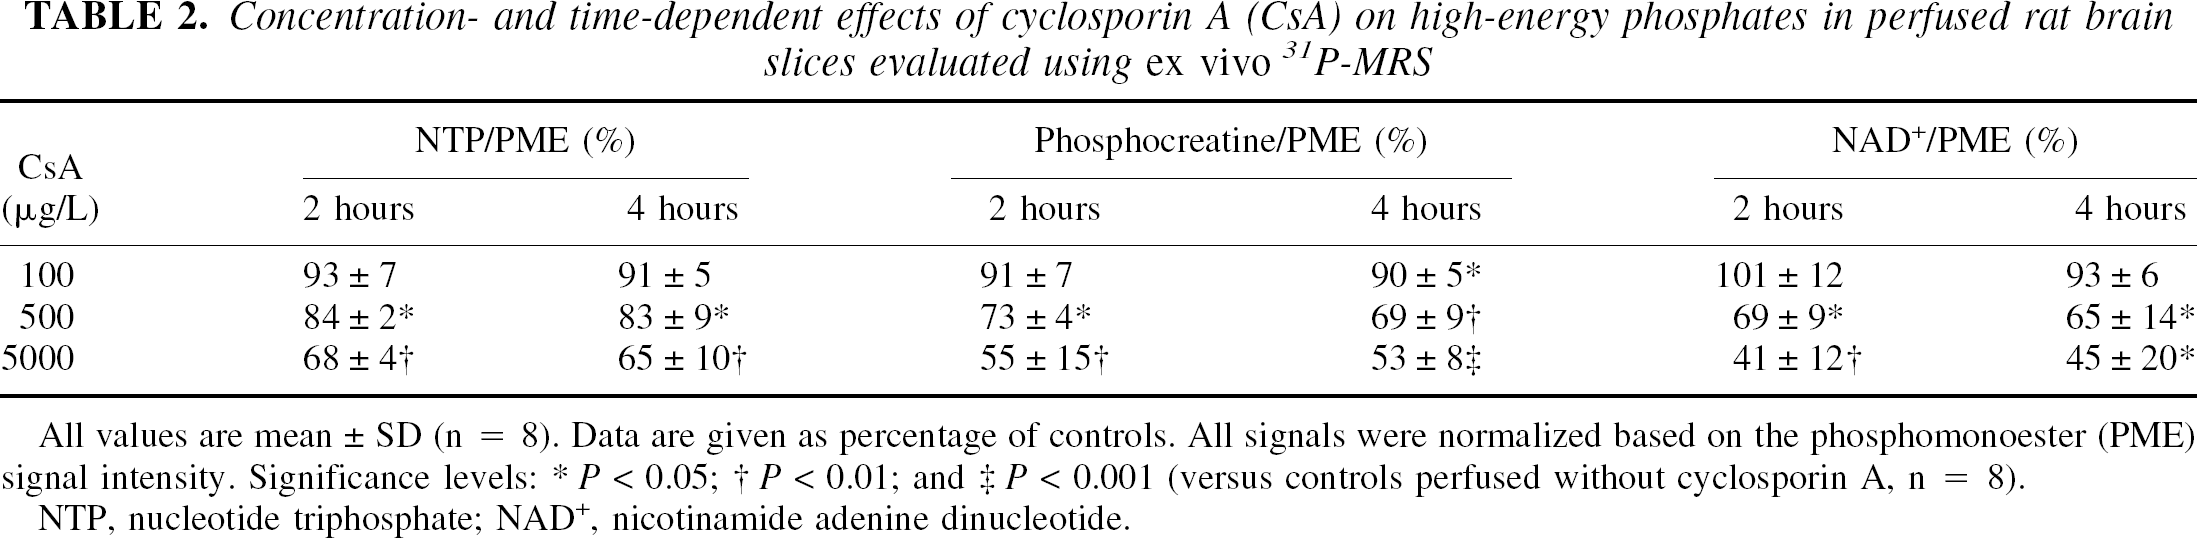
All values are mean ± SD (n = 8). Data are given as percentage of controls. All signals were normalized based on the phosphomonoester (PME) signal intensity. Significance levels:
P < 0.05
P < 0.01
P < 0.001 (versus controls perfused without cyclosporin A, n = 8).
NTP, nucleotide triphosphate; NAD+, nicotinamide adenine dinucleotide.
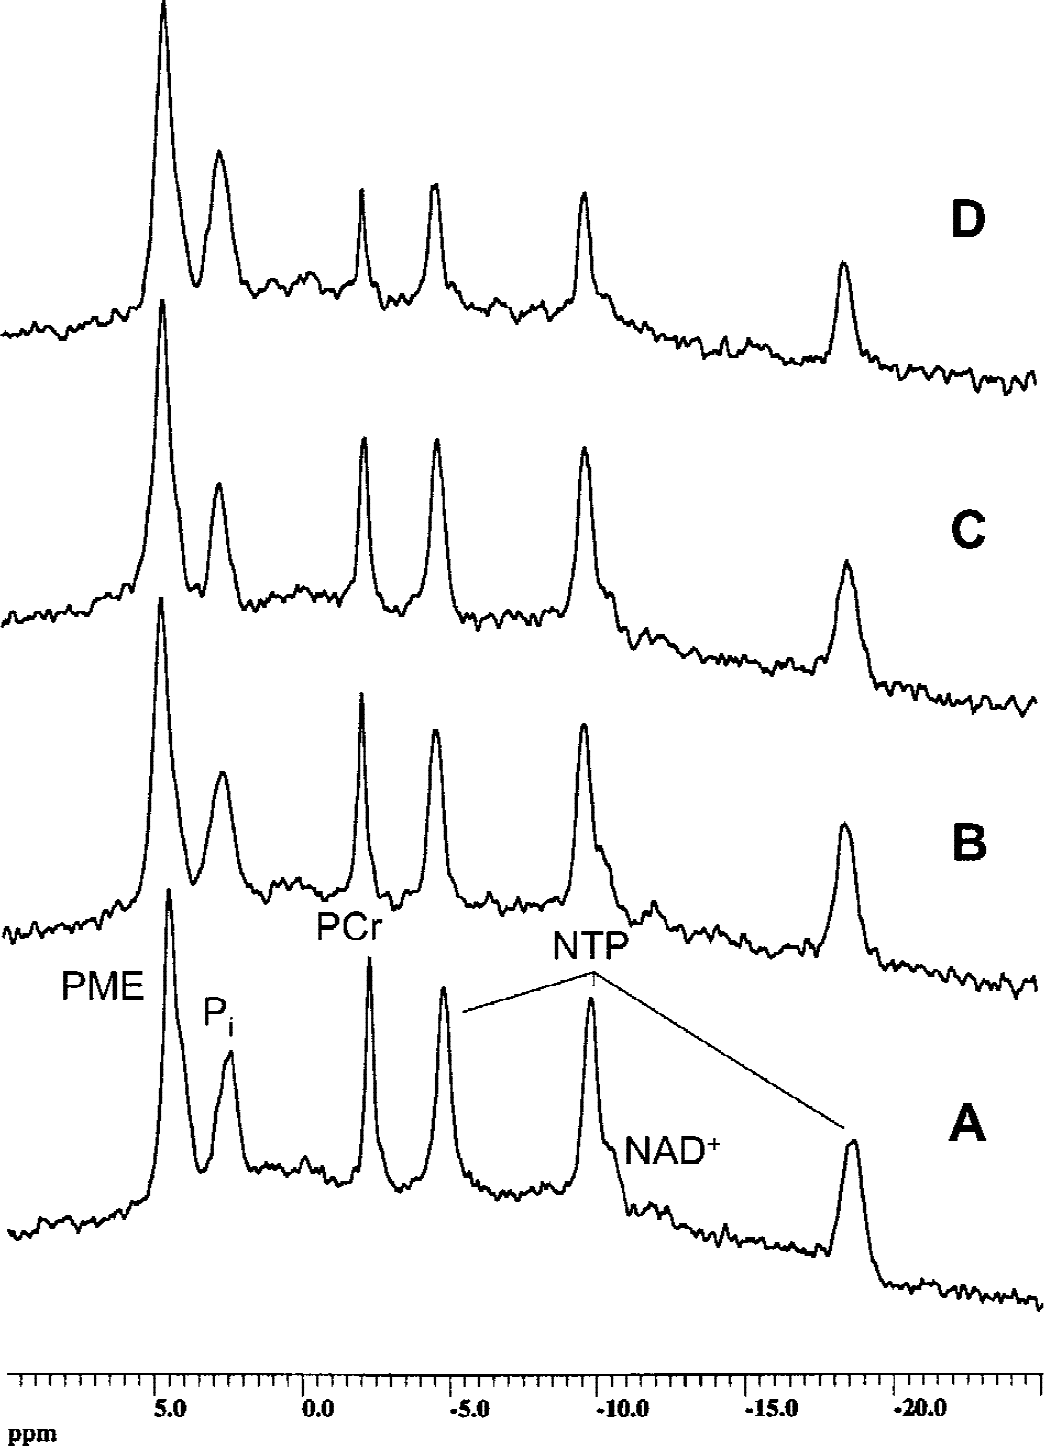
Representative ex vivo 31P magnetic resonance spectra of rat brain slices after perfusion with and without cyclosporin A.
Based on these results, we used a concentration of 500 μg/L cyclosporin A in the perfusion medium in subsequent studies. After perfusion with 500 μg/L cyclosporin A, brain slices were extracted using PCA, and water soluble metabolites were quantified using 1H-, 13C, and 31P-MRS. Figure 3 shows representative 1H magnetic resonance spectra of PCA extracts of brain slices. The peaks were assigned according to Govindaraju et al. (2000). After perfusion with 500 μg/L cyclosporin A, rat brain slices contained significantly lower concentrations of Krebs cycle metabolites, such as glutamate (77 ± 5% of controls), γ-aminobutyric acid (83 ± 3%), and aspartate (72 ± 7%) (P < 0.05, n = 4, Table 3). The intracellular concentration of N-acetylaspartate, a metabolic marker of neuronal viability (Kauppinen and Williams, 1994), was significantly decreased after perfusion with cyclosporin A (58 ± 12%, P < 0.01). The cyclosporin A-mediated reduction of phosphocreatine in the PCA extracts (in vitro, 69 ± 9%) and in perfused rat brain slices (ex vivo, 74 ± 12%, both P < 0.01 vs. controls) were similar (Tables 2 and 3). The same applied for NTP concentration changes (82 ± 9% in vitro versus 83 ± 9% ex vivo, P < 0.05 compared with controls), and for NAD+ concentrations (62 ± 25% in vitro vs. 45 ± 20% ex vivo, P < 0.05).
Effects of the perfusion of rat brain slices with 500 μg/L cyclosporin A (+ CsA) for 4 hours on cell metabolism evaluated using 1 H- and 31 P-MRS analyses of PCA tissue extracts
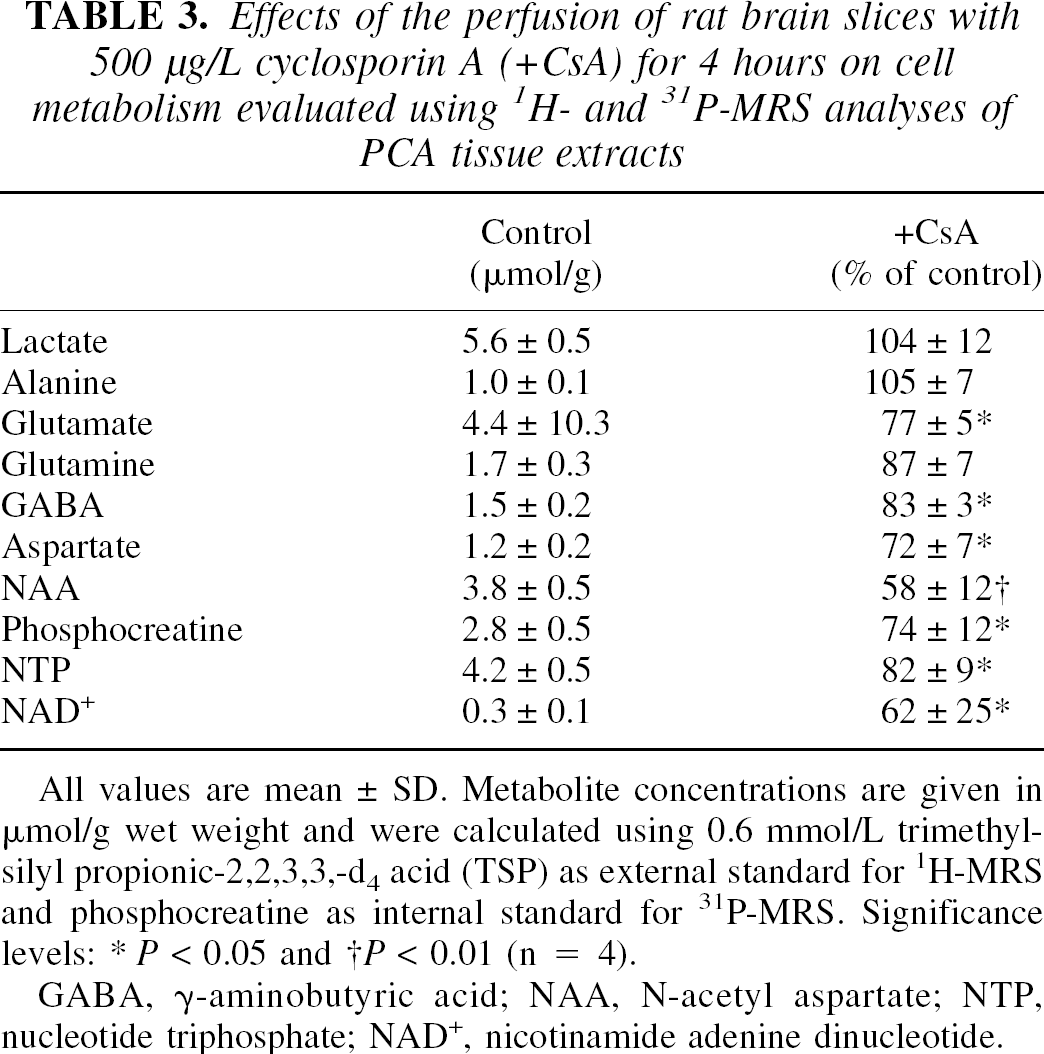
All values are mean ± SD. Metabolite concentrations are given in μmol/g wet weight and were calculated using 0.6 mmol/L trimethylsilyl propionic-2,2,3,3,-d4 acid (TSP) as external standard for 1H-MRS and phosphocreatine as internal standard for 31P-MRS. Significance levels:
P < 0.05
P < 0.01 (n = 4).
GABA, γ-aminobutyric acid; NAA, N-acetyl aspartate; NTP, nucleotide triphosphate; NAD+, nicotinamide adenine dinucleotide.
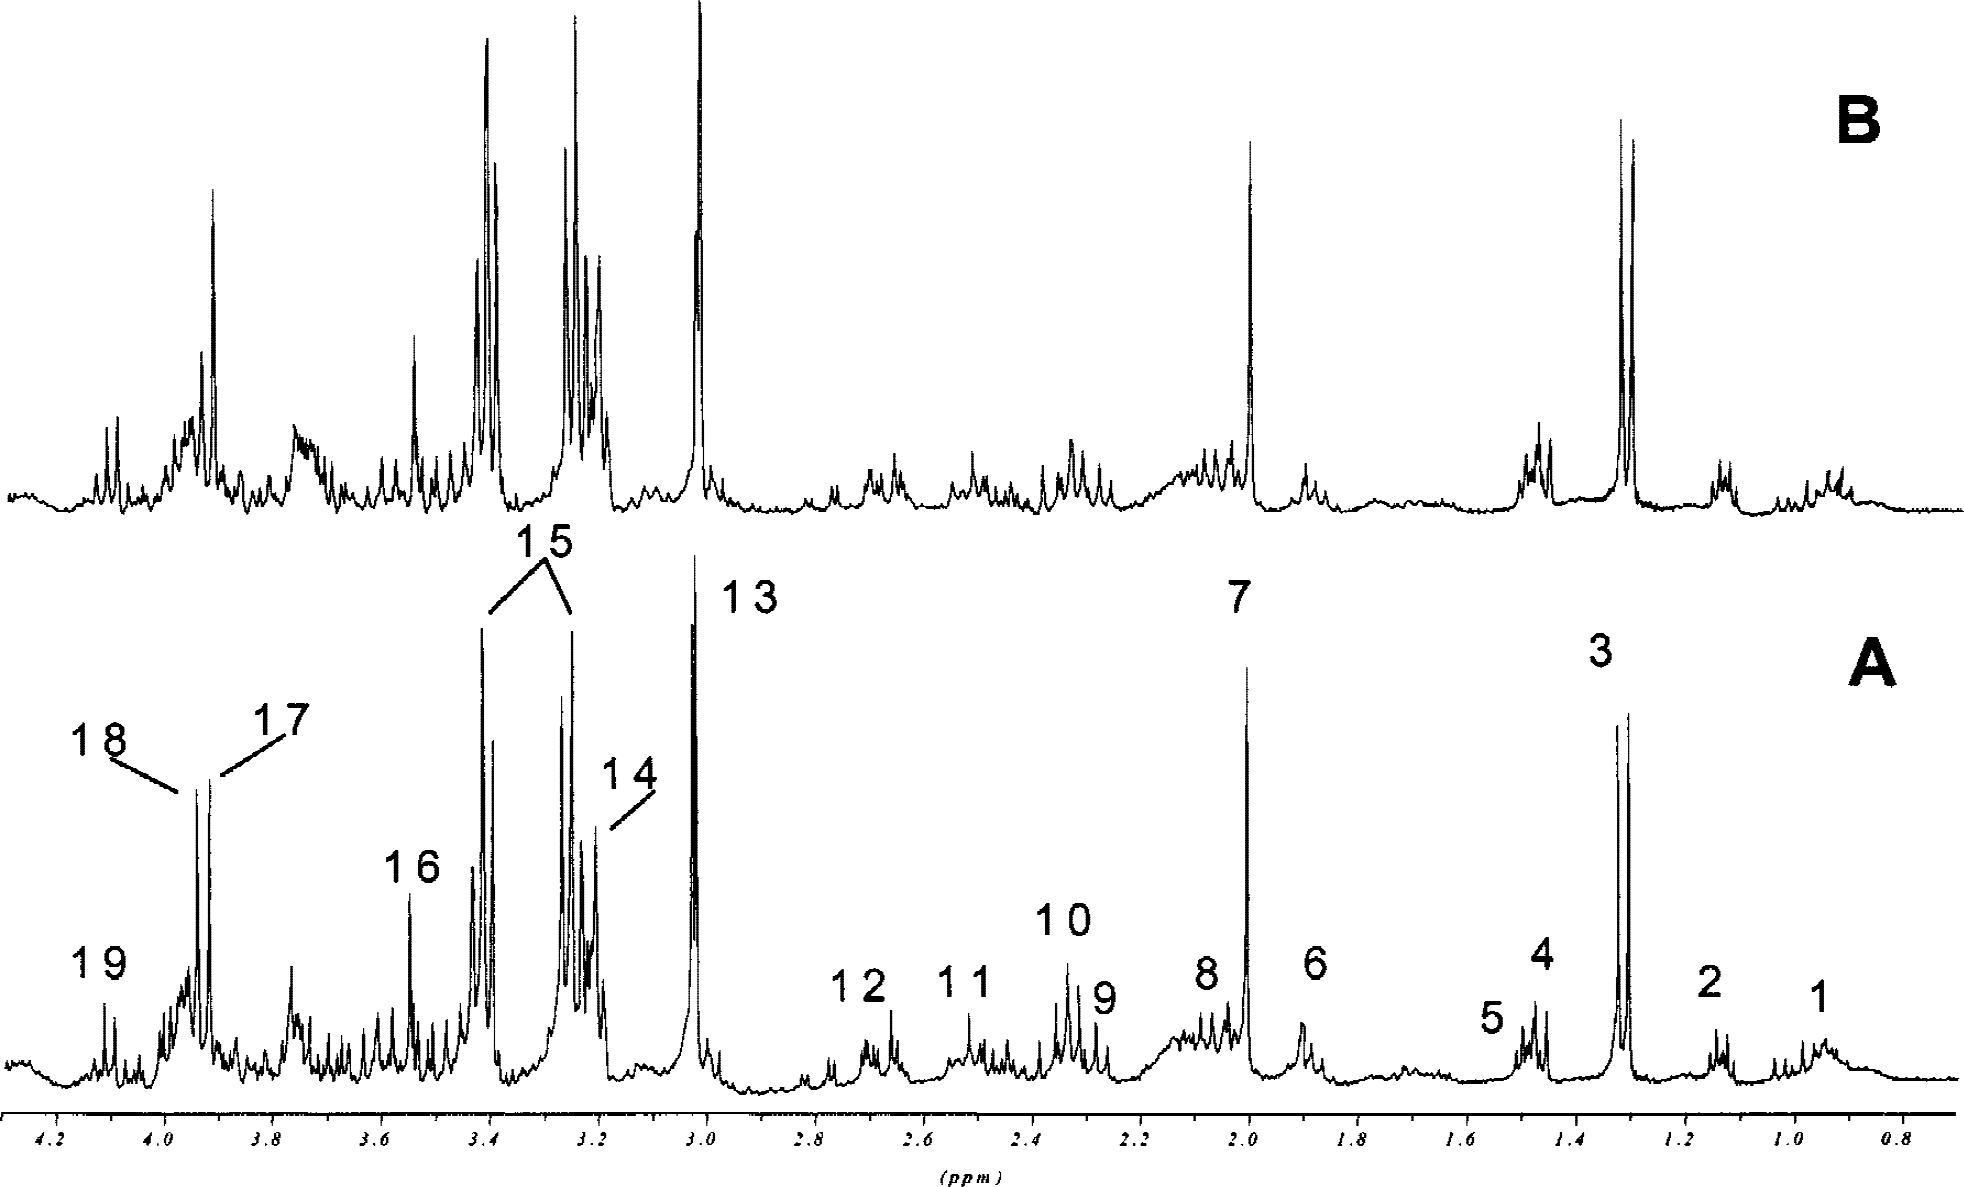
Representative in vitro 1H magnetic resonance spectra of PCA extracts from perfused rat brain slices after 4 hours of perfusion without
The 13C-MRS analyses of PCA brain slice extracts were carried out to trace the metabolism of [U-13C]-labeled glucose. After 4 hours of perfusion, the following 13C-labeled metabolites of glycolysis and the Krebs cycle were detected: lactate, alanine, serine (glycolysis products), and glutamate, glutamine, aspartate, and γ-aminobutyric acid (Krebs cycle products). We calculated the ratios Krebs cycle products/glucose and glycolysis products/glucose. Cyclosporin A decreased the ratio Krebs cycle products/glucose, indicating inhibition of the Krebs cycle (0.81 ± 0.04 with 500 μg/L cyclosporin A vs. 1.21 ± 0.04 with controls, P < 0.05). The ratio glycolysis products/glucose was not affected by 500 μg/L cyclosporin A after 4 hours.
Under normoxic conditions, perfusion with 500 μg/L cyclosporin A for 4 hours resulted in an increased formation of ROS (285 ± 78% of controls) as measured using dichlorofluorescein as a fluorescent marker (P < 0.001, Fig. 4). Perfusion of rat brain slices with hydrogen peroxide (1 mmol/L) for 30 minutes was used as a positive control. Hydrogen peroxide increased the ROS production to 414 ± 127% of the controls (P < 0.0001 compared with controls, P = ns compared with cyclosporin A-treated slices).
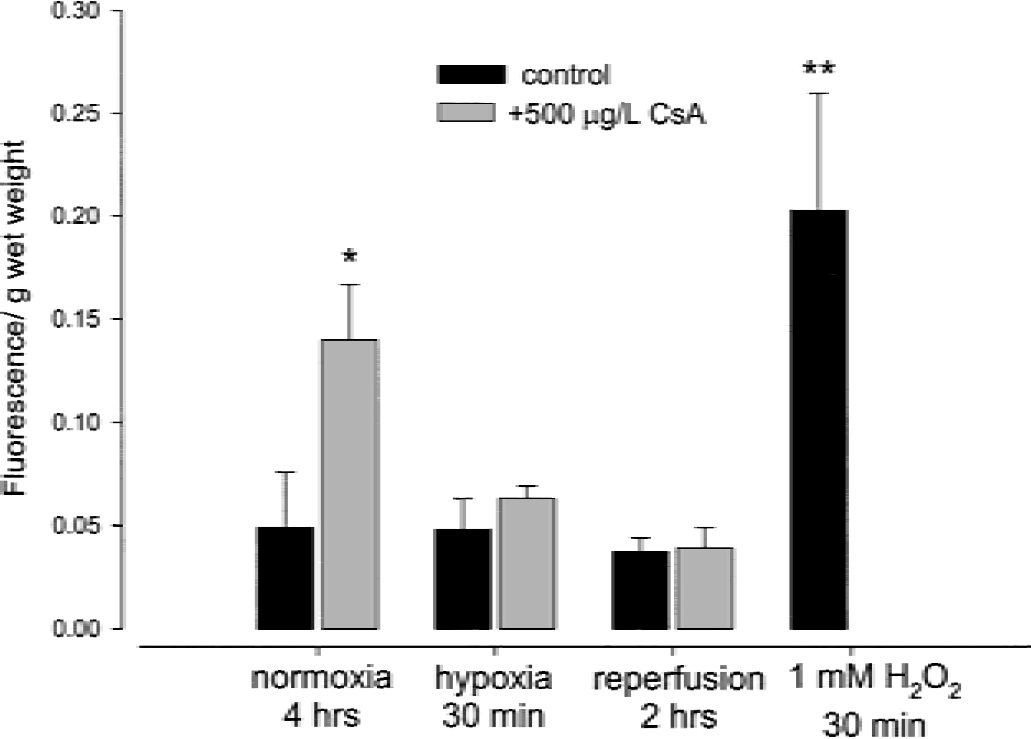
Reactive oxygen species formation in rat brain slices after perfusion with or without 500 μg/L cyclosporin A for 4 hours during normoxia, hypoxia, and reperfusion. Data is presented as mean ± SD (n = 4). *P < 0.001, **P < 0.0001.
Cyclosporin A slightly but significantly decreased the intracellular cytosolic Ca2+ concentrations after 6 minutes of normoxia as indicated by Fura-2 fluorescence experiments (87 ± 2% of controls, P < 0.0001, n = 3).
The effects of cyclosporin A on brain metabolism during hypoxia and reperfusion
To assess the concentration-dependent effects of cyclosporin A during hypoxia, we measured the cytosolic calcium concentrations in rat hippocampal neurons as a surrogate marker for hypoxic damage (Kristián and Siesjö, 1998). The neuronal Ca2+ concentration in normoxic controls was 170 ± 9 (n = 18) and 677 ± 94 nmol/L (n = 9, P < 0.001) after hypoxia for 30 min (pO2 < 5 mm Hg, Fig. 5). Under hypoxic conditions, the most effective cyclosporin A concentration to protect neurons against intracellular Ca2+ increase was 500 μg/L (257 ± 17 nmol/L Ca2+, n = 9, not significantly different from controls, Fig. 5). At cyclosporin A concentrations above 500 μg/L, the protective effect against an increase of cytosolic Ca2+ was inversely related to the cyclosporin A concentrations (hypoxia with 1,000 μg/L cyclosporin A, 380 ± 23 nmol/L, n = 6, P < 0.05; hypoxia with 2,000 μg/L cyclosporin A, 450 ± 21 nmol/L, n = 6, P < 0.01 compared with 500 μg/L cyclosporin A). Based on these results, we used a cyclosporin A concentration of 500 μg/L for the following MRS hypoxia-reperfusion studies.
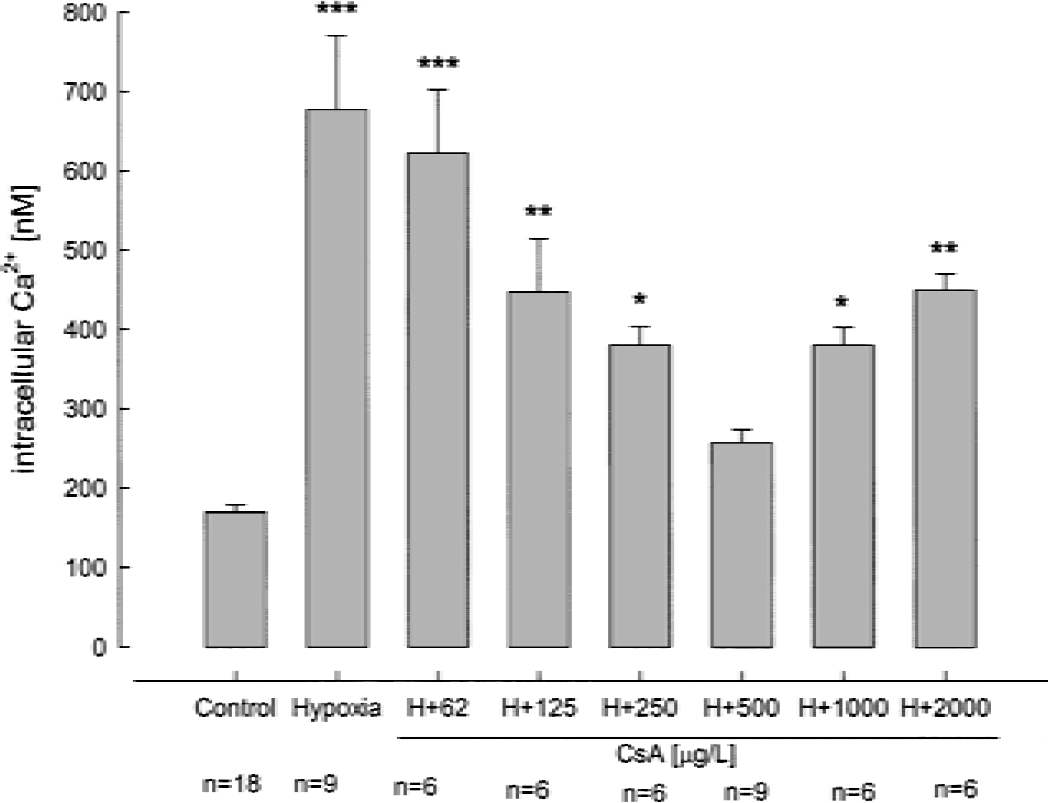
The concentration dependency of the effect of cyclosporin A on cytosolic free Ca2+ concentrations after 30 minutes of hypoxia. Data are mean ± SD. *P < 0.05, **P < 0.01, ***P < 0.001.
After 30 minutes of hypoxia, the intracellular pH in perfused rat brain slices, calculated from the difference in 31P magnetic resonance chemical shifts of inorganic phosphate to phosphocreatine, decreased to 6.2 ± 0.1 (pH 7.2 ± 0.1 under normoxic conditions, n = 5, P < 0.001). After 4 hours of perfusion and 30 minutes of hypoxia, 500 μg/L cyclosporin A protected the intracellular pH (6.2 ± 0.1 without vs. 6.6 ± 0.1 with cyclosporin A, n = 5, P < 0.01). Thirty minutes of hypoxia decreased the NTP concentrations to 11 ± 15% of controls (n = 5, P < 0.001, Fig. 6A), and phosphocreatine concentrations were below the limit of detection (Fig. 6B). Although 500 μg/L cyclosporin A significantly decreased NTP concentrations under normoxic conditions (Fig. 6A), the same cyclosporin A concentration significantly reduced the NTP decrease in brain slices under hypoxic conditions (11 ± 15% without vs. 35 ± 9% with cyclosporin A, n = 5, P < 0.05). The same was observed for phosphocreatine (Fig. 6B). During 2 hours of reperfusion with oxygenated medium, the brain slices perfused with cyclosporin A compared favorably with the hypoxic brain slices perfused without cyclosporin A in terms of pH and NTP and phosphocreatine concentrations (Fig. 6).
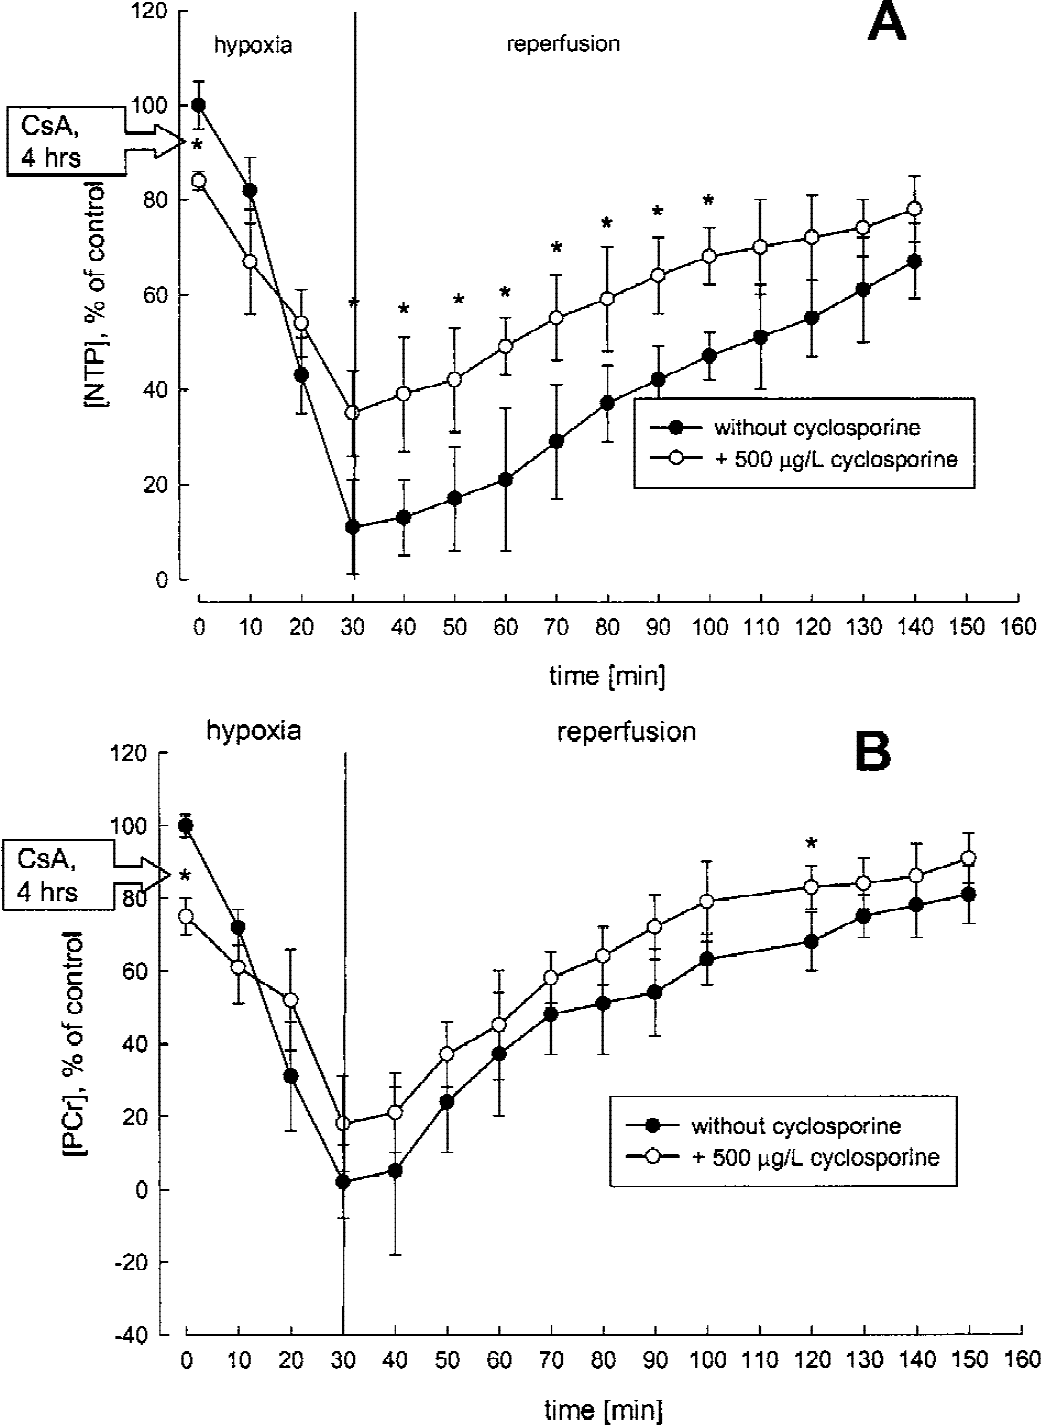
Time-dependent changes of high-energy phosphate concentrations in rat brain slices during hypoxia and reperfusion as continuously monitored by 31P-MRS.
The changes of [U-13C]-glucose use during hypoxia were evaluated in PCA extracts of perfused rat brain slices using 13C-MRS. The results of a representative experiment are shown in Fig. 7 (n = 5 for each study group). Compared with the normoxic controls, hypoxia led to complete consumption of [U-13C]-glucose by anaerobic glycolysis resulting in increased lactate concentrations (lactate/glucose ratio, 1,580 ± 303% of normoxic controls, n = 5, P < 0.0001, Fig. 7). The extracellular lactate/glucose ratio in the perfusion medium increased to 350 ± 75% of the normoxic controls (P < 0.001). After 30 minutes of hypoxia and in the presence of 500 μg/L cyclosporin A, [U-13C]-glucose consumption was significantly lower (lactate/glucose ratio, 475 ± 120% of normoxic controls, n = 5, P < 0.01 compared with normoxic controls and P < 0.001 compared with the brain slices exposed to hypoxia without cyclosporin A, Fig. 7). The extracellular lactate/glucose ratios in the perfusion medium increased only to 180 ± 43% of the normoxic controls (P < 0.05).
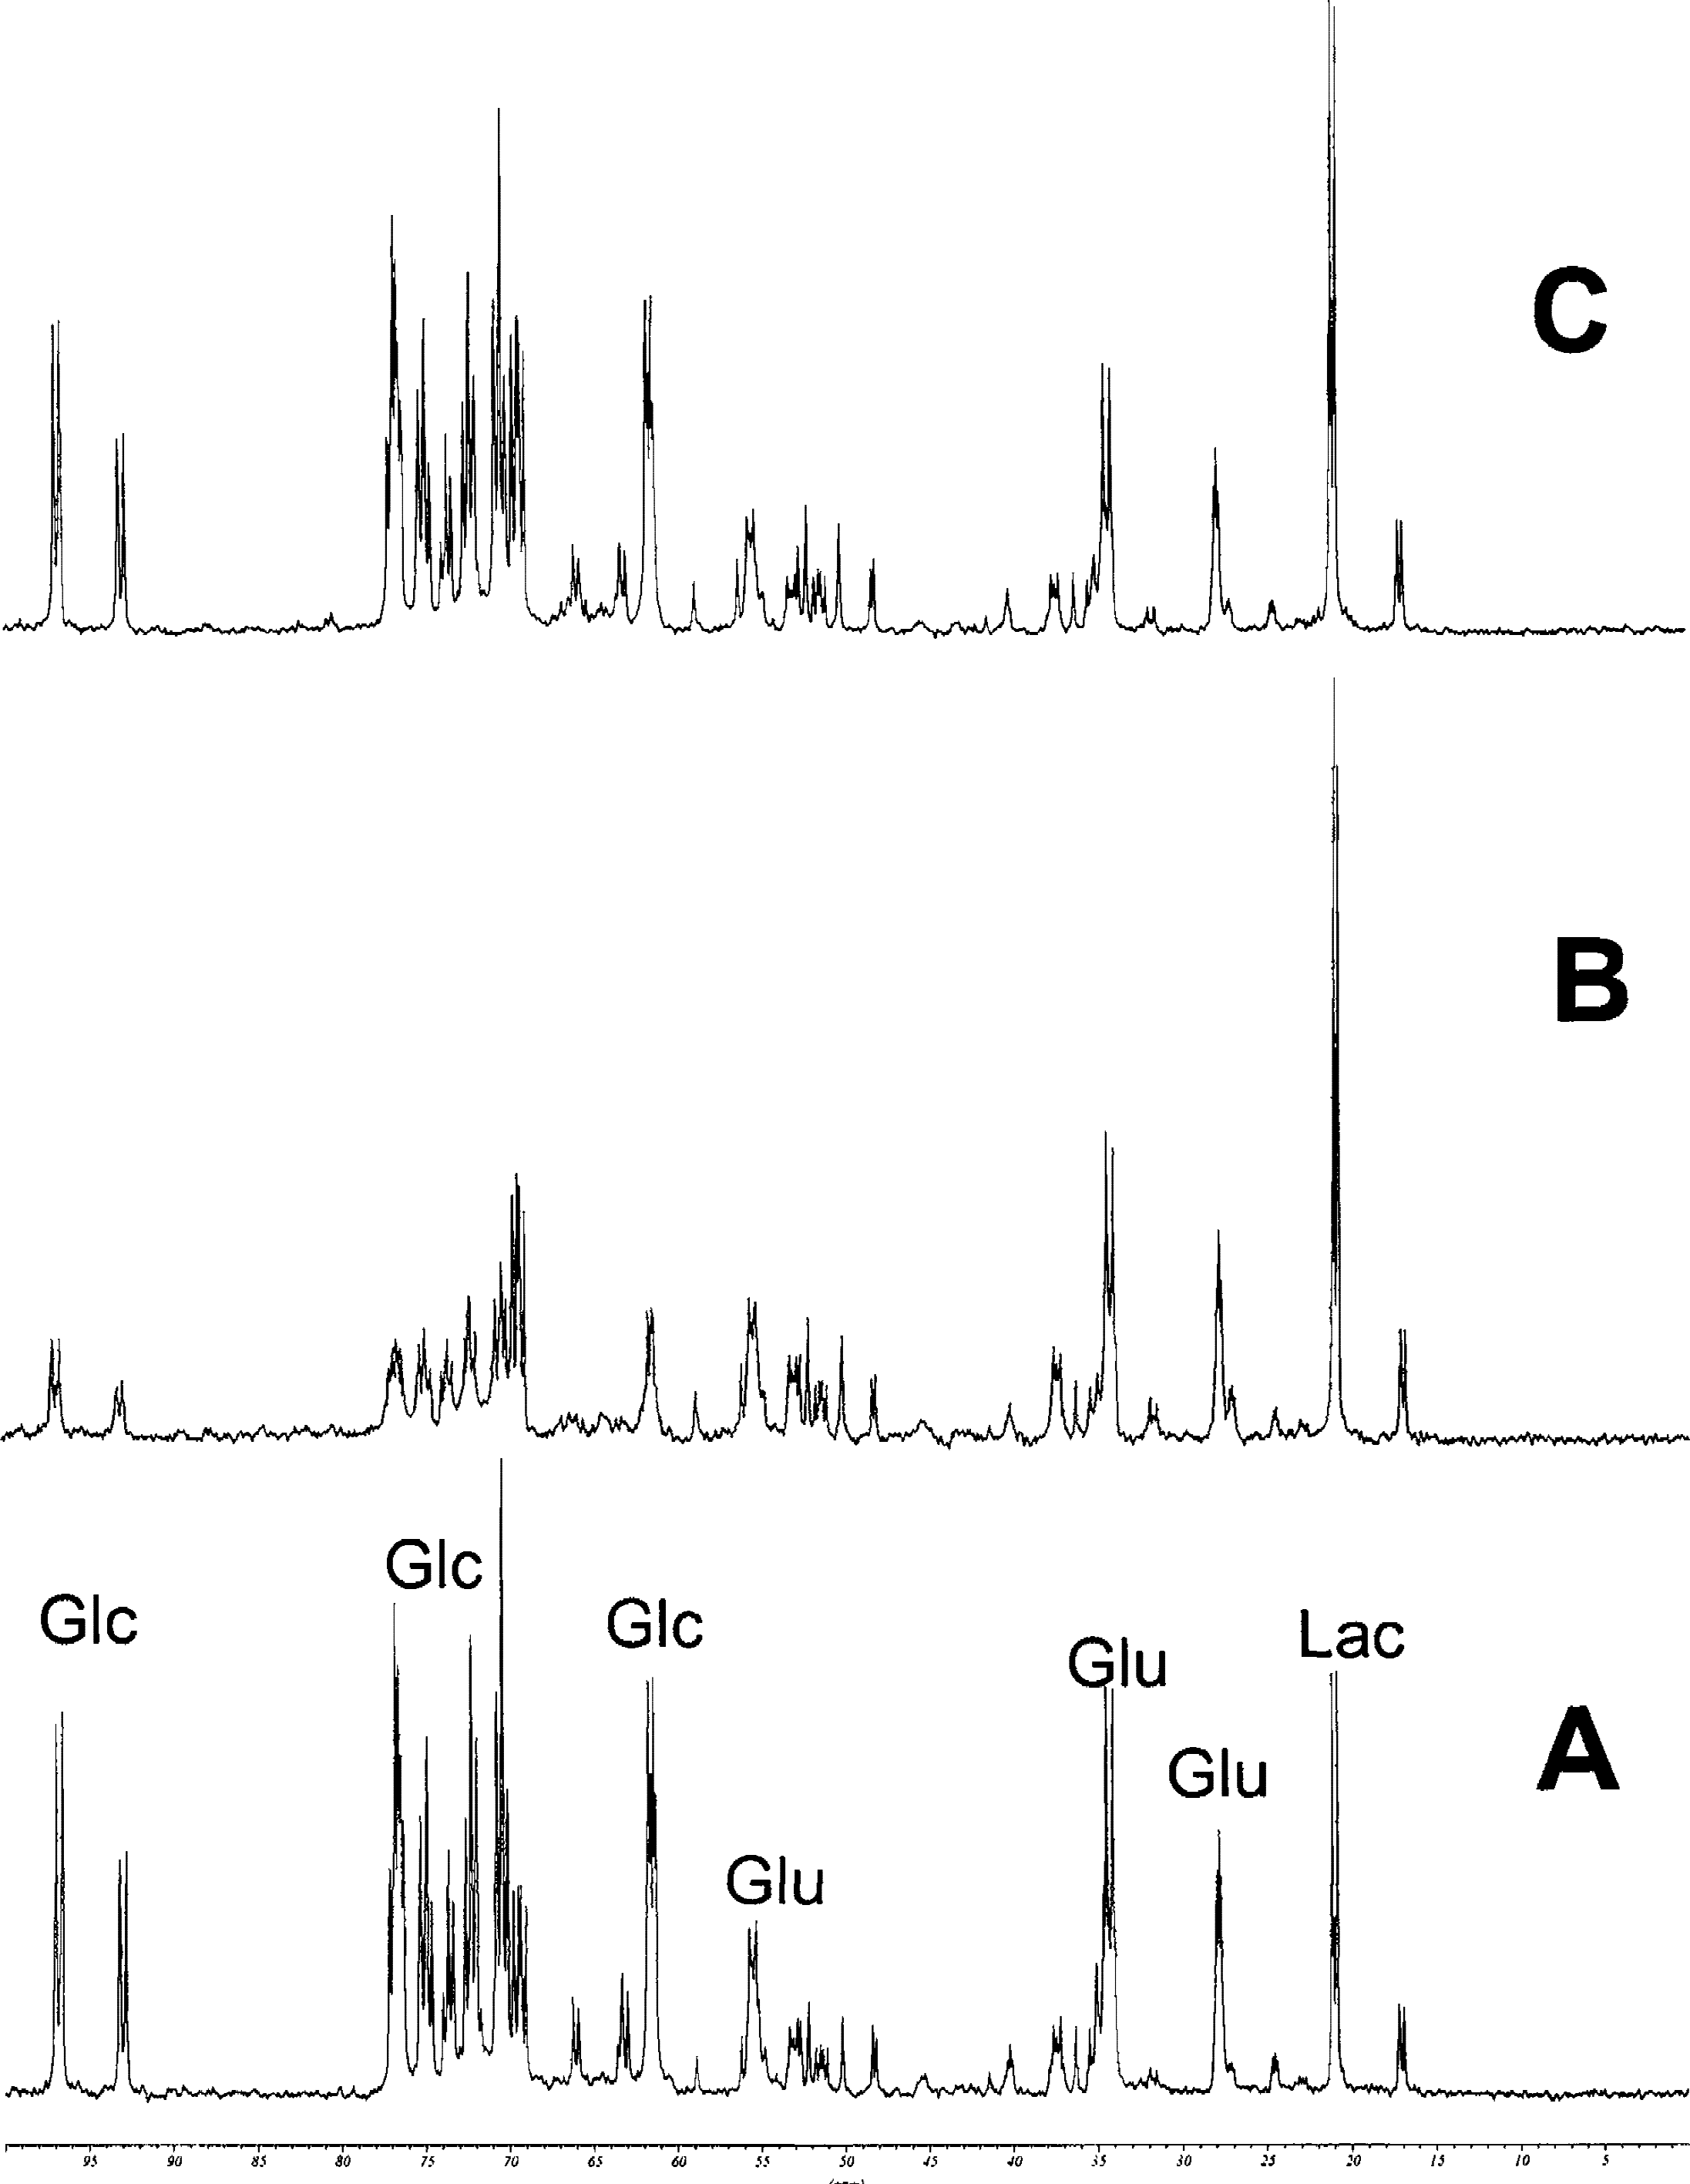
Representative 13C magnetic resonance spectra of PCA extracts of rat brain slices after 30 minutes of hypoxia and after perfusion with and without 500 μg/L cyclosporin A for 4 hours.
During hypoxia and after 2 hours of reperfusion, there was no significant difference in ROS formation in brain slices perfused with and without cyclosporin A (Fig. 4).
DISCUSSION
Our study showed that under normoxic conditions, cyclosporin A decreased mitochondrial energy production in the brain by inhibition of the Krebs cycle and oxidative phosphorylation. Under hypoxic conditions and at exactly the same concentration (500 μg/L), cyclosporin A protected energy metabolism, intracellular pH, and Ca2+ homeostasis. In contrast to the idea that low cyclosporin A concentrations are neuroprotective whereas high cyclosporin A concentrations are neurotoxic (Bechstein, 2000; Elimadi et al., 1997), our study indicated a significant overlap of cyclosporin A concentrations protecting brain metabolism against hypoxia, and those resulting in significant reduction of brain energy metabolism under normoxic conditions. In our study, cyclosporin A tissue concentrations in the range of 200 ng/g and mitochondrial cyclosporin A concentrations in the range of 80 ng/g were necessary to achieve a significant protective effect against hypoxia and reperfusion injury. Cyclosporin A only poorly penetrates the blood–brain barrier (Begley et al., 1990) because of p-glycoprotein–mediated transport from cells of the blood–brain barrier back into the capillary lumen (Schinkel et al., 1996). In a drug-distribution study in monkeys, we found that the brain tissue concentration of cyclosporin A is approximately 20% of the blood concentration (Serkova et al., 2000a). Based on these results, it can be estimated that blood concentrations of approximately 1,000 μg/L will be needed in patients with intact blood–brain barriers to reach cyclosporin A brain concentrations that are protective against ischemia-reperfusion injury. In transplant patients, the Cmax of cyclosporin A is usually in this concentration range; however, the trough blood concentrations are 5- to 10-fold lower (Cantarovich et al., 1998). Because of its narrow therapeutic range, an increase of cyclosporin A doses above those used in transplant patients is not a clinical option, and chemical, pharmacologic, or mechanical disruption of the blood–brain barrier will be needed to reach and maintain cyclosporin A concentrations in the brain after oral or intravenous administration that are effective as prophylaxis against cerebral ischemia and reperfusion injury in patients.
In our in vitro study, we showed that cyclosporin A distributed into brain mitochondria where it concentration-dependently decreased brain energy production in rat brain slices confirming our previous results (Serkova et al., 1999). The reduction of high-energy phosphates NTP and phosphocreatine were caused, at least in part, by inhibition of glucose metabolism via the Krebs cycle as indicated by decreased concentrations of the Krebs cycle products glutamate, aspartate, and glutamine. Inhibition of the Krebs cycle, mostly mediated trough the reduced production of NAD+, has a negative effect on oxidative phosphorylation. These metabolic changes in perfused rat brain slices were similar to those previously observed in the brain of rats treated with cyclosporin A for 1 week (Serkova et al., 2001). Derailment of the oxidative phosphorylation leads to increased production of ROS. Because ROS negatively affect oxidative phosphorylation, pyruvate dehydrogenase, and Krebs cycle enzymes, it is likely that ROS maintain and determine the extent of the cyclosporin A–mediated reduction of high-energy phosphates. Because cyclosporin A–induced decrease of mitochondrial membrane potential has been reported previously by various authors (Grub et al., 2000), the decrease of cytosolic Ca2+ in our study might indicate inhibition of mitochondrial Ca2+ efflux by cyclosporin A during normoxia, resulting in further distraction of mitochondrial homeostasis. Free radicals, NTP depletion, and depolarization of the mitochondrial membrane lead to increased MPT, apparently by increasing the pore sensitivity to calcium ions (Bernardi et al., 1994; Grub et al., 2000). However, cyclosporin A has been shown to inhibit opening of the MPT pore through binding on cyclophilin D, trapping Ca2+ in mitochondria (Crompton, 1999). Based on our results and the known inhibitory effect of cyclosporin A on MPT pore (Crompton, 1999), cyclosporin A seems to limit the consequences of its own negative effects on cell energy metabolism by inhibition of the MPT pore and, subsequently, by inhibition of the potentially disastrous effects of increased MPT pore opening, such as a massive efflux of Ca2+ and other mitochondrial contents into the cytosol and the possible induction of apoptosis during normoxia (Crompton, 1999).
During hypoxia and reperfusion cyclosporin A prevented excessive glucose use during glycolysis. Cyclosporin A also protected the intracellular pH, probably by reducing lactate production. However, quantification of lactate by MRS may not be a reliable parameter because during sample collection, tissues are hypoxic and aerobic glycolysis is stimulated. The rather small standard deviations of the lactate concentrations in Table 3 indicated that sample collection and preparation exhibited little variability and that comparison of lactate concentrations with those of the controls yielded valid information. Cyclosporin A also protected intracellular Ca2+ homeostasis during hypoxia. We found an inversely U-shaped concentration-effect relation between cyclosporin A concentrations and its protective effects on hippocampal cytosolic Ca2+ concentrations, an established surrogate marker for hypoxia-reperfusion injury (Kristián and Siesjö, 1998). Because it is a noninvasive technique, MRS allowed for the study of the time-dependent effects of cyclosporin A and hypoxia-reperfusion or both on cell metabolism. Our study clearly showed the negative effects of 500 μg/L cyclosporin A on the energy metabolism of rat brain slices before induction of hypoxia (Fig. 6), indicating that, after the start of hypoxia, the protective effects of cyclosporin A against hypoxia and its negative effects on cell energy metabolism were present at the same time. Considering the different NTP concentrations immediately before exposure to hypoxia in the brain slices perfused with and without cyclosporin A, hypoxia reduced the NTP concentration in the brain slices perfused without cyclosporin A by an average of 9.1-fold, but only 2.4-fold in those perfused with cyclosporin A.
Under normoxic conditions, addition of 500 μg/L cyclosporin A to the perfusion medium increased oxygen radical production to a level statistically not different from that after addition of 1 mmol/L hydrogen peroxide (positive control). Interestingly, the concentration of ROS under hypoxic conditions in the presence of cyclosporine was equal to those of the normoxic and hypoxic controls without cyclosporine. We do not yet have an explanation for this observation.
Under normoxic conditions, cyclosporin A somewhat mimics similar metabolic effects as hypoxia. During hypoxia, cyclosporin A protects mitochondrial metabolism and this protective effect is probably correlated to the inhibition of MPT, as indicated by our Ca2+ measurements. Hypoxia causes more drastic changes in cell metabolism and supersedes the negative effects of cyclosporin A on mitochondrial energy metabolism. It can be expected that during hypoxia, MPT pore inhibition of 500 μg/L cyclosporin A became more important for the overall effect of cyclosporin A on cell metabolism than its own negative effect on energy metabolism, resulting in protection of cell metabolism against hypoxia and reperfusion injury. As shown by cytosolic Ca2+ concentrations after hypoxia, cyclosporin A concentrations higher than 500 μg/L have less of a protective effect against hypoxia, possibly through a partial antagonization of the beneficial effects by a concentration-related increase of mitochondrial toxicity. Although inhibition of the MPT pore opening is an attractive model by which to explain our findings and the results of Ca2+ measurement support its involvement, it must be taken into account that our study design did not allow for further identification of the molecular mechanisms underlying the metabolic effects of cyclosporin A during hypoxia. Other mechanisms may also have significantly contributed to the protective effects of cyclosporin A during hypoxia. For example, by inducing metabolic changes similar to hypoxia, cyclosporin A may also have preconditioning effects on hypoxia.
Our study indicated that cyclosporin A has two simultaneous actions in brain cells. First, it inhibits the Krebs cycle and oxidative phosphorylation, resulting in reduction of high-energy phosphates and increased ROS formation. Second, cyclosporin A inhibits an increase of cytosolic Ca2+ concentrations, probably at least partially due to the inhibition of MPT. Under normoxic conditions, inhibition of mitochondrial energy metabolism is the leading effect, whereas under hypoxic conditions the inhibition of Ca2+ efflux and protection of mitochondrial function is observed. High cyclosporin A concentrations reduce the beneficial effect of cyclosporin A during hypoxia, probably because of the increased inhibition of mitochondrial energy metabolism by cyclosporin A. We conclude that whether cyclosporin A inhibits or protects mitochondrial energy production depends on both the concentrations of cyclosporin A and oxygen.