
Abstract
In spite of several evidences for a mitochondrial impairment in Parkinson's disease (PD), so far it has not been possible to show in vivo mitochondrial dysfunction in the human brain of PD patients. The authors used the high temporal and spatial resolution 31 phosphorus magnetic resonance spectroscopy (31P MRS) technique, which they have previously developed in normal subjects and in patients with mitochondrial diseases to study mitochondrial function by observing high-energy phosphates (HEPs) and intracellular pH (pH) in the visual cortex of 20 patients with PD and 20 normal subjects at rest, during, and after visual activation. In normal subjects, HEPs remained unchanged during activation, but rose significantly (by 16%) during recovery, and pH increased during visual activation with a slow return to rest values. In PD patients, HEPs were within the normal range at rest and did not change during activation, but fell significantly (by 36%) in the recovery period; pH did not reveal a homogeneous pattern with a wide spread of values. Energy unbalance under increased oxidative metabolism requirements, that is, the postactivation phase, discloses a mitochondrial dysfunction that is present in the brain of patients with PD even in the absence of overt clinical manifestations, as in the visual cortex. This is in agreement with our previous findings in patients with mitochondrial disease without clinical central nervous system (CNS) involvement. The heterogeneity of the physicochemical environment (i.e., pH) suggests various degrees of subclinical brain involvement in PD. The combined use of MRS and brain activation is fundamental for the study of brain energetics in patients with PD and may prove an important tool for diagnostic purposes and, possibly, to monitor therapeutic interventions.
Keywords
Introduction
Parkinson's disease (PD) is the second most common neurodegenerative disease after Alzheimer disease (Bradley et al, 2004). While PD is a sporadic condition of uncertain etiology (Bradley et al, 2004), several lines of evidence suggest that a defect in oxidative phosphorylation contributes to its pathogenesis. For instance, 1-methyl-4-phenyl-1,2,3,6-tetrahydropyridine (MPTP), a neurotoxin that blocks complex I (NADH-ubiquinone oxidoreductase) of the mitochondrial electron transport chain (Langston et al, 1983) recapitulates in humans the hallmarks of PD (Betarbet et al, 2003; Javitch et al, 1985). Reduction in complex I activity has been reported in PD tissues (Benecke et al, 1993; Haas et al, 1995; Krige et al, 1992; Mizuno et al, 1989; Schapira et al, 1989, 1998; Swerdlow et al, 1996). Postmortem and experimental studies have consistently implicated oxidative damage (Beal, 1995; Cassarino et al, 1997) in PD pathogenesis, but the source of this damage has not been clear. Leading candidates for production of reactive oxygen species include dopamine metabolism and dysfunction of mitochondria (Beal, 1995; Cassarino et al, 1997). Together, these studies suggest that disrupted mitochondrial complex I activity and oxidative stress may all participate in the killing of dopaminergic neurons in PD. In turn, normal mitochondrial activity may be affected by environmental chemicals (both natural and synthetic) (Betarbet et al, 2003; Berenguer et al, 2003; Chan et al, 2004) and by mitochondrial DNA and nuclear genes polymorphisms and mutations (Ikebe et al, 1995; Shoffner et al, 1993; Mann et al, 1992; Bandmann et al, 1997), which are all implicated in PD pathogenesis. Synuclein overexpression and inactivation of parkin can cause mitochondrial dysfunction (Hyun et al, 2002; Palacino et al, 2004; Beal, 2004), and the recent discovery of PINK1, a putative mitochondrial protein kinase that is implied in some cases of PD (Valente et al, 2004), has opened new avenues of investigation into both basic mitochondrial biology and neurodegenerative disease. Finally, neuroleptic medications used to treat psychiatric and other disorders can induce Parkinsonism in humans. Burkhardt et al (1993) studied the effects of representative compounds from several classes of neuroleptic drugs and found that they tend to be very potent inhibitors of rat brain complex I activity. Interestingly, the propensity of these agents to cause extrapyramidal symptoms generally correlates with their potency as complex I inhibitors.
Although the magnitude of the complex I defect in PD is unclear (range 16% to 71%, in published studies), even small perturbations of the electron transport chain may carry pathogenic significance (Parker et al, 1989; Shoffner et al, 1991; Swerdlow et al, 1997), since the effects of bioenergetic processes on cellular metabolism are protean.
In spite of the above several evidences pointing to a mitochondrial impairment in PD, so far it has not been possible to show directly mitochondrial dysfunction in vivo in the human brain of PD patients. In fact, an exhaustive investigation of brain mitochondrial function in vivo implies the study of brain energetics at rest, during activation, and during recovery, which is difficult to do in the human brain (Chance et al, 1986; Diehl et al, 1992; Kato et al, 1996; Rango et al, 1997, 2001). Although 31 phosphorus magnetic resonance spectroscopy (31P MRS) seems able to do this, so far no such studies have been performed because of spatial and temporal resolution methodological problems (Diehl et al, 1992).
The main function of mitochondria is to maintain adequate concentration of high-energy phosphates (HEP) in the cells, most of the HEP being produced by oxidative phosphorylation (Chance et al, 1986; Erecinska and Silver, 1989; Siegel et al, 1981; Siesjo, 1978). We have recently developed a system to study brain energetics and mitochondrial function in the human brain by observing HEP in the brain visual areas by 31P MRS during very short activation with a spatial resolution better than 10 cm3 (Rango et al, 1997, 2001). We have validated this method in normal subjects and have shown that a mitochondrial impairment is detectable in the visual cortex of patients with mitochondrial diseases even in the absence of clinical or instrumental sign of clinical central nervous system (CNS) involvement (Rango et al, 2001). We have described how HEPs change during activity and recovery, in a quantitative way (Rango et al, 2001). In the current study, the authors used this technique to investigate the mitochondrial function of the visual cortex in 20 patients affected by PD at rest, during, and after sustained visual stimulation.
Materials and methods
Patient Population
Twenty nondemented patients with PD without history of hallucinations (10 men, 10 women) were included in the current study. Patients with other causes for Parkinsonism or with atypical clinical features were excluded from the study. Patients with a history of neuroleptic assumption were excluded from the study. Subjects with previous exposure to hydrocarbon solvents were also excluded from the study (Rango et al, 2000). Patients with known alphasynuclein or parkin gene mutations or polymorphisms were excluded from the study (Polymeropolous et al, 1997; Kitada et al, 1998). Patients with familiar PD were also screened for PINK1 mutations (Valente et al, 2004) (no mutation or polymorphism found).
In all cases, the diagnosis of PD was based according to the UK Parkinson's Disease Society Brain Bank (Hughes et al, 1992). Patients with poor L-dopa response were excluded from the study. All patients were on L-dopa therapy either together with dopamine agonists (six patients) or without (14 patients). The mean age was 63 (standard deviation (s.d.) 9) years, mean L-dopa dosage was 653 mg ± 237 (s.d.), six of them had positive family history for Parkinsonism, and the mean length of disease was 7 years ± 2.5 (s.d.). Five patients had a Hoehn and Yahr scale = 1, eight patients = 2, and seven patients = 3 in the ‘on’ phase. Full ophthalmologic and neurological examinations, standard T1-, T2-, and proton density-weighted magnetic resonance imaging (MRI) brain studies, EEG, flash, and pattern reversal visual-evoked potential were performed to exclude patients with any of the following: symptoms or signs of CNS involvement on neurologic examination, other than the basal ganglia, abnormal brain MRI studies, abnormal EEG, abnormal ophthalmologic examinations, and abnormal visual-evoked potentials. Patients with other diseases or those taking drugs of any kind other than anti-Parkinsonian were also excluded. Twenty normal subjects matched with PD patients for age (62 years, s.d. 13) and sex (10 men, 10 women) were studied. Each patient was matched with one normal subject of the same age (age difference <5 years) and sex. Normal subjects were defined as having no history of neurologic disease, no history of major disease, a normal neurologic examination, a normal ophthalmologic examination, and normal T1- and T2-weighted MRI brain studies; also, they were not taking any drug. Subjects also underwent pattern reversal visual-evoked potential, which were normal. Vascular risk factors were excluded. Also, normal subjects with parkin gene mutations or polymorphisms were excluded from the study.
All patients and control subjects gave informed consent. The project has been approved by the national institute of health and by the local ethical committee.
Phosphorus Magnetic Resonance Spectroscopy
In those patients who were on dopamine agonist therapy (six patients), assumption was stopped 1 week before MRS study. Magnetic resonance spectroscopy studies were performed 1 h after assuming L-dopa therapy. In two patients with minimal tremor, studies were repeated after 12 h off therapy. The authors used a 1.5 T (Siemens, Erlangen, Germany) MR system. Phosphorus MRS-localized spectra were obtained from the visual cortex as previously fully described (Rango et al, 1997, 2001). Briefly, the authors localized the primary visual cortex on the basis of standard T1 MRI images. Free induction decays (FIDs) were obtained with a 5 cm diameter transmitter–receiver surface coil mounted on a sliding carriage positioned under the visual cortex. Acquisition parameters were a repetition time of 2 secs and a flip angle between 40° and 60° to avoid saturation effects. A spectroscopy reference tube containing a saline solution of phenylphosphonic acid (15 mmol/L) was placed on the opposite side of the coil. The authors have shown that under these conditions, the signal is derived from a calculated sampled volume ≤ 10 cm3, which corresponds mainly to the posterior calcarine cortex, with only a minor contribution from the underlying optic radiations and the surrounding V2 visual cortex and without muscle contamination (Rango et al, 1997, 2001). The mean calculated sample volume did not differ between normal subjects and patients (P = NS). Head and coil were fixed to a custom-made head holder that in turn was fixed to the MRI table. A repeat T1 MR imaging study was obtained at the end of spectra collection and compared with images obtained at the beginning of the spectra collection; studies were discarded if head positioning had changed. Blocks of 16 FIDs were collected for each of three 7-min periods—at rest, during visual stimulation, and after visual stimulation. The method used to deliver visual stimulation has also been fully described (Rango et al, 1997). Briefly, it was delivered by goggles (Grass) that flashed at 8 Hz to reproduce a stimulation pattern used in the previous work (Fox et al, 1988; Rango et al, 1997, 2001; Blamire et al, 1992). The authors used an infrared-driven computerized system that they developed connected to the MR system computer by which goggles were automatically turned on after 7-min acquisition and turned off after 14-min acquisition. The following variables were analyzed: beta adenosine triphosphate (βATP), phosphocreatine (PCr), PCr/βATP ratio, inorganic phosphate (Pi), pH, and phosphodiesters (PDE). Because PCr and ATP are linked together in a bidirectional pH-dependent chemical reaction in which ATP is formed by PCr and vice versa with a 1:1 (PCr:ATP) molar ratio, the PCr + βATP variable was calculated and was then used for the following calculations. The values for each variable were normalized to the reference compound signal and expressed in arbitrary units. The PCr/Pi ratio in the three conditions and the PCr/βATP ratio at rest were also calculated.
Data were acquired with a spectral width of 2,000 Hz and 2,048 digitized points. Free induction decays were averaged off-line by custom-made analysis software that allowed automated averaging and data processing. Averaged FIDs were Fourier transformed after convolution difference (exponential line broadening = 150 Hz) and apodization (exponential multiplication = 20 Hz). Peak areas were obtained by the classical Levenberg–Marquardt frequency domain fitting method (assuming the presence of seven resonance lines corresponding, respectively, to phosphomonoester, Pi, PDE, PCr, γ-, α- and βATP). Polynomial baseline correction was applied. Brain pH was calculated as previously described (Petroff et al, 1985; Rango et al, 1990). Spectra were analyzed without knowledge as to the origin of the spectra (patients or control subjects).
Proton Magnetic Resonance Spectroscopy
Single voxel MRS water-suppressed spectra were obtained from volumes of interest (8 mL) centered on the visual cortex–occipital lobe. A point-resolved spectroscopy (PRESS) sequence was used. Acquisition parameters were time to repetition (TR), 2,000 ms, and time to echo (TE), 270 ms, 256 acquisitions. Data processing included Gaussian filtering (1 Hz line broadening), Fourier transformation, and phase correction. No baseline correction was applied. Peak areas from Cr, choline-containing compounds (Cho), and N-acetyl aspartate (NAA) were calculated. Ratios (to Cr) peak were calculated. Spectra were analyzed without knowledge as to the origin of the spectra (patients or control subjects). Fully relaxed water signal was also acquired (TR = 10,000) and absolute concentrations for NAA were calculated using the fully relaxed water signal as an internal standard of reference (Davie et al, 1995; Rango et al, 2000).
Statistics
Normal ranges were calculated for each experimental condition (mean ± 2 s.d.). Two-tailed t-tests, analysis of variance (ANOVA), and correlation coefficients (r) were used for statistical analysis. Bonferroni's correction for multiple comparisons was applied. Statistical significance exceeding P < 0.001 was reported at P < 0.001.
Results
The respective mean PCr/βATP ratios at rest in normal subjects and patients were 1.68 (±0.25, s.d.) and 1.65 (±0.23, s.d.) with the ratio within the normal range (1.03 to 2.14) in all patients. The mean pH at rest was 6.95 (±0.09, s.d.) in normal subjects compared with 6.97 (±0.15, s.d.) in patients (P = NS) (Figure 1). In normal subjects, the mean pH increased significantly during activation (7.07 ± 0.08, s.d.; P < 0.001), and then returned towards resting values during recovery (7.00 ± 0.07, s.d.; P = 0.05) (Figure 1). No significant change was found in mean pH in patients during activation or recovery, with the mean pH not differing between rest, activation (7.00 ± 0.10, s.d.), and recovery (6.98 ± 0.12, s.d.) (ANOVA, P = NS) (Figure 1).
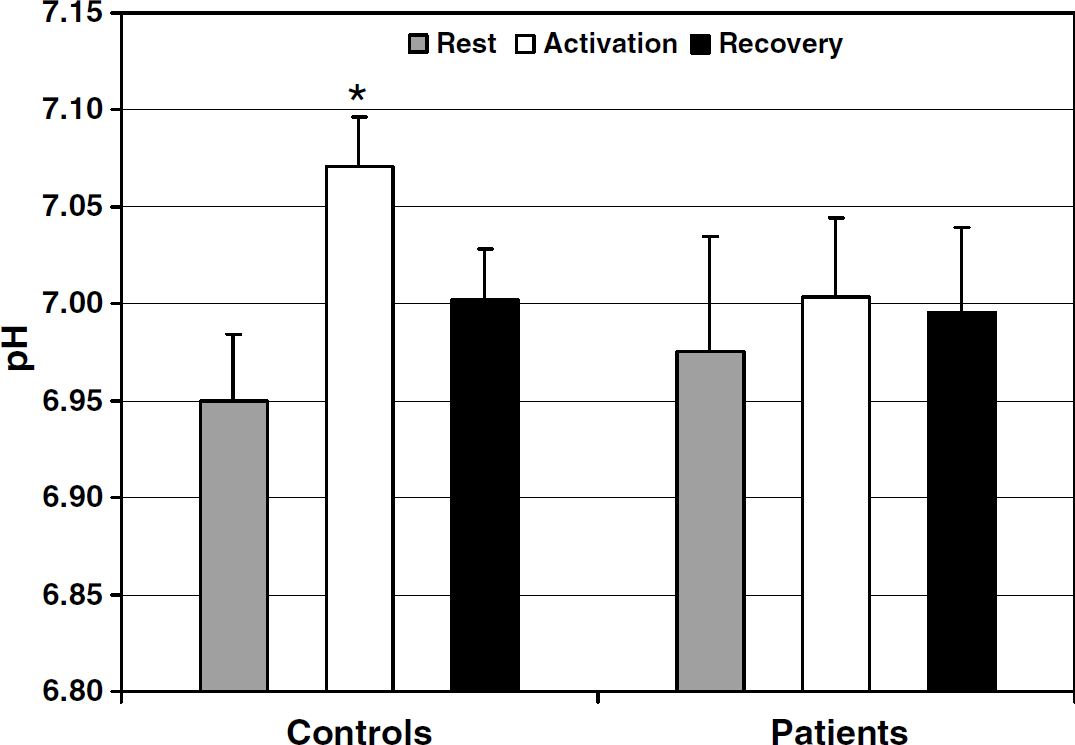
Bar graph shows pH values in patients and controls (mean + standard error of mean (s.e.m.)) in the three experimental conditions. In normal subject, there is a significant increase of mean intracellular pH during brain activation (*P < 0.001, paired t-test) with a slow return toward normal values during recovery. No significant changes of intracellular pH are found in Parkinson's disease (PD) patients. Note that s.e.m.s are greater in PD patients.
No difference was observed in the mean PCr + βATP at rest of the normal subject and the patient groups (11.92 ± 1.54 s.d. versus 12.07 ± 2.09 s.d.; P = NS) (Figure 2). In the former group, the mean PCr + βATP did not vary significantly during activation (12.07 ± 1.43, s.d.; P = NS) but rose significantly (by 16%) during recovery (13.85 ± 1.29, s.d.; P < 0.001) (Figure 2); subanalysis of βATP also showed a significant increase (P < 0.005). In normal subjects, no relation was found between age and PCr + βATP at rest (r = 0.07, NS), during stimulation (r = 0.13, NS), and during recovery (r = 0.05, NS).
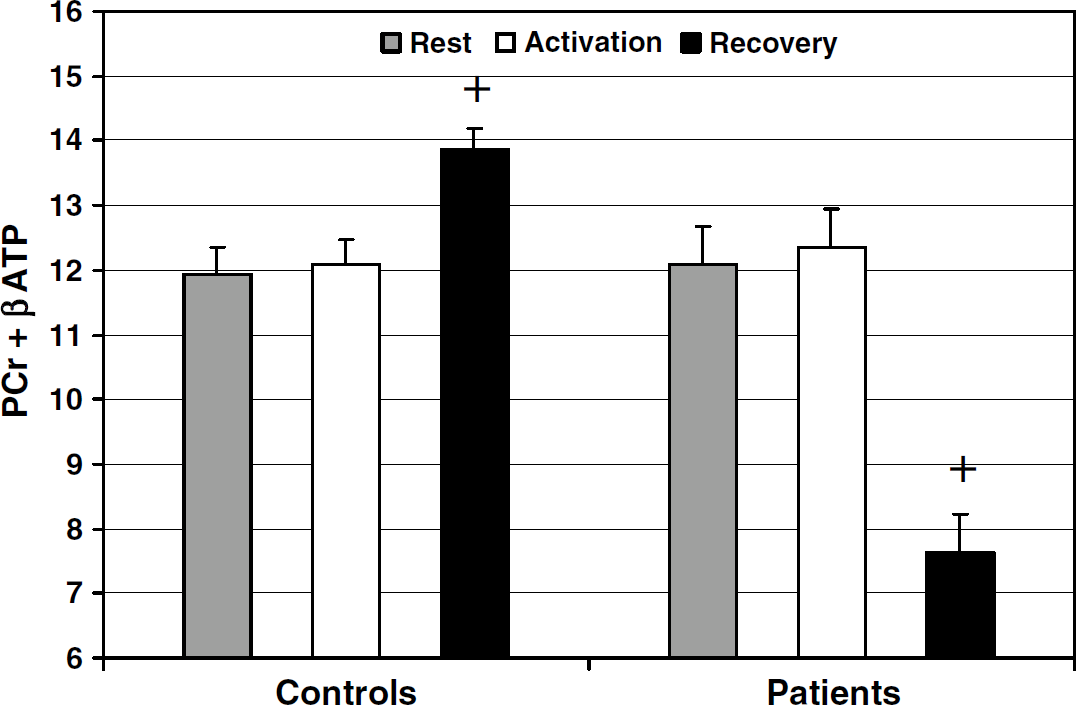
Bar graph shows phosphocreatine (PCr) + beta adenosine triphosphate (βATP) values in patients and controls (arbitrary units, mean + standard error of mean (s.e.m.)) in the three experimental conditions. +P < 0.001 versus PCr + βATP at rest in the same group (paired t-test).
In the patient group, mean PCr + βATP did not change significantly during activation (12.15 ± 2.02, s.d.; P = NS) but fell (by 36%) during recovery (7.64 ± 1.59, s.d.; P < 0.001) (Figure 2) with all values below the normal range of the controls. During recovery, mean PCr + βATP was significantly greater in the normal subject than in the patient group (P < 0.001). Typical spectral are shown in Figure 3 (normal subject) and Figure 4 (PD). Phosphocreatine/inorganic phosphate ratios at rest were also calculated for comparison with previous literature. Phosphocreatine/inorganic phosphate did not differ between patients and control subjects at rest (1.79 ± 0.13 s.d. versus 1.82 ± 0.14 s.d.; P = NS). At rest, mean PDE did not differ between normal subjects and patients (15.4 ± 1.1 s.d. versus 15.7 ± 1.2 s.d.; P = NS). Mean PDE was not different in the three conditions both in normal subjects (activation 16.1 ± 1.2, s.d.; recovery 16.2 ± 1.3, s.d.; ANOVA, P = NS) and in patients (activation 16.1 ± 1.2, s.d.; recovery 15.9 ± 1.3, s.d.; ANOVA, P = NS). The two patients who had a repeat scan on and off therapy showed overlapping PCr + βATP values (rest 12.67 versus 12.79, 12.03 versus 12.11; activation 12.72 versus 12.67, 12.36 versus 12.44; recovery 8.09 versus 8.14, 7.43 versus 7.58) and overlapping pH values (rest 7.05 versus 7.06, 7.01 versus 7.03; activation 7.02 versus 7.02, 7.03 versus 7.04; recovery 7.01 versus 7.02, 7.00 versus 7.01). Their Hoehn and Yahr score was 2 on therapy and 3 off therapy. In the visual cortex of PD patients, all NAA/Cr ratios were within the normal range (mean 1.98, s.d. 0.16). N-acetyl aspartate absolute values were also within the normal range in all cases (mean 12.2 mmol/L, s.d. 2.1).
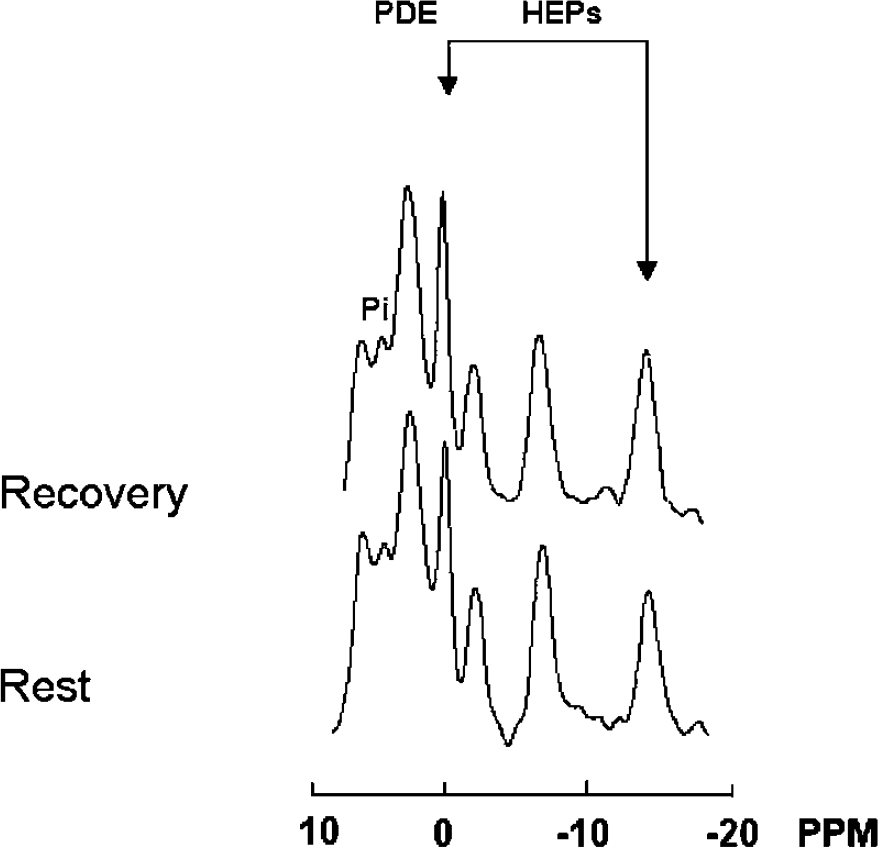
31 phosphorus (31P) spectra obtained from the visual cortex of a normal subject: comparison between rest and recovery. Arrows indicate high-energy phosphates (HEPs) (left arrow, phosphocreatine (PCr); right arrow, beta adenosine triphosphate (βATP)). Spectra acquisition/processing parameters: sweep width = 2,000 Hz, 2,048 digitalized points, convolution difference to remove broad signal (exponential line broadening = 150 Hz), exponential multiplication (20 Hz) to improve signal-to-noise ratio, and no baseline correction. Note that during recovery both PCr and ATP are increased.
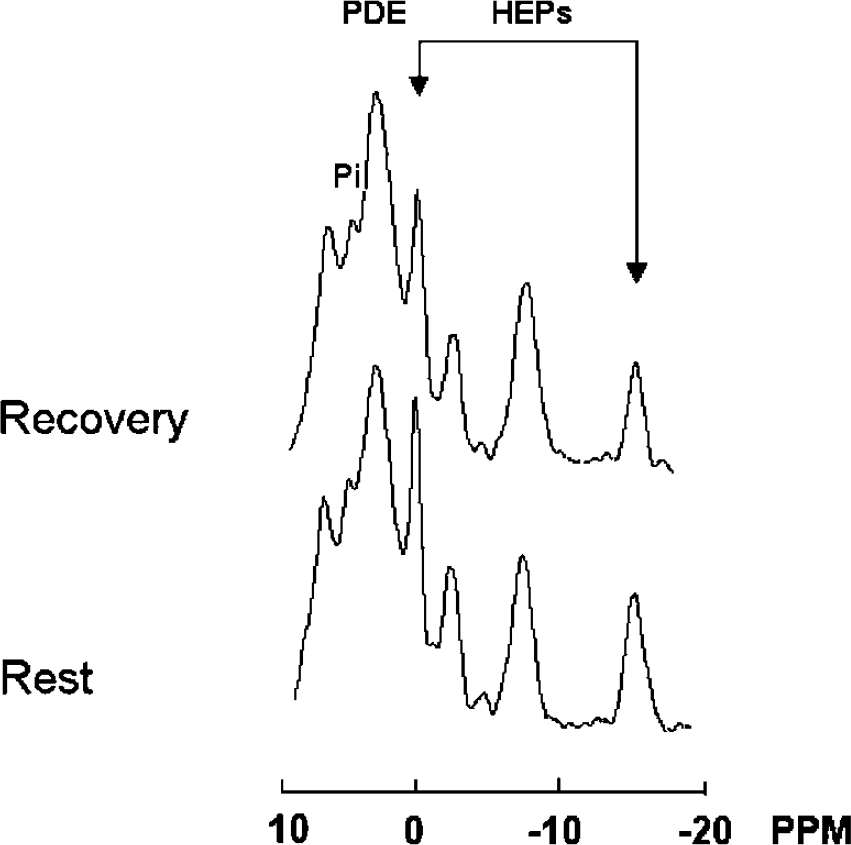
31 phosphorus (31P) spectra obtained from the visual cortex of a subject with Parkinson's disease: comparison between rest and recovery. See Figure 3 for spectral parameters. Note that during recovery both phosphocreatine (PCr) and adenosine triphosphate (ATP) are decreased. This subject's HEP changes were among those closest to the group mean and were not the most dramatic responses.
Discussion
Some PET studies have shown that glucose metabolism in the visual cortex at rest is decreased in PD patients (Bohnen et al, 1999; Saito et al, 2004; Eberling et al, 1994), which finding may be explained either by damage/loss of neurons, which is not found in our study given normal NAA content, (Birken and Oldendorf, 1989; Rango et al, 1995) or rather by diminished energetics requirement from reduced nigrostriatal outflow and visual areas functional deafferentation (Bohnen et al, 1999; Saito et al, 2004; Eberling et al, 1994). Under the latter condition, which is characterized by a mitochondrial metabolic state 4 (Chance et al, 1986), increased, rather than normal, PCr and PCr/ATP content would be expected in the visual cortex. In this light, our finding of normal PCr/ATP content would be, paradoxically, suggestive of impaired energetics. The present study of brain energetics under increased requirement, which is functional activation and recovery, has shown that this is, indeed, the case.
This is the first functional spectroscopy study in Parkinsonian patients, to our knowledge. We have applied a method previously developed to study mitochondrial brain energetics during activity by measuring overall changes in the content of HEP compounds ATP and PCr (Siesjo, 1978; Siegel et al, 1981; Erecinska and Silver, 1989; Rango et al, 2001). This method, unlike the ratios between intracellular compounds, such as PCr/ATP or PCr /Pi, is independent of the significant intracellular pH changes, which take place throughout the activation–recovery cycle. The use of PCr/Pi as an indicator of intracellular energy status has been used largely in rest and activation studies (Chance et al, 1986; Sappey-Marinier et al, 1992). It is easy to use and does not need a reference compound; however, it is a semiquantitative index and changes in PCr/Pi ratio are not linearly correlated to changes in HEP content. Moreover, Pi is difficult to measure because it overlaps with phosphomonoester peak and this may be a source of measurement error (Diehl et al, 1992). Therefore, although requiring a reference compound, the use of PCr + ATP appears more appropriate to study brain energetics because it measures directly the overall HEP content.
Although other kinds of stimuli may be used, visual activation of the brain appears optimal given high oxidative metabolism (Siesjo, 1978; Siegel et al, 1981; Fox et al, 1988) and high content of oxidative phosphorylation enzymes of the visual cortex (Martin, 1996). Stimuli can be easily graded (Marrett et al, 1992) and, until late in the disease, the visual cortex does not seem to be involved in PD (Diederich et al, 2002), avoiding artifactual and methodological problems implied in brain suffering brain cells. Moreover, unlike substantia nigra and basal ganglia mitochondria, it is not likely that the visual cortex mitochondria are influenced by confounding L-dopa free radicals-mediated effect/damage on mitochondria (Smith et al, 1994; Beal, 1995; Cassarino et al, 1997).
We have recently shown that in normal subjects, there is a postactivation increase of HEPs that lasts long after stimulation has ceased. This finding is in line with findings from other authors (Madsen et al, 1998) who have reported an increase of glucose oxidation during the postactivation phase, as compared with rest and activated conditions. Although part of increased glucose oxidation is likely to provide energy to restore rest conditions (i.e., intracellular and extracellular Na+/K+ gradients, neurotransmitter synthesis, etc.) (Siesjo, 1978; Siegel et al, 1981; Erecinska and Silver, 1989), increased glucose oxidation is in excess of actual energy requirement. Conversely, in patients with mitochondrial disease without clinical CNS involvement, there is a postactivation decrease of HEPs, suggesting that oxidative phosphorylation/mitochondrial impairment is present in brain even in the absence of clinical involvement.
Findings in this study overlap with findings in patients with mitochondrial diseases without clinical CNS involvement. At rest, the authors found no difference between HEP content in normal subjects and in PD patients. The HEP content remained unchanged during activation in PD patients, as in normal subjects, but it decreased in the postactivation period. This means that the brain of PD patients cannot cope with increased oxidative requirements such as those of the postactivation period that eventually lead to energy imbalance. Conversely, activation causes no energy failure because during this period additional energy demands are low and primarily sustained by an increase of anaerobic glycolysis that does not rely on mitochondria (Fox et al, 1988).
Altogether, the current findings suggest that the mitochondrial oxidative phosphorylation is impaired in the brain of PD patients, even in areas not directly involved such as the visual cortex. The heterogeneity of the physicochemical environment found in the current study, as expressed by the wide s.d. of the pHs, indicates that the degree of brain involvement may vary in severity among patients.
The exact role of oxidative phosphorylation/mitochondrial impairment in PD disease remains unclear. It has been recently hypothesized that aging and various degenerative disorders may share a common pathogenesis involving mitochondrial defects and energy failure (Muller-Hocker, 1992; Wallace, 1992). However, the effect of repeated energy failure in the human brain is currently unknown. The current findings suggest that whereas stimulation ‘prepares’ the normal brain for increased energy requirements, the brain of patients with PD may be most vulnerable to repeat activation. Although initial clinical CNS involvement in patients with PD points mainly to the basal ganglia, with time some of them may develop additional clinical features, which suggest involvement of other brain regions. Although the mitochondrial dysfunction that we detected in the visual cortex is somewhat silent since it has no major clinical expression, repeated energy failure from repeat neuronal activation may eventually lead to neuronal dysfunction. In fact, it has been recently reported that with progression of disease, there is a longitudinal deterioration of color discrimination and contrast sensitivity in PD (Diederich et al, 2002) as well in patients with mitochondrial myopathies (Ambrosi et al, 1995a, b).
Although the reason for mitochondrial impairment remains unclear, oxidative damage from dopamine metabolism does not appear to be the main cause of mitochondrial impairment in PD patients since the visual cortex is barely, if not at all, implied in such metabolism (Bradley et al, 2004). Rather, its adjunctive effect may enhance mitochondrial impairment and suffering of substantia nigra neurons.
Our technique is simple to develop and does not require sophisticated tools or sequences, thus making it implementable in most clinical magnetic resonance center. The combined use of 31P MRS and brain activation in longitudinal studies may help to elucidate the relation between environmental exposure, genetic susceptibility, mitochondrial defect, repeated energy failure, and development of brain damage, and thus may prove to have prognostic, other than diagnostic, value.
Footnotes
Acknowledgements
We thank Dr A Castelli for technical assistance.