
Abstract
Functional neuroimaging signals are generated, in part, by increases in cerebral blood flow (CBF) evoked by mediators, such as nitric oxide and arachidonic acid derivatives that are released in response to increased neurotransmission. However, it is unknown whether the vascular and metabolic responses within a given brain area differ when local neuronal activity is evoked by an activity in the distinct neuronal networks. In this study we assessed, for the first time, the differences in neuronal responses and changes in CBF and oxygen consumption that are evoked after the activation of two different inputs to a single cortical area. We show that, for a given level of glutamatergic synaptic activity, corticocortical and thalamocortical inputs evoked activity in pyramidal cells and different classes of interneurons, and produced different changes in oxygen consumption and CBF. Furthermore, increases in stimulation intensities either turned off or activated additional classes of inhibitory interneurons immunoreactive for different vasoactive molecules, which may contribute to increases in CBF. Our data imply that for a given cortical area, the amplitude of vascular signals will depend critically on the type of input, and that a positive blood oxygen level-dependent (BOLD) signal may be a consequence of the activation of both pyramidal cells and inhibitory interneurons.
Introduction
Functional neuroimaging, such as positron emission tomography and functional magnetic resonance imaging (fMRI) is based on the coupling between neuronal activity and the accompanying changes in cerebral blood flow (CBF) and metabolism (Sokoloff, 1999; Lauritzen, 2005). Increases in the intensity of functional brain imaging signals indicate increases in neuronal activity. A number of studies using the 2-deoxyglucose method have shown that the functional activation of energy metabolism that is localized to the terminal synaptic zones of the activated pathway, is proportional to the spike frequency of the afferent input to these terminal zones of the activated pathway, and is localized to the synapses but not in the postsynaptic cell bodies even though these cell bodies must have been activated as evidenced by alterations in energy metabolism in the further projection zones of these postsynaptic neurons (Schwartz et al, 1979; Kadekaro et al, 1985) (Sokoloff, 1999; Raichle and Mintun, 2006). Therefore, even if increases in spiking activity of targeted neurons do correlate with the amplitude of BOLD (blood oxygen level-dependent) signals in functional magnetic resonance imaging studies, this correlation is not an cause-effect relationship, and the mechanisms that generate the signals relate to the dendritic processing of incoming synaptic inputs rather than to the production of spikes (Logothetis et al, 2001) (Lauritzen, 2005). The objective of our study was to explore the cellular mechanisms of activity-dependent increases in CBF and cerebral metabolic rate of oxygen (CMRO2) in two networks targeting the same small locus of the cortex, in which the activated neuronal cell types were identified by immunocytohistochemistry.
We stimulated the infraorbital (IO) nerve or transcallosal (TC) afferents that activate both stellate and pyramidal cells, as well as interneurons through glutamate release and activation of alpha-amino-3 hydroxy-5 methyl-4 isoxazole proprionic acid (AMPA) and N-methyl D-aspatate (NMDA) receptors (Armstrong-James et al, 1993; Conti and Manzoni, 1994; Nielsen and Lauritzen, 2001; Hoffmeyer et al, 2007). Infraorbital stimulation excites thalamocortical neurons in layer IV of the barrel cortex followed by an activation of neurons in layers II and III and, to a lesser extent, in the intermingled septa (Woolsey and Rovainen, 1991; Shepherd et al, 2005). In contrast, TC stimulation excites primarily septa-located neurons on the contralateral side in layers III and V followed by an activation in layer II (Wise and Jones, 1976; Olavarria et al, 1984; Shepherd et al, 2005; Petreanu et al, 2007). Double immunocytochemistry identified the neuronal cell types that were stimulated, and their contents of vasoactive intestinal polypeptide (VIP), or enzymes capable of producing or releasing vasodilators (cyclooxygenase-2, COX-2; nitric oxide synthase, NOS) or generating their synthesis in neighboring perivascular astrocytes. We report that increases in CBF and CMRO2 were greater when evoked by incoming corticocortical afferents than by thalamocortical afferents for the same level of synaptic activity. Furthermore, interneurons with different contents of vasodilators were activated at low and high stimulation frequencies. We suggest that the response amplitudes of vascular and metabolic signals reflect distinct properties of activated neurons in addition to the magnitude of the evoked synaptic activity, and that activation of both pyramidal cells and inhibitory interneurons may produce a positive BOLD response. Our study specifies the dependence of CBF and energy usage on pathway and incoming synaptic inputs, and may help to define the ability of functional imaging to detect changes in neural activity.
Materials and methods
All experiments were in full compliance with the guidelines set forth in the European Council's Convention for the Protection of Vertebrate Animals Used for Experimental and other Scientific Purposes and were approved by the Danish National Ethics Committee. Forty-one male Wistar rats (350 ± 10g) were anesthetized with isoflurane (induction: 5% and surgery: 2%) while ventilated with O2 and air (Hoffmeyer et al, 2007). The trachea was cannulated for mechanical ventilation, and small catheters were placed into the left femoral artery and vein, which were continuously perfused with physiological saline. Continuous monitoring of arterial blood pressure and hourly blood samples of arterial pH, pO2, and pCO2 assured the maintenance of basic physiological parameters. Body temperature was maintained at 36°C to 37°C using a custom-made heating pad. The head was fixed in a stereotaxic frame. Depending on protocol, one (IO) or two (TC), craniotomies were performed over homologous regions of the somatosensory cortex. After surgery, the anesthesia was changed to ±-chloralose HBC complex, which was dissolved in saline (0.5 g/mL) (bolus: 1.6 mL/kg intravenously; continuous infusion: 1.1 mL/kg per h intravenously), which would correspond to a dose of initial bolus (1.6 mL/kg x 51.5 mg/mL) of 82.4 mg/kg and continuous infusion (1.1 mL/kg per h x 51.5 mg/mL) of 56.7 mg/kg per h, if using ±-chloralose. The level of anesthesia was checked by observing arterial blood pressure during stimulation and by tail pinch.
Stimulation Protocol
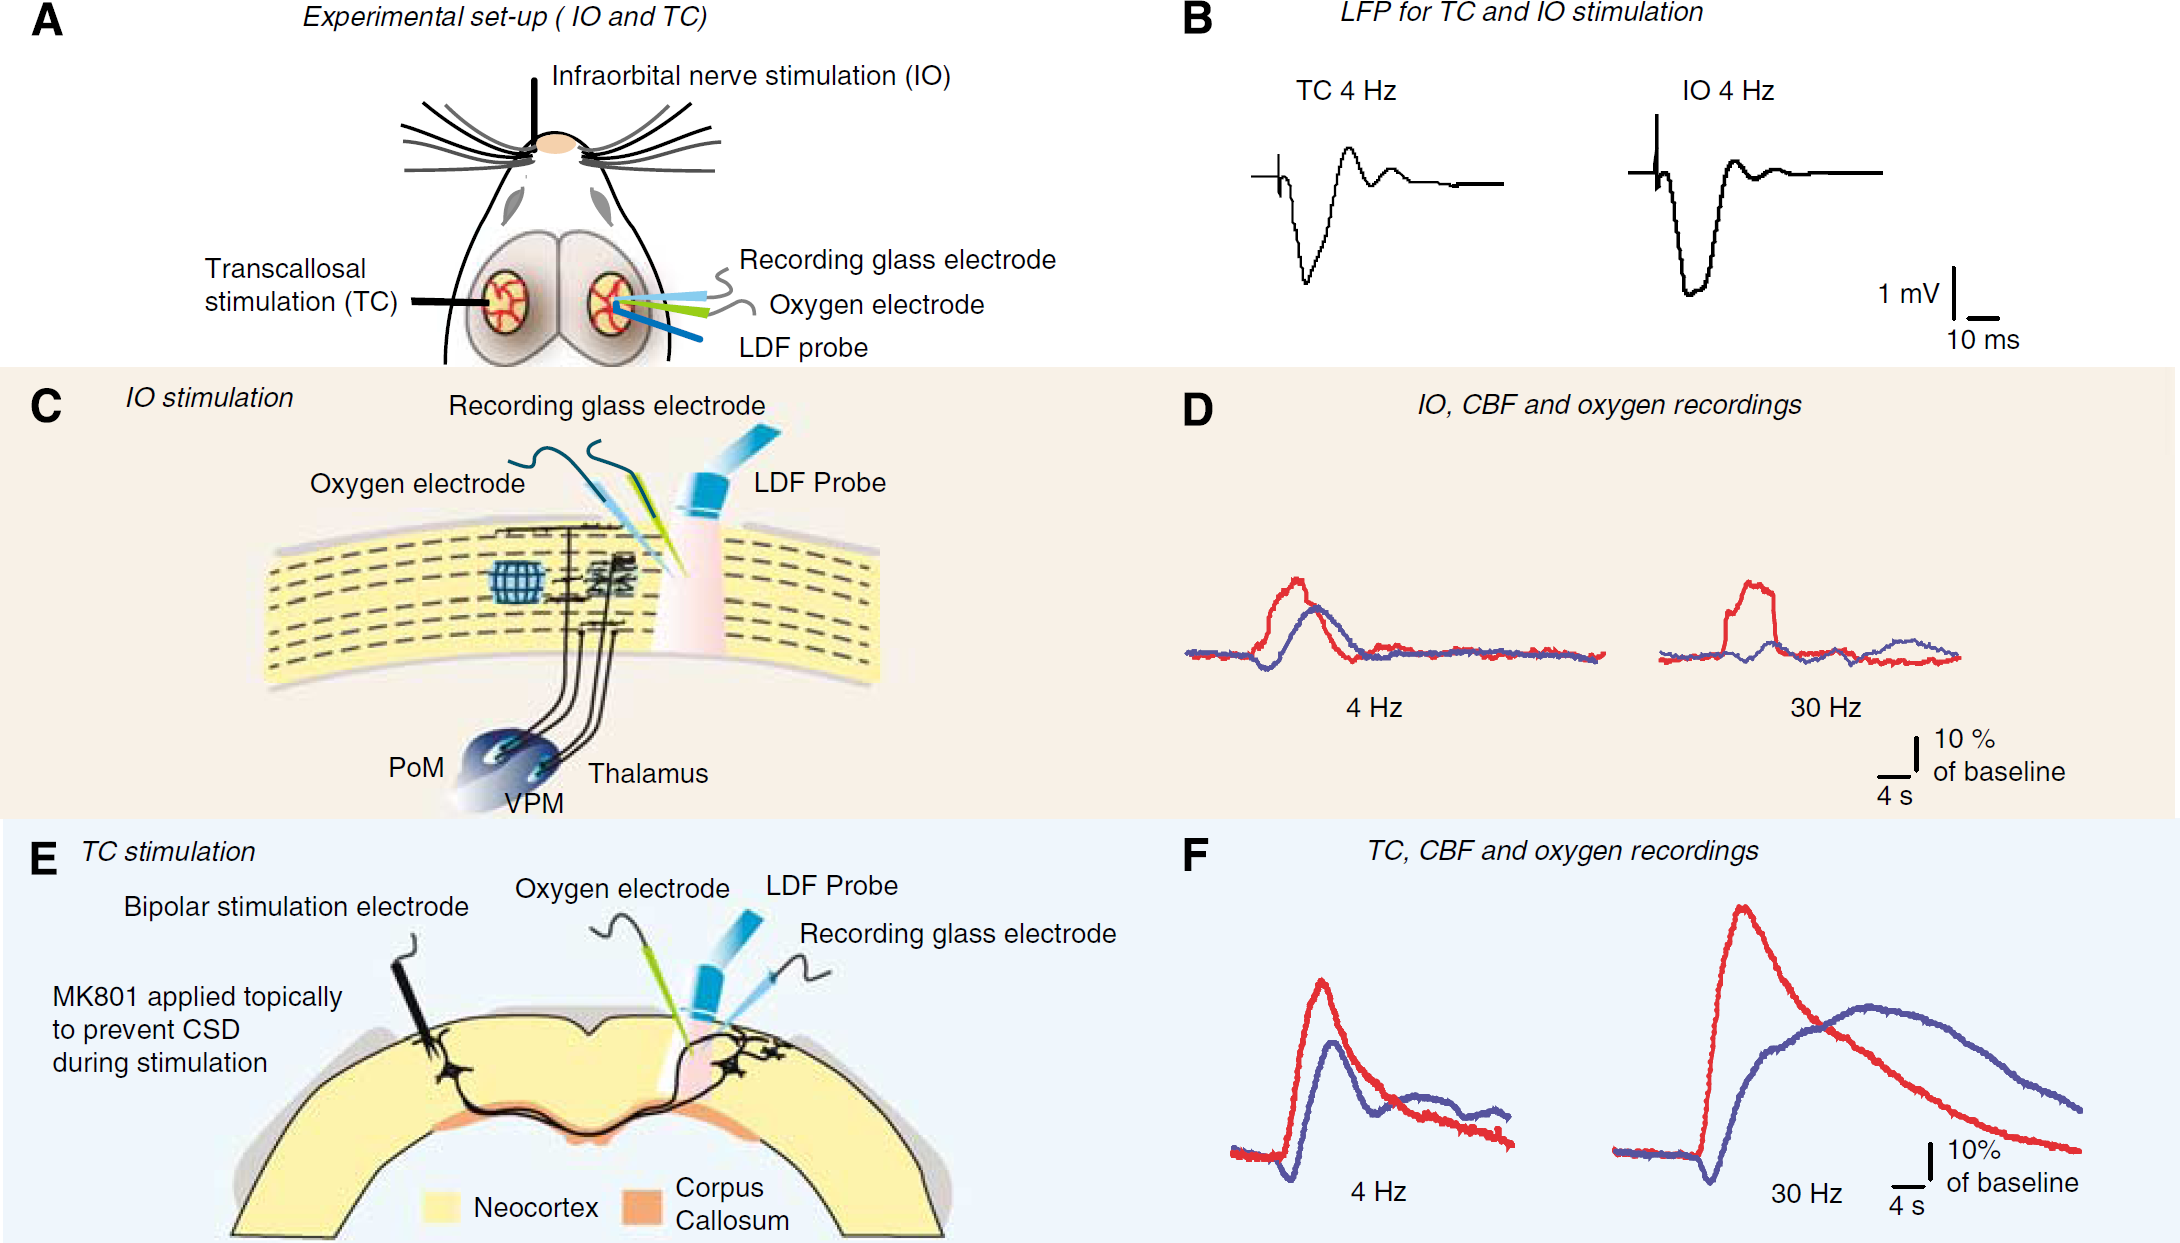
In 10 experiments, the ramus infraorbitalis (IO) of the left trigeminal nerve was stimulated by a set of custom-made electrodes inserted percutaneously. The cathode was positioned at the hiatus infraorbitalis and the anode was inserted into the masticatory muscles (Figures 1A and 1C) (Nielsen and Lauritzen, 2001). In other six experiments, a coated bipolar stainless-steel electrode (SNEX 200, contact separation: 0.25 mm; RMI, Woodland Hills, CA, USA) was lowered 0.5 mm into the left sensory cortex, 3.0 mm posterior to the bregma, and 6.0 mm lateral to the midline using stereotactic instruments for TC stimulation (Hoffmeyer et al, 2007). The site used for the stimulation of TC fibers was selected as the homologous cortical region contralateral to the locus, at which the responses were recorded for IO stimulation (Figures 1C and 1D), i.e., at coordinates −3, 6 on the contralateral side. To prevent the elicitation of cortical spreading depression (CSD) on the stimulated side, we applied the NMDA receptor antagonist, MK801 (1 mmol/L), to the stimulated cortex (Hoffmeyer et al, 2007). For both IO and TC stimulation, we used direct current stimulation (ISO-flex; A.M.P.I., Jerusalem, Israel) given as square wave pulses (0.1 ms, 1.5 mA) at 0.25, 0.5, 1, 2, 4, 6, 30, and 40 Hz in trains lasting for 4 secs. Each frequency was run three times with interstimulus intervals of 0.5 to 1.5 min, depending on the stimulation frequency for allowing both the electroencephalogram (EEG) and the basal CBF to return to stable baseline values between stimulations.
Experimental setup. (
Double Immunocytochemistry for Identification of Activated Cortical Neurons
Rats were stimulated either under acute or chronic conditions; the latter group being craniotomized 1 week before stimulation. Only one craniotomy was performed over the left cortex when TC stimulation was carried out, whereas the right skull was kept intact, and both the right and the left skull was intact during IO stimulation experiments. Acute rats received left IO (4 and 20 Hz,
Tissue PO2 (tpO2) Measurements
We used a modified Clark-type polarographic oxygen microelectrode (OX-10, Unisense A/S, Aarhus, Denmark) with a guard cathode for tpO2 measurements.
The field of sensitivity is a sphere of twice the tip diameter (5 to 10 μm in this study) (Thompson et al, 2003). The electrodes used in this study were constructed so that 90% of the response time was < 1 secs, and the stirring sensitivity was nearly negligible at <0.8% Oxygen microelectrodes respond linearly to changes in oxygen concentration. Each electrode was calibrated in air-saturated and oxygen-free saline (0.9% at 37°C) before and after each experiment with reproducible oxygen measurements. Mean tpO2 was 28.1 ± 2.3 mm Hg (mean ± s.e.m.;
Electrophysiology
We used single-barreled glass microelectrodes, filled with 2 mol/L saline (impedance: 2 to 3 MΩ, tip, 2 μm). Extracellular local field potentials (LFP) were recorded with a single electrode at a depth of 300 to 600 μm in the right sensory cortex. An Ag-AgCl ground electrode was placed in the neck muscle. The preamplified (x 10) signal was A/D converted, amplified, and filtered (LFP: 1 to 1,000-Hz bandwidth), and digitally sampled using the 1401 plus hardware (CED) connected to a personal computer running the CED Spike 2.5 software. Digital sampling rates were at 5 kHz for field potentials. The LFP response amplitudes are not ideal indicators of synaptic activity, but depend on the strength of the synaptic input and the transmembrane currents that are evoked, on the distribution of the current sources and sinks and on the synchrony of the currents. The LFP response amplitudes are influenced by the position and orientation of the activated cells. Stimulation of pyramidal cells in the cerebral cortex gives rise to large LFP responses, because the dendrites are vertically organized and the cells are oriented in parallel, whereas most small interneurons do not give rise to a LFP, because of the variety in the distribution of their dendritic arborizations. Therefore, there are uncertainties in the correlation analysis between ∑LFP, blood flow, and CMRO2 as presented in this study. Nevertheless, the LFP responses evoked by either TC or IO stimulation had a similar profile and were produced by the interaction of glutamate and GABA with neuronal AMPA, NMDA, and GABA receptors in adjacent cortical areas. The ∑LFP response magnitudes per stimulus rate were comparable for the two networks up to a stimulation frequency of 6 Hz, whereas at 30 and 40 Hz, it was no longer possible to identify a LFP for either network. The depression of cortical synaptic responses by IO stimulation at stimulation frequencies above 2 Hz are explained partly by subcortical adaptation at the level of the thalamus, but primarily by cortical adaptation (Chung et al, 2002; Martin et al, 2006). Adaptation was also observed for TC stimulation at comparable stimulation frequencies, but this network is not influenced by a depression at the level of the thalamus and by the decrease in LFP response amplitudes related to cortical mechanisms alone. Cortical adaptation to repeated stimuli may be explained by the prolonged duration of the inhibitory post synaptic potential (IPSP) responses, up to 100 ms by intracellular recordings, (Creutzfeldt, 1995). In addition, the membrane resistance might be short-circuited by increases in membrane conductance, but mechanisms underlying the suppression of LFP responses for rapidly repeated stimuli are incompletely understood (Creutzfeldt, 1995).
Laser-Doppler Flowmetry
Optic probes (PF 410; Perimed, Stockholm, Sweden; 780-nm wavelength, 250-μm fiber separation) were used for laser-Doppler measurements of CBF (Periflux 4001 Master, Perimed). The signal was A/D converted and recorded using the CED 1401 plus interface and the CED Spike 2.5 software (10 Hz digital sampling rate).
Calculation of CMRO2
CMRO2 was calculated from simultaneously obtained recordings of tpO2 and CBF (Gjedde et al, 2005). The relationship between tpO2, CBF, and CMRO2 is:
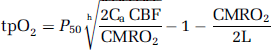
where
Data Analysis and Statistics
Values are expressed as mean ± s.e.m. Student's
Results
Neuronal activity was increased by stimulation of the contralateral IO nerve (Nielsen and Lauritzen, 2001), or TC fibers in the homologous contralateral cortex (Olavarria et al, 1984). This design provided information about neurovascular and neurometabolic coupling in the same cortical area evoked by excitatory projections that target two different groups of nerve cells within the same area of the somatosensory cortex (Figure 1 and results presented below).
c-Fos Identifies Pyramidal Cells and Interneurons Activated by IO and TC Stimulation
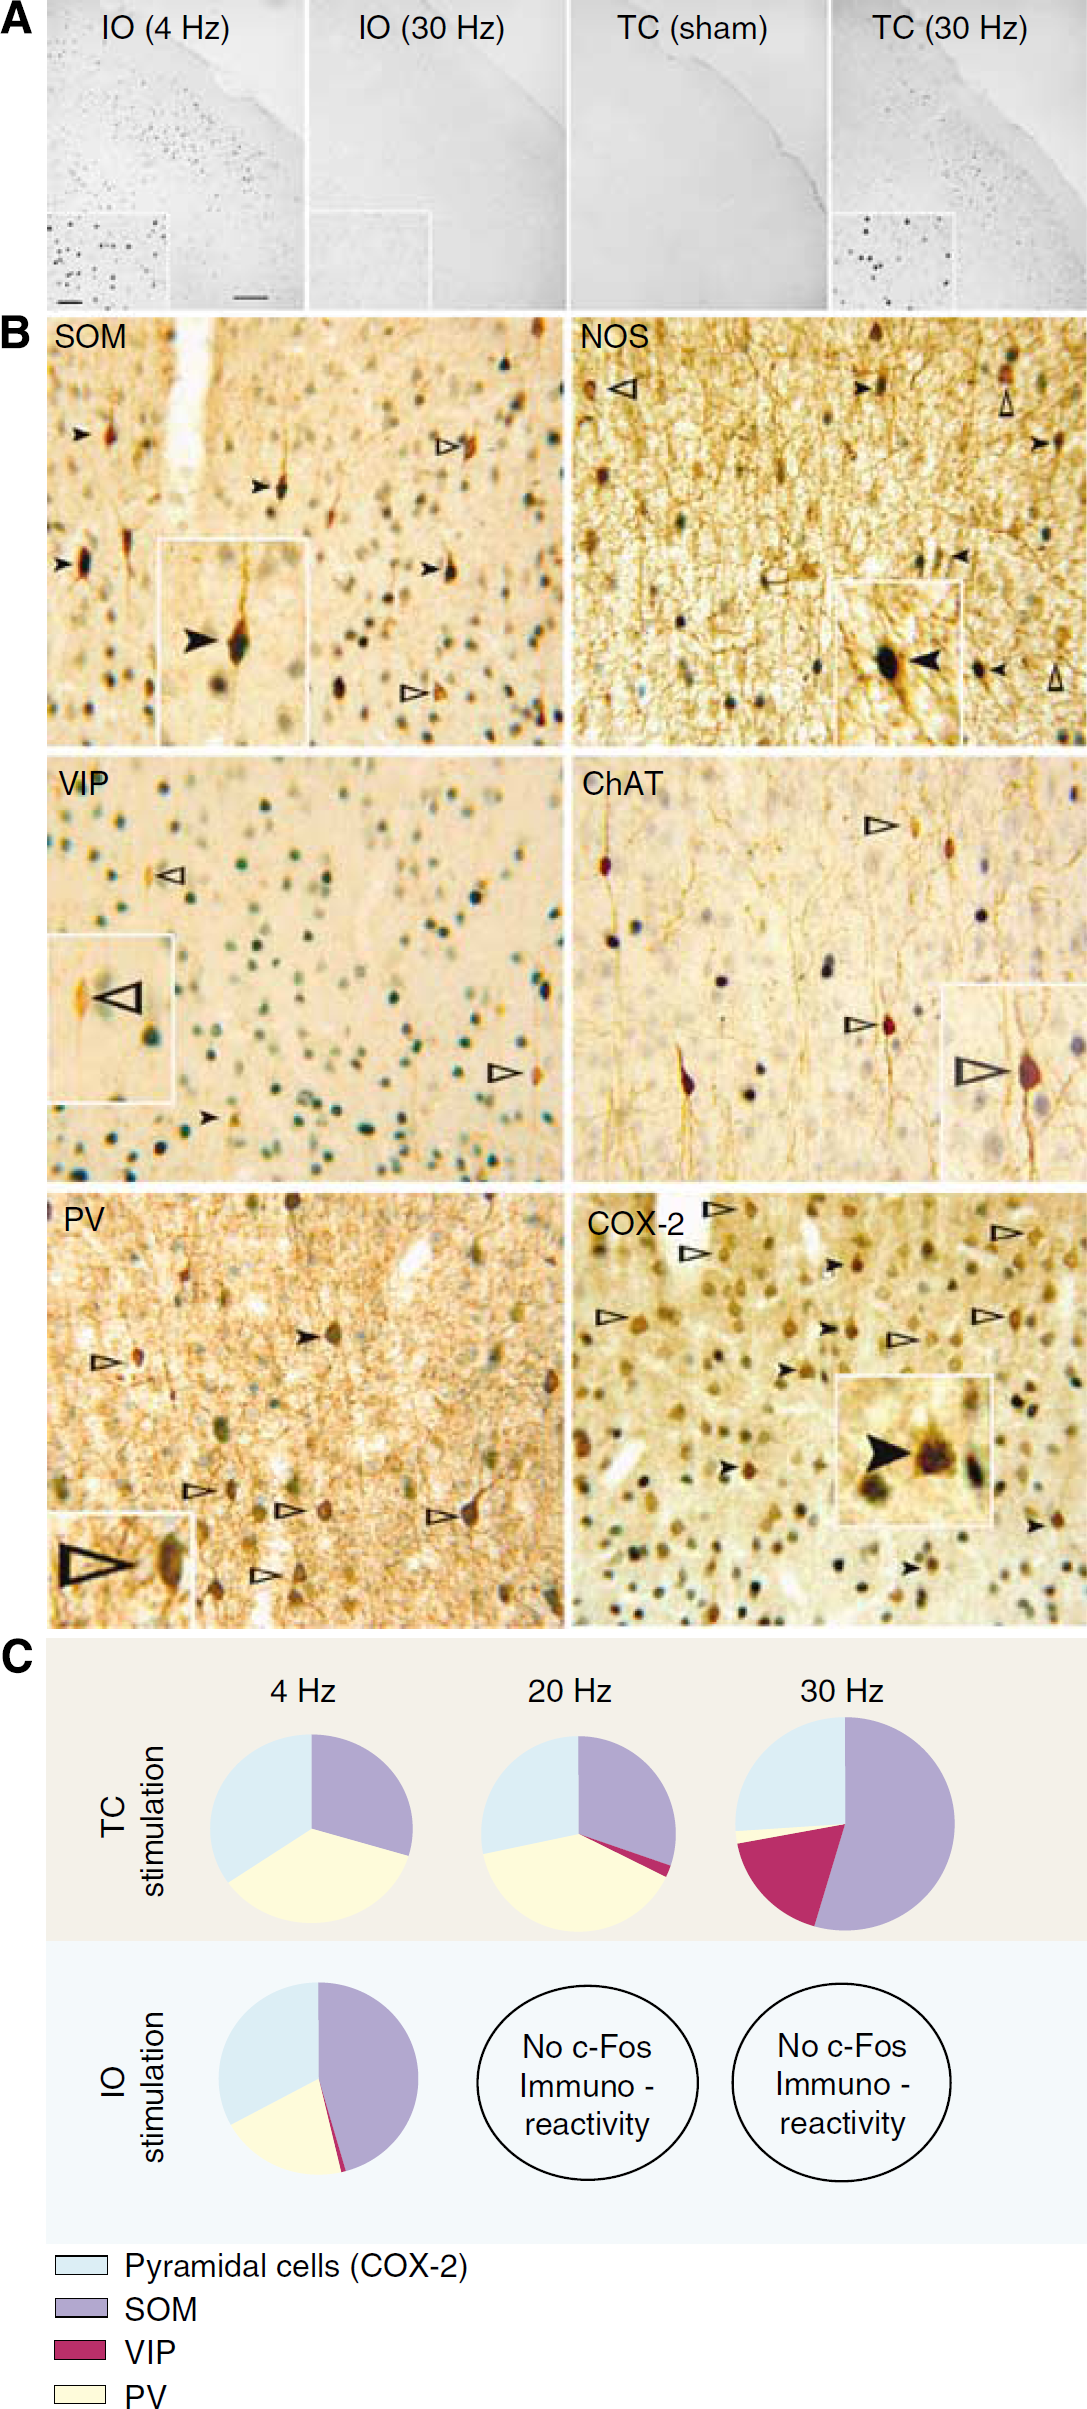
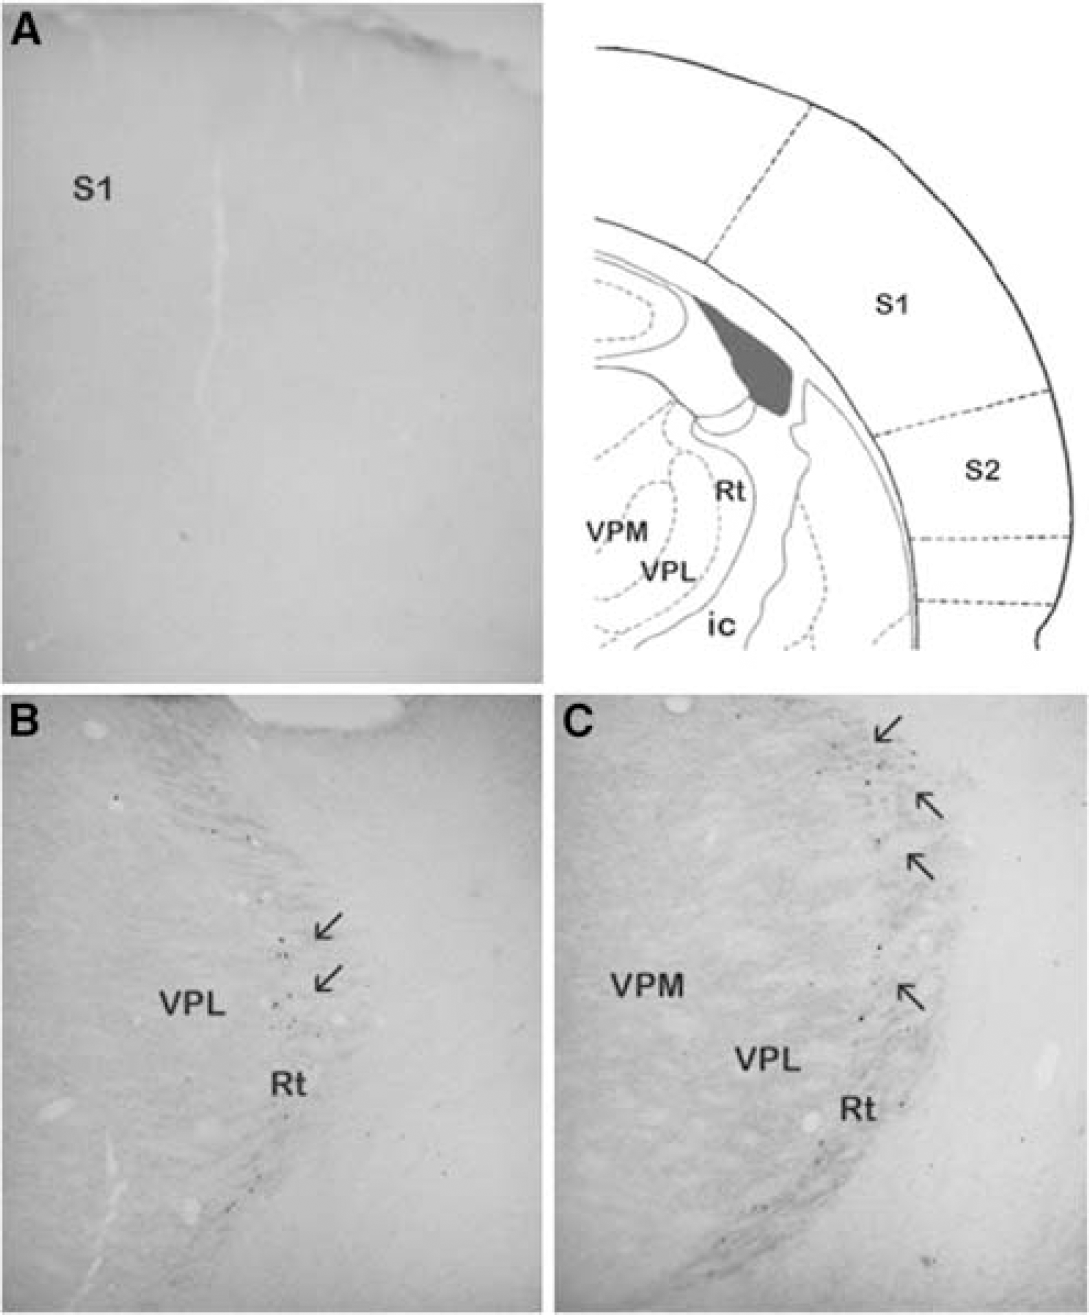
c-Fos is a generic marker of neuronal activation considered to reflect primarily changes in afferent inputs or in external stimuli (Kovacs, 2008). The somatosensory cortex is particularly amenable to c-Fos quantification as levels are very low under basal conditions and can be induced by stimuli, such as exploration of novel environment, direct sensory stimulation, or depolarization, that increase intracellular Ca2+ efflux in the postsynaptic cells (Staiger et al, 2002). Hence, we used c-Fos immunodetection to examine whether the same types of neurons were activated by IO and TC stimulations at 4, 20, and 30 Hz in the contralateral somatosensory cortex. We found that c-Fos-immunopositive nuclei were diffusely distributed in layers II to IV with no clear barrel delineation in layer IV after low-intensity (4 Hz) IO stimulation. Both 20 and 30 Hz stimulations-similar to sham stimulation-did not induce significant levels of c-Fos expression in the somatosensory cortex (Figure 2A) despite the presence of bilateral c-Fos-positive nuclei in the thalamus, particularly in the thalamic reticular nucleus (Figure 4). TC stimulation at 4, 20, and 30 Hz evoked c-Fos immunostaining, mainly located in layers II to III, of the contralateral cortex (Figures 2A and C) (see Table 1).
Specific populations of pyramidal cells and GABA interneurons are activated by low-frequency (4 Hz) 10 and high-frequency (30 Hz) TC stimulations. (
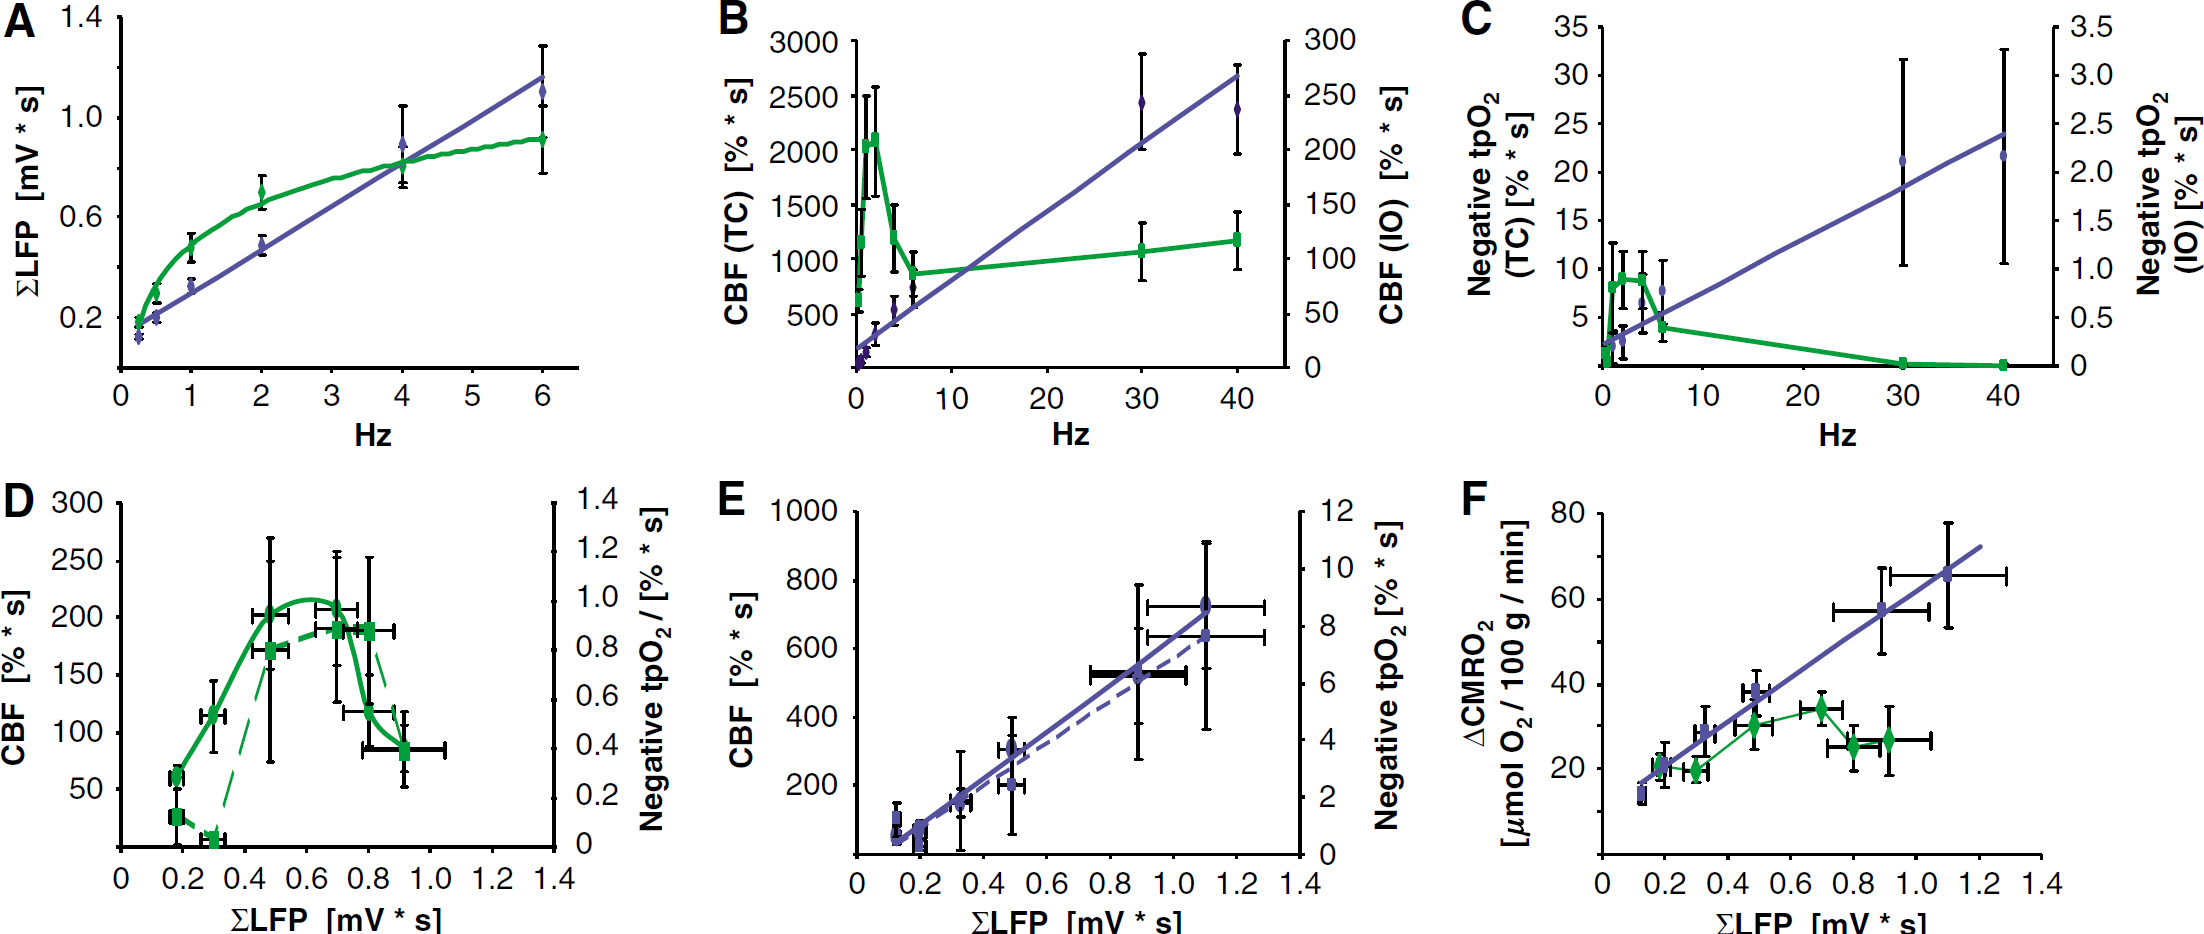
Neurovascular and neurometabolic coupling differ between corticocortical and thalamocortical stimulation. Stimulation-induced responses are plotted either against stimulation frequencies or synaptic activity as indicated by the summed local field potentials, ∑LFP (mV x sec). CBF responses are depicted as full lines, whereas negative tpO2 responses are depicted as stippled lines. IO nerve stimulation is indicated by green and TC by blue. (
Thalamic activation after high frequency (20 Hz) infraorbital (IO) nerve stimulation. (
Transcallosal (TC) and infraorbital (IO) stimulations activate different subpopulations of cortical neurons
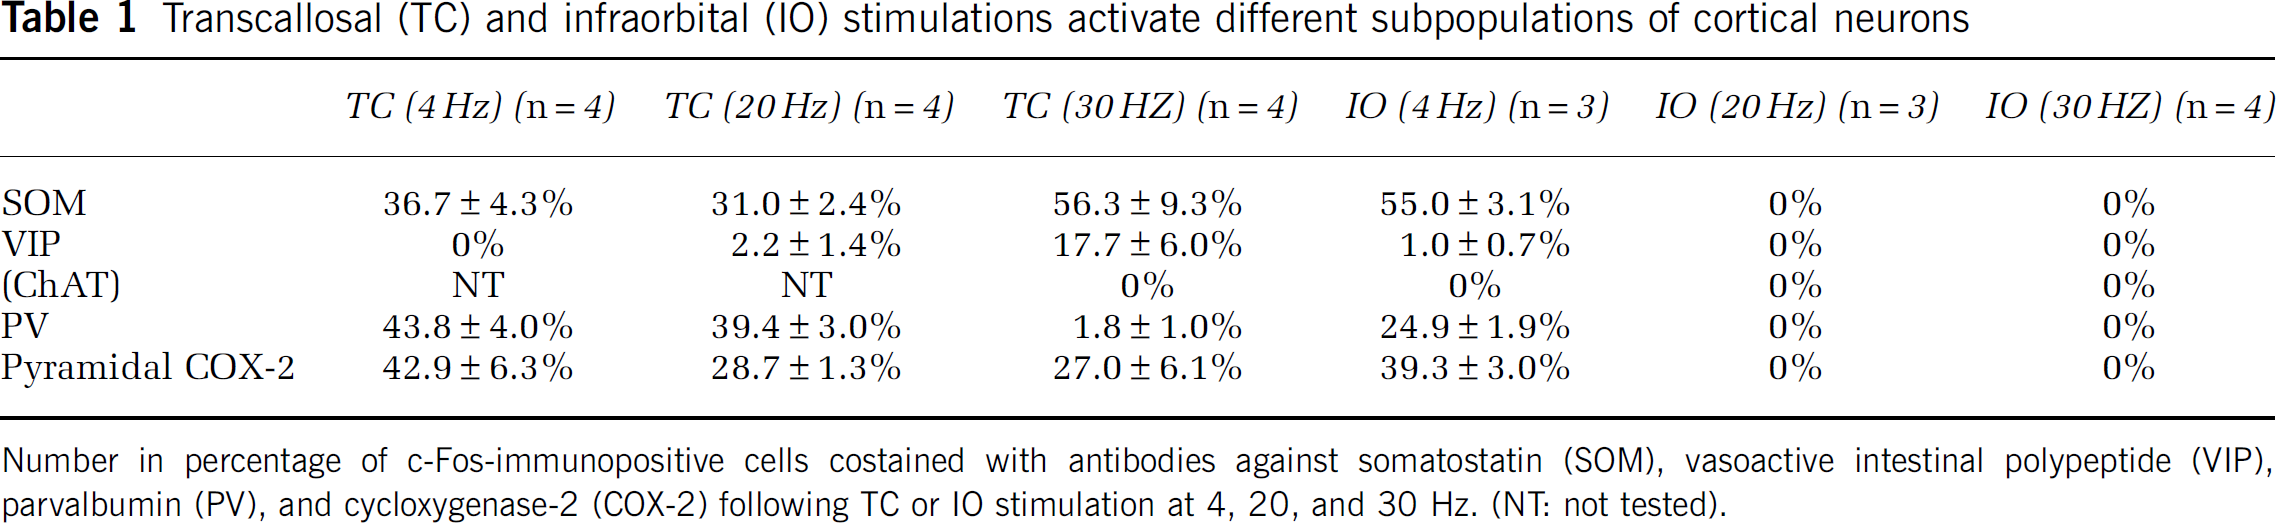
Number in percentage of c-Fos-immunopositive cells costained with antibodies against somatostatin (SOM), vasoactive intestinal polypeptide (VIP), paralbumin (PV), and cycloxygenase-2 (COX-2) following TC or IO stimulation at 4, 20, and 30 Hz. (NT not tested).
Double Immunostaining Reveals the Activation of Distinct Neuronal Subpopulations
Analysis of double-immunostained cells after 4 Hz IO stimulation indicated activation of COX-2 pyramidal cells (39.3% of 926 COX-2 immunopositive pyramidal cells being c-Fos-positive) and SOM-containing interneurons (55% of 340 cells) including those that also co-localize NOS (31.5% of 130 cells). A significant proportion of PV-containing interneurons were also activated (24.9% of 251 cells) at this stimulus intensity, but there was no activation of VIP or ChAT interneurons (1 and 0% of 111 and 110 cells, respectively) (see Table 1). For TC stimulation, increases in the stimulation intensity from 4 to 30 Hz increased the proportion of activated SOM-(from 37 to 56%) and VIP- (from 0 to 18%) containing GABA interneurons, with a decreased proportion of activated COX-2 pyramidal cells (from 43 to 27%) and, prominently, PV-containing interneurons (from 44 to 2%). The results are summarized in Figure 2C (see also Table 1). Sham-stimulated rats showed no c-Fos-immunopositive cells. The data indicated that low-frequency IO stimulation, and both low- and high-frequency TC stimulations activated different cortical pyramidal cells and interneurons. We then examined how this translated into differences in synaptic activity, CBF, and CMRO2 for the two networks.
Synaptic Activity and Increases in CBF
The evoked LFP responses consisted of two postsynaptic components, an initial negative potential indicating synaptic excitation (EPSP) and a positive potential indicating synaptic inhibition (IPSP) (Figure 1B). LFP responses were evoked consistently at stimulation frequencies of up to 6 Hz, but profiles and response amplitudes changed as a function of the stimulation frequency. The IPSPs were abolished at stimulation frequencies ≥4Hz, and we were unable to detect any excitatory post synaptic potential (EPSP) at 30 and 40 Hz (except for the first stimulus). For stimulation frequencies of up to 6 Hz, we observed a frequency-dependent increase in synaptic activity as shown in Figure 3A, and for frequencies of up to 40 Hz we observed a linear correlation between stimulation frequency and CBF for TC stimulation, and a complex relation for IO stimulation (Figure 3B). We are aware of the limitations in estimating the postsynaptic activity by LFP, as excitation of interneurons and the resulting inhibition gives rise to none or very small changes in LFP because of the functional anatomy of the interneurons. With these caveats in mind, we tested the hypothesis that the increases in CBF evoked by stimulation were triggered by excitatory synaptic activity. To this end, we correlated the ∑LFP for both networks to the respective CBF response amplitudes and observed a linear correlation for stimulation frequencies of up to 6 Hz for TC stimulation (
Response Characteristics of Tissue O2 and CMRO2
IO stimulation evoked tpO2 responses for stimulation frequencies at or below 6 Hz (Figures 1D and 3C: blue trace and green trace, respectively). The tpO2 responses ranged from small positive deflections at 0.25 to 0.5 Hz to biphasic responses at stimulation frequencies ≥ 1 Hz (Figure 1D: blue trace). Biphasic responses consisted of an initial decrease in tpO2 followed by a slower and longer-lasting positive response. The negative tpO2 responses were statistically different from 0 at stimulation frequencies from 1 to 6 Hz, whereas it was absent at 30 and 40 Hz (Figures 1D and 3C: blue and green, respectively) (
Resting CMRO2 was the same for rats exposed to IO stimulation (256.9 ± 11.5 μmol/100g per min) as for TC stimulation (258.6 ± 15.8 μmol/100g per min) (NS). The relationship between stimulation frequency and the increases in CMRO2 was described by a linear relationship for IO stimulation (see Figure 5A), which included data for all frequencies of up to 40Hz (γ=0.3141x+25.457,
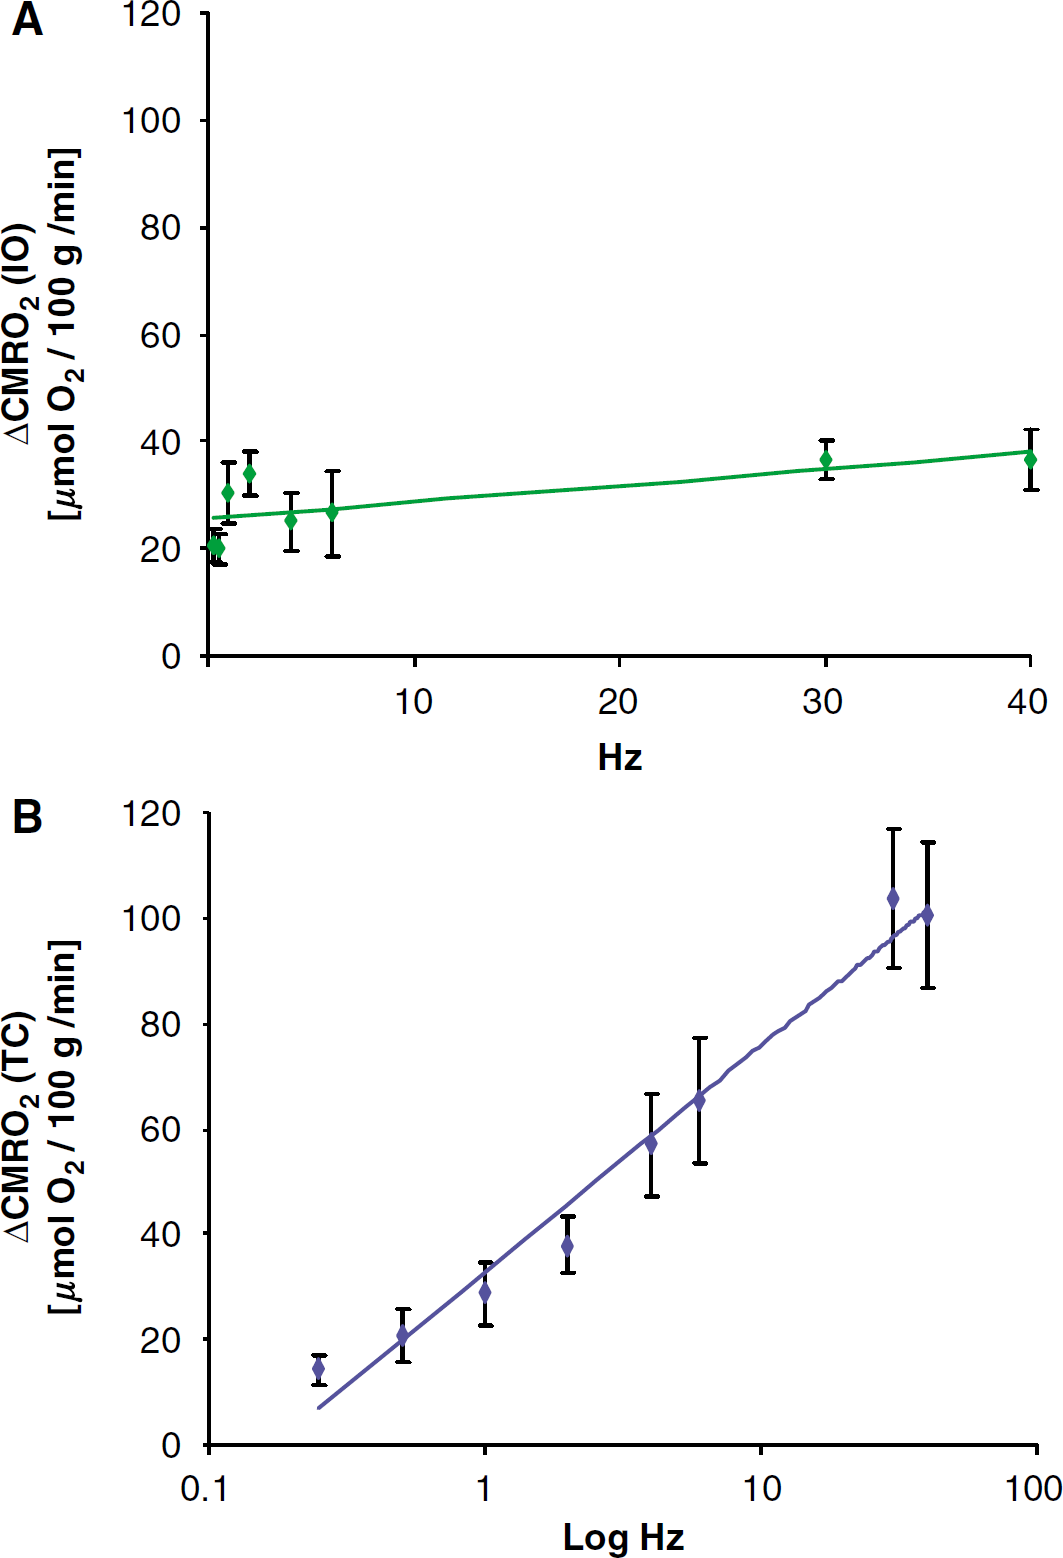
Frequency-dependency of CMRO2 dynamics. Cortical oxygen consumption (CMRO2) was calculated from the simultaneous measurements of CBF and tpO2 for the whole period of stimulation. All values are given as mean ± s.e.m. Findings were described by a linear increase of CMRO2 for IO stimulation (
Neurovascular and Neurometabolic Coupling Differ Importantly Between the Two Networks
Finally, we assessed the neurometabolic and neurovascular coupling in the two networks by the correlation of ∑LFP to CBF and the negative tpO2 area for the two types of stimulation. For IO stimulation, the relation was best described by a parabola; the negative tpO2 area and CBF increased, saturated, and decreased again corresponding to a stimulation frequency of 4 Hz (Figure 3D). In comparison, for TC stimulation (Figure 3E), the relations between ∑LFP versus the negative tpO2 area (stippled line) and CBF (solid line) were well described by linear correlations (
Discussion
The BOLD signal has been thought to be independent of the type of information processing. In this study, we imply that the amplitude of BOLD signals will depend critically on the type of input that activates a cortical area and hence, on the neurons involved in the local processing of the incoming afferent information. We show that the neurovascular and neurometabolic coupling responses to thalamocortical and corticocortical stimulation concurred with the activation of specific networks of principal cells, including COX-2 expressing pyramidal cells and GABAergic interneurons that differ with regard to the vasoactive compound they contain, and that the identity of the activated cells varied with the stimulus frequency. These findings highlight the contributions of both excitatory pyramidal cells and inhibitory interneurons in the hemodynamic and metabolic responses to increased neuronal activity and, furthermore, they show that the neuronal network activation is both stimulus- and frequency-dependent. We have conducted IO and TC stimulation experiments in the same animals as well. The problem with this approach is that the stimulation of one network influences the subsequent activity evoked in the other. This could be because of the activation of NMDA receptors and hence, neuronal Ca2+ changes at the high stimulation intensities. For these reasons, we only report from different series of animals in this paper.
IO and TC stimulation trigger activity in multi-synaptic pathways; the thalamocortical input to layer IV rapidly spreads to neurons in layers II and III (Armstrong-James et al, 1992), whereas activity of the TC projections spreads to neurons in all layers of the cortex, except layer IV (Shepherd et al, 2005; Petreanu et al, 2007). Therefore, the differences in neurovascular and neurometabolic coupling are likely not explained by the differences in the number of intracortical synapses being activated. Our study was performed in anesthetized rats, and it is possible that anesthesia alters the function of specific pathways and synapses to a different extent, as discussed in the following.
The observed differences in neurometabolic and vascular coupling between the two afferent pathways were supported by the c-Fos data. For low-intensity (4 Hz) IO stimulation, activation of COX-2 pyramidal cells and GABA interneurons that contain SOM (± NOS) and PV concurred with an earlier report of both excitatory and inhibitory neurons expressing c-Fos in the somatosensory cortex after exploration of a novel environment (Staiger et al, 2002). However, the lack of c-Fos-positive VIP interneurons after IO stimulation as compared with overnight exploration of a new environment is unclear, but it is most likely that differences in the status of the animals (anesthetized versus freely moving) and duration of the stimulus (20 mins versus overnight) are key determinants of the neuronal populations that respond to these comparable, albeit different, stimuli. IO stimulation at high intensity (20 and 30 Hz) resulted in no detectable activation of cortical neurons using c-Fos as a marker, a finding that correlated with the absence of tpO2 dip and LFP responses, and the IO stimulation plots of synaptic activity with CBF and CMRO2 displaying bell-shaped curves with very low responses at 30 Hz. They also agree with the reported decrement in the spiking rate of layers III and IV barrel neurons with increased stimulus frequency (Melzer et al, 2006). Our findings can well be explained by the frequency-dependent adaptation of cortical neurons, which occurs rapidly such that above 1 Hz, many cortical neurons cease firing after the first few deflections (Melzer et al, 2006). Although the strength of the adaptation observed here and in other studies can be attributed, in part, to the depth of the anesthesia (Chung et al, 2002), similar modulation of thalamocortical synapses has been reported in the awake state (Swadlow and Gusev, 2001). This contrasts with neurons in the ventroposterior medial nucleus (VPM) of the thalamus, the main sensory input to the barrel cortex, which adapted modestly and only at higher frequencies (>4 Hz) (Chung et al, 2002). Our finding of c-Fos-immunopositive cells in the reticular thalamic relay nucleus (Rt) in the same rats that showed no cortical activation at high frequency stimulation, confirmed that pathway activation did occur. Furthermore, they illustrated, in the live animals, the importance of Rt neurons in modulating and gating the activity of VPM neurons (Hartings et al, 2000), and the high frequency-dependent adaptation of cortical neurons (Swadlow and Gusev, 2001).
During TC stimulation, a frequency-dependent response for cortical neuron activation was observed between 4 and 30 Hz. Stimulation at 4 Hz activated both excitatory COX-2-expressing pyramidal cells (Yamagata et al, 1993) and specific subtypes of inhibitory GABA interneurons that contain PV and SOM; a subset of the latter are also known to contain NOS (Kubota et al, 1994). At 30 Hz, a larger fraction of SOM interneurons were activated together with a subset of VIP interneurons, but there was a silencing of those containing PV. These results suggest a recruitment of activated neurons as a function of stimulus intensity. However, they also point to specific neurons being unable to sustain activation at such high intensities, because of differences in their respective resting potential and input resistance (Kawaguchi and Kubota, 1993) or, alternatively, being inhibited by other networks of activated inhibitory interneurons (Hestrin and Galarreta, 2005). The latter possibility seems most likely, because PV neurons can sustain a high frequency stimulation and show little or no frequency adaptation (Kawaguchi and Kubota, 1993; Cauli et al, 1997). Interestingly, SOM interneurons, which exhibited the highest activation at 30 Hz, correspond to Martinotti interneurons whose activity has been shown to correlate with the inhibition of the fast-spiking PV-containing interneuron network (Beierlein et al, 2000). In addition, the silencing of PV interneurons at high frequency could be explained by the newly recruited VIP interneurons, which target PV neurons in the barrel cortex on which they are believed to exert an inhibitory effect (David et al, 2007). Together, these anatomic findings suggest that the
The results of our study emphasize the contribution of GABA interneurons in the neurovascular coupling response to distinct afferent pathways (Cauli et al, 2004; Kocharyan et al, 2008). Changes in CMRO2 evoked by corticocortical stimulation correlated linearly to ∑LFP, whereas for thalamocortical stimulation, CMRO2 increased frequency-dependently up to 2 Hz and declined at higher frequencies. This indicates that the increases in CBF and CMRO2 were far more pronounced for corticocortical than for thalamocortical stimulation for the same level of stimulus frequency, and suggests that the neurometabolic and neurovascular coupling responses differ among networks targeting the same small cortical region. This is not surprising, as CBF and metabolic responses within a given region of the brain reflect the combined activities in mixtures of cells and synapses that include both excitatory and inhibitory processes, which differ in their capacity to synthesize and release vasoactive molecules or induce their release from perivascular astrocytes. Moreover, the subsets of recruited neurons may change as a function of both the afferent pathway and the stimulation frequency. Therefore, inputs to the same region of the brain that contains a variety of neurons and synapses do not have equal effects on blood flow and metabolism, which would also be reflected in the fMRI BOLD signals recorded in activation studies. Although synaptic inhibition
Footnotes
Acknowledgements
The authors thank David Attwell for his valuable comments on this paper. This study was supported by the Lundbeck Foundation Centre for Neurovascular Signaling (LUCENS), the NOVO Nordisk Foundation and the Danish Medical Research Council, and by a Grant (MOP-84209 to EH) from the Canadian Institutes of Health Research (CIHR).