
Abstract
The mechanisms responsible for the local increase in brain glucose utilization during functional activation remain unknown. Recent in vitro studies have identified a new signaling pathway involving an activation of glial glutamate transporters and enhancement of neuron–astrocyte metabolic interactions that suggest a putative coupling mechanism. The aim of the present study was to determine whether one of the glutamate transporters exclusively expressed in astrocytes, GLAST, is involved in the neurometabolic coupling in vivo. For this purpose, rats were microinjected into the posteromedial barrel subfield (PMBSF) of the somatosensory cortex with GLAST antisense or random phosphorothioate oligonucleotides. The physiologic activation was performed by stimulating the whisker-to-barrel pathway in anesthetized rats while measuring local cerebral glucose utilization by quantitative autoradiography in the PMBSF. Twenty-four hours after injection of two different antisense GLAST oligonucleotide sequences, and despite the presence of normal whisker-related neuronal activity in the PMBSF, the metabolic response to whisker stimulation was decreased by more than 50%. Injection of the corresponding random sequences still allowed a significant increase in glucose utilization in the activated area. The present study highlights the contribution of astrocytes to neurometabolic coupling in vivo. It provides evidence that glial glutamate transporters are key molecular components of this coupling and that neuronal glutamatergic activity is an important determinant of energy utilization. Results indicate that astrocytes should also be considered as possible sources of altered brain metabolism that could explain the distinct imaging signals observed in some pathologic situations
Keywords
The brain has a high rate of aerobic metabolism and a respiratory quotient of nearly 1, indicating that oxidative metabolism of glucose is the major pathway for energy production (Siesjö, 1978). A continuous supply of glucose and oxygen is mandatory to sustain neuronal activity. This supply is locally and dynamically regulated to meet the increased energy demand during functional activation. Numerous applications of the deoxyglucose technique (Sokoloff et al., 1977) have clearly established the existence of a tight coupling between synaptic activity and energy metabolism confined within discrete anatomic units activated by specific modalities. This fundamental feature of brain function, termed neurometabolic coupling, has provided the basis of functional brain imaging techniques that are increasingly used to map human brain functions. However, the cellular and molecular mechanisms that underlie this coupling remain largely unknown.
The first issue to be addressed is the nature of the neuronal processes that require energy during functional activation. The prevailing hypothesis is that most of the energy is used to restore ionic gradients and resting membrane potentials that are modified during the excitation phase (Sokoloff, 1992). This restoration is mainly provided by Na+/K+-ATPase, which consumes adenosine triphosphate (ATP) to reestablish Na+ and K+ gradients. ATP produced by either glycolysis or oxidative phosphorylation (Silver and Erecinska, 1997) fuels this pump. Its activation can increase glucose metabolism. Therefore, Na+/K+-ATPase has been considered as a key enzyme involved in the functional coupling between neuronal activity and glucose metabolism (Mata et al., 1980).
A second issue concerns the identification of the cellular elements of the neuropil (where the activity-dependent increases in glucose utilization occur in vivo) that are involved in metabolic coupling. In addition to neurons themselves, the possibility that astrocytes may participate in this process was recently raised. Although the concept of metabolic coupling between glia and neurons was postulated more than a century ago (see Tsacopoulos and Magistretti, 1996, for references), only recent in vitro experiments have provided functional evidence that argue for an active role of astrocytes in the metabolic coupling (Pellerin and Magistretti, 1994). Pellerin and Magistretti proposed a new signaling pathway by which glutamate, the major neurotransmitter released at excitatory synapses of neuronal circuits, exerts a metabolic action on astrocytes (i.e., increased glucose uptake and lactate production). This metabolic effect of glutamate is mediated by glutamate transporters, not by glutamate receptors (Pellerin and Magistretti, 1994). Five subtypes of excitatory amino acid transporters have been cloned and shown to possess distinct structures, functions, and expression patterns (Kanai, 1997). Two subtypes, GLAST and GLT-1, are exclusively expressed in mature glial cells (Rothstein et al., 1994), whereas EAAC1 and EAAT4 are restricted to neurons (Rothstein et al., 1994; Yamada et al., 1996). EAAT5 was more recently characterized in human retina (Arriza et al., 1997). These transporters tightly regulate the level of extracellular glutamate within the synaptic cleft to ensure a high fidelity of glutamatergic transmission and to prevent neuronal damage from excessive activation of glutamate receptors (Nicholls and Attwell, 1990). For instance, knockout of the glutamate transporters GLAST and GLT-1 in mice induces neurodegeneration, lethal seizures, and exacerbation of brain injury (Tanaka et al., 1997; Watase et al., 1998). Glutamate uptake through the glial transporters is driven by the electrochemical gradient of Na+, with a stoichiometry of 1 glutamate per 2 to 3 Na+. As a consequence of glutamate uptake and sodium entry, the glial Na+/K+-ATPase was shown to be activated (Pellerin and Magistretti, 1997). Inhibition by ouabain of the glutamate-stimulated glucose utilization and lactate production by astrocytes also points to a critical role of Na+/K+-ATPase, and in particular its α2 subunit, in coupling synaptic activity to energy metabolism (Pellerin and Magistretti, 1994, 1997). Recent data obtained by magnetic resonance spectroscopy support the proposed model for a central role of astrocytes in coupling glutamate-mediated synaptic activity and glucose utilization (Shen et al., 1999; Sibson et al., 1998).
Based on this operational model, it was proposed that the activation-dependent 2-DG signal detected by autoradiography in animals and by positron emission tomography in humans might originate from astrocytes, whereas the trigger (i.e., activity-dependent synaptic release of glutamate) would be neuronal (Magistretti et al., 1999; Pellerin and Magistretti, 1994). If this hypothesis is correct, downregulation of astrocytic glutamate transport should result in a decrease of the activation-dependent 2-DG signal. To test this hypothesis directly, an experimental paradigm using antisense oligonucleotides (ODNs) was developed to induce a local and in vivo downregulation of one astrocyte-specific glutamate transporter, GLAST (the main transporter in primary astrocyte-enriched cultures). A physiologic functional activation was performed by stimulating the whisker-to-barrel pathway in rats while measuring local cerebral glucose utilization (CGU) by quantitative autoradiography in the posteromedial barrel subfield (PMBSF) of the somatosensory cortex, as previously described (Cholet et al., 1997).
MATERIALS AND METHODS
Animals
The experimental protocols were approved by the Bureau de la Protection Animale of the Ministère de l'Agriculture (authorization #3001 for P.L. and 7501 for G.B.). The experiments were performed on 40 adult male Sprague-Dawley (OFA) rats provided by IFFA CREDO (L'arbresle, France). The rats were housed in groups of four and were given free access to food and water in an ambient temperature of 22°C ± 2°C (40% to 60% humidity) and a 12/12-hour light-darkness cycle.
Oligonucleotides
Phosphorothioate oligonucleotides (ODNs) (Microsynth, Balgach, Switzerland) were used in this study. A 20-mers sequence (antisense 1) was designed to span the translation site of the GLAST mRNA (Storck et al., 1992). Controls included a random ODN (random 1) in which the content of nucleotide bases was identical to that of the antisense strand but in scrambled order. Absence of cross-hybridization with other known rodent gene sequences was confirmed using a computer-based gene sequence search database. We also used a 27-mers sequence (antisense 2) previously shown to decrease GLAST protein content significantly (Rothstein et al., 1996) and its associated random sequence (random 2). Sequences for the ODNs were as follows: antisense 1 GLAST 5′-CTCCGTTGCTTTTTGTCATA-3′; random 1 GLAST 5′-TACTTTCGATTGTTCGTCCT-3′; antisense 2 GLAST 5′-GTTGCTTTTTGTCATATTTTATCTTCT-3′; random 2 GLAST 5′-TGTCGTTTTGTTATCTATATTCTTTCT-3′.
Microinjection
Rats were anesthetized with chloral hydrate (300 mg/kg, intraperitoneal) and placed in a stereotaxic frame, and their skulls were exposed. Two holes were drilled bilaterally on both sides of the frontoparietal bone, with great care taken not to heat the underlying cortex (stereotaxic coordinates: anterior-posterior, −3 mm and lateral, ± 5 mm from bregma). ODNs were dissolved in artificial cerebrospinal fluid (CSF) and stereotaxically injected (3 μg in 1 μL at 50 nL/min) into the PMBSF of the somatosensory cortex using a glass micropipette (tip diameter 20 to 40 μm). The micropipette was lowered to −1 mm to reach layer 4 of the parietal cortex. After ODN microinjection, the micropipette was left in place at least 5 minutes to minimize backflow up the pipet track. Rats were then allowed to recover for 24 hours.
Spread of microinjected oligonucleotides
Oligonucleotides were labeled at the 3′ end using Terminal Transferase (Promega, Charbonnieres, France) with α(35S)dATP (1250 Ci/mmol, NEN Life Sciences, Paris, France). Radioactive ODNs were mixed with unlabeled ODNs to reach a final concentration of 0.5 nmol/μL (3 μg/μL). Twenty-four hours after microinjection, brains were removed, frozen, and cut into 20-μm coronal sections. Selected sections were collected and exposed to X-OMAT films (Kodak, Rochester, NY, U.S.A.) for 3 days. Sections were then processed for cresyl violet staining or cytochrome oxidase histochemistry (see below).
Cellular uptake of oligonucleotides
Fluorescein-labeled ODNs (Microsynth) were microinjected within the somatosensory cortex, and rats were perfused and fixed in situ (4% paraformaldehyde in 0.1 mol/L phosphate-buffered saline) 24 hours afterward. Coronal free-floating sections (40 μm) were processed for immunohistochemistry. Sections were incubated with a mouse monoclonal S-100β antibody (1/1,000, Sigma, Saint Quentin Fallavier, France) for 24 hours at 4°C and then with Cy3-conjugated goat antimouse IgG (1/200, Sigma) for 12 hours at 4°C. Sections were examined under a confocal laser scanning microscope (BioRad MRC 600, Hertfordshire, U.K.) attached to a Nikon Optophot microscope using epifluorescence. Images were acquired using double excitation at 468 nm fluoroscein isothiocyanate (FITC) and 568 nm (Cy3) and were recorded through separate channels. Serial plane images were collected at 1-μm intervals at a given depth or throughout the whole thickness of the preparation. Two-dimensional images were visualized by integrating serial tomographs by projection.
Electrophysiologic recordings
Three experimental rats were used for electrophysiology 24 hours after the antisense injection; two rats were injected with the random sequence and served as controls. The animals were anesthetized with urethane (1.5 g/kg, intraperitoneal) and received a subcutaneous injection of lidocaine before skin incision. After a craniotomy and incision of the dura mater, a large part of the PMBSF was screened for neuronal activity using carbon fiber electrodes. Whisker-evoked activity of single units was recorded within the C2 barrel using Spike2-software (CED, Cambridge, U.K.) simultaneously with the local field potential. For technical details of whisker stimulation and the recording methods used, see Armstrong-James and Fox (1987) and Welker et al. (1996).
Measurement of cerebral glucose utilization
Twenty-four hours after microinjection, rats were anesthetized with α-chloralose plus halothane induction as previously described (Bonvento et al., 1994). After insertion of cannulas in both femoral arteries and veins, the rats were placed in a stereotaxic frame and mechanical ventilation was started without curarizing agent. All whiskers except C2 were clipped. Arterial Pco2, Po2, and pH were measured periodically and kept within the physiologic range. Body temperature was maintained at 37.5°C. Cerebral glucose utilization was quantitatively measured as previously described (Cholet et al., 1997) using the (14C)2-deoxyglucose autoradiographic technique (Sokoloff et al., 1977) during mechanical stimulation (4 Hz) of the C2 whiskers on both sides (22 animals) or on one side (6 animals). At the end of the 45-minute period, the animal was killed by the rapid intravenous injection of sodium pentobarbital. The brain was immediately removed and frozen, and 20-μm-thick coronal sections were processed for autoradiography. Alternative sections were collected for histologic examination after cresyl violet staining.
We considered each hemibrain independently because of the strictly contralateral projections of trigeminal fibers. Therefore, glucose utilization was measured in five experimental groups of rats. Rats in group 1 (n = 6) did not receive any injection and were stimulated unilaterally (one side was used as a control unstimulated and the other side as a control C2 stimulated). Group 2 (n = 6) rats were microinjected with GLAST1 random ODN on one side and artificial CSF on the other side and were stimulated bilaterally. Group 3 (n = 6) rats were microinjected with GLAST1 antisense ODN on one side and artificial CSF on the other side and were stimulated bilaterally. Group 4 (n = 5) rats were microinjected with the GLAST2 random ODN on one side and no injection was performed on the other side; they were stimulated bilaterally. Group 5 (n = 5) rats were microinjected with the GLAST2 antisense ODN on one side and no injection was performed on the other side; they were stimulated bilaterally.
Image analysis
Analysis of CGU autoradiograms was performed as previously described (Cholet et al., 1997) using a computer-based image analysis system (Biocom 2000, Les Ulis, France). For each hemisphere, local CGU was determined within the C2 barrel (C2 area) and also outside the activated column but still within the PBMSF (background area). This area was shown to serve as a reliable control, provided it is located at least 250 μm from the activated area (Kossut et al., 1988).
Cytochrome oxidase histochemistry
Cytochrome oxidase histochemistry was carried out on 20-μm coronal brain sections using the technique of Wong-Riley (1979). Unfixed sections were incubated in the dark at 37°C for 2 to 4 hours in 0.1 mol/L phosphate buffer (pH 7.4) containing 0.05% 3.3′-diaminobenzidine tetrahydrochloride (Sigma) and 0.25 mg/mL cytochrome C (type III, Sigma).
Data and statistical analyses
Data are presented as means ± standard deviation. The CGU values determined in C2 and PMBSF background areas of both hemibrains were compared using a one-way analysis of variance followed by a Tukey test. The effect of C2 stimulation in each hemibrain was calculated as the percentage of change between the CGU values measured in the C2 and the background areas. These percentages were compared using the Kruskal-Wallis single factor analysis of variance followed by the Tukey test performed on ranks (Zar, 1984). The physiologic parameters were compared by a one-way analysis of variance followed by a Tukey test.
RESULTS
Autoradiography of (35S)-labeled oligonucleotides locally injected within the somatosensory cortex was carried out to evaluate the spreading of microinjected antisense ODNs. Figure 1 shows representative autoradiograms taken at various anteroposterior planes 24 hours after injection. Results indicate that the volume of ODN diffusion encompasses the majority of the PMBSF of the somatosensory cortex area, as indicated by the boundaries determined in adjacent sections stained with cytochrome oxidase.
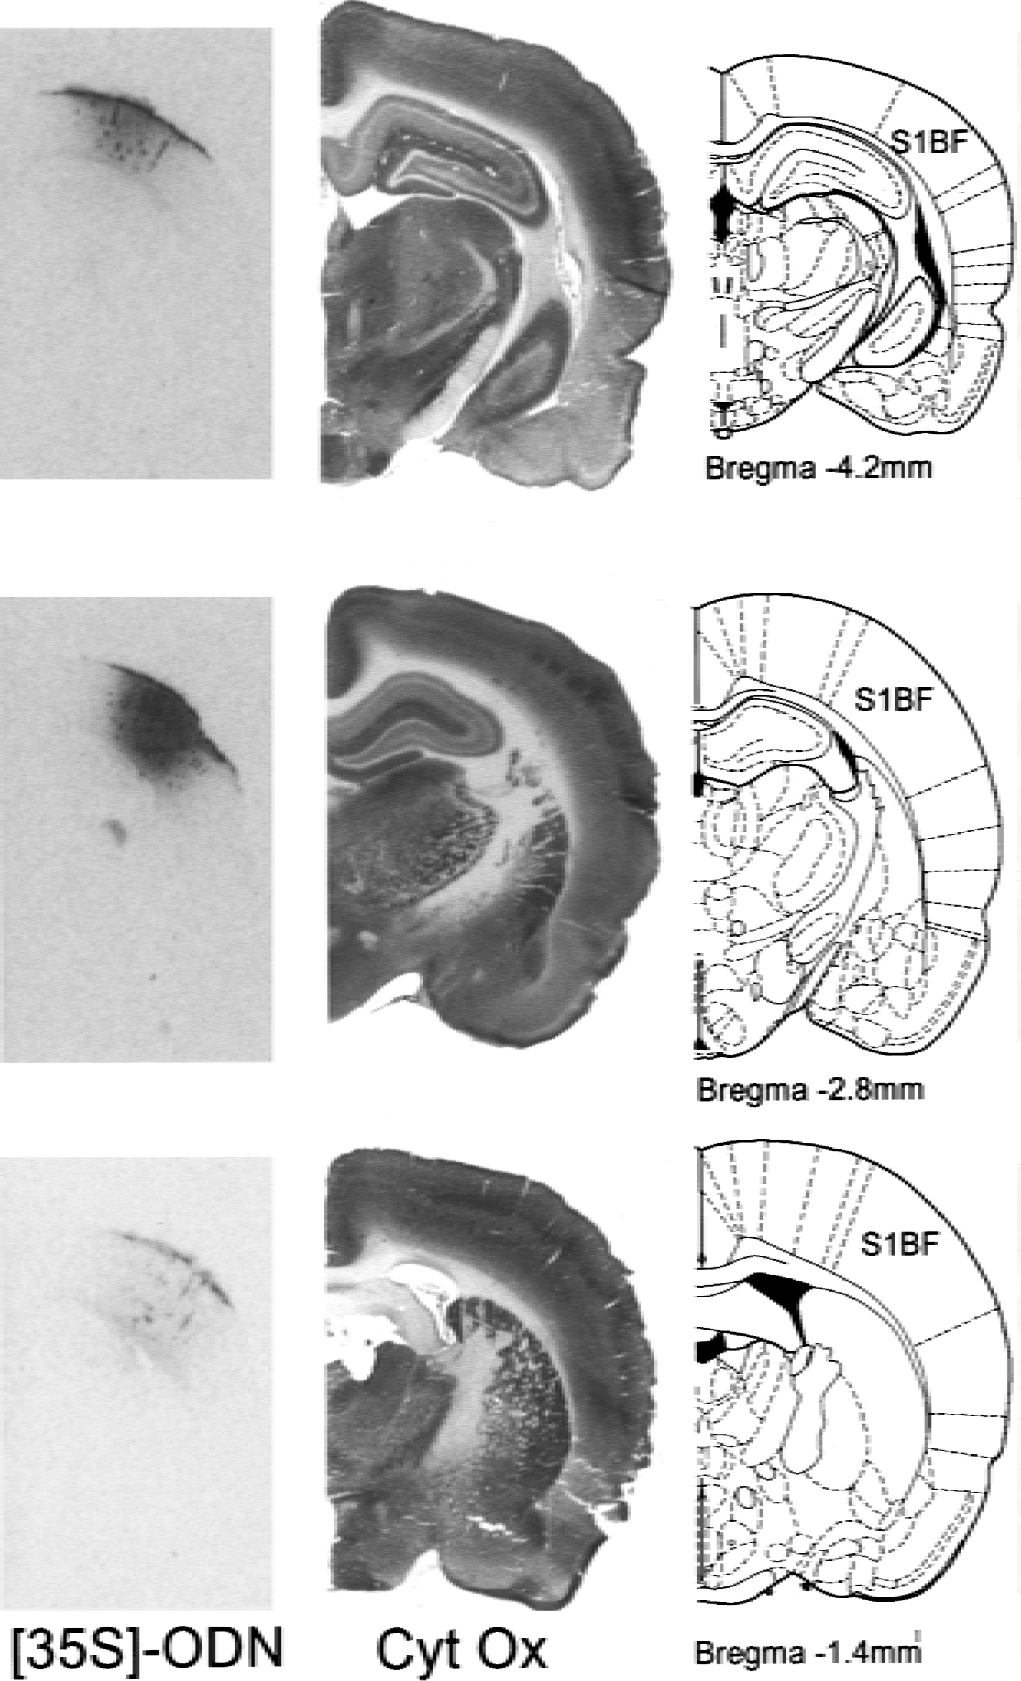
Autoradiograms showing the distribution of 35S oligonucleotides (ODNs) 24 hours after local microinjection (3 μg/1 μL) in the posteromedial barrel subfield of the rat somatosensory cortex (S1BF, left column). Adjacent coronal sections stained for cytochrome oxidase (middle column) and corresponding plates (right column) from the atlas of Paxinos and Watson (1998).
In the next series of experiments, we determined the cellular targeting of microinjected ODNs. To this end, fluorescein-labeled ODNs were used and were followed by fluorescence confocal microscopy. Numerous fluorescein-positive cells were observed 24 hours after ODN injection. They were distributed throughout all layers of the somatosensory cortex (Fig. 2). Observations at higher magnification revealed that most of the stained cells were neurons. Strongly fluorescent neuronal nuclei could be observed, together with a clear staining of the proximal axons. However, analysis of brain sections immunostained for S-100β, a specific marker of astrocytes, also indicated an uptake of fluorescein-labeled ODNs within these glial cells.
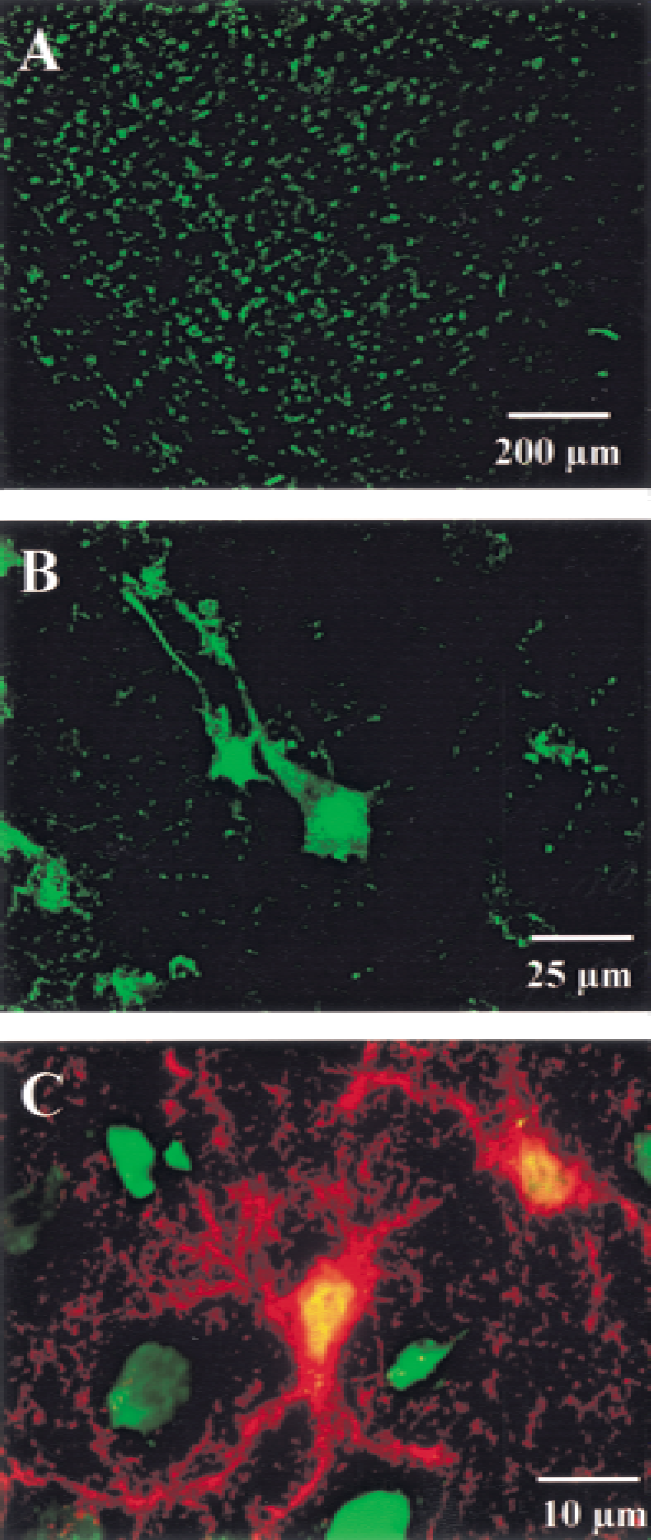
Uptake of fluorescein-labeled phosphorothioate oligonucleotides (ODNs) after local microinjection (3 μg/1 μL) in the posteromedial barrel subfield of the rat somatosensory cortex.
During the electrophysiologic exploration of the PMBSF, whisker-evoked activity was encountered at all penetrations, including sites as close as 150 μm from the antisense injection site (i.e., where the decrease in the metabolic response was observed [see below]). Figure 3 illustrates such an activity to stimulation of the C2 whisker while recording the activity of a neuron in the corresponding barrel.
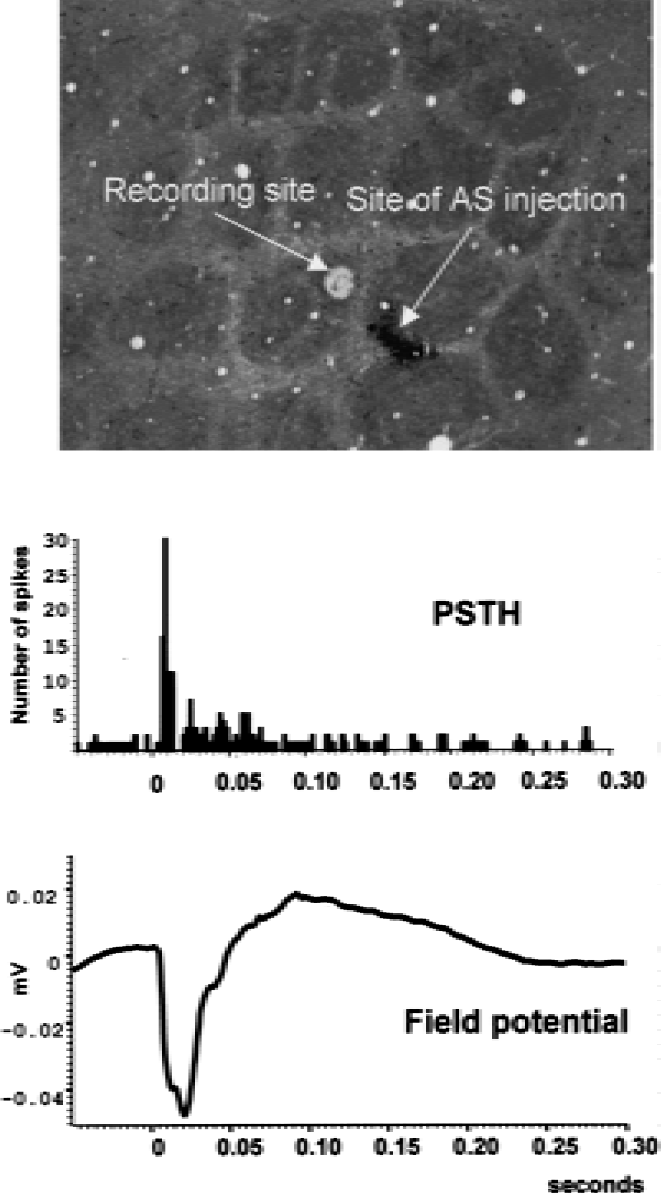
Neuronal activity evoked by whisker stimulation in the C2 barrel of an experimental rat 24 hours after the antisense (AS) injection. The poststimulus time histogram (PSTH) displays the response of a single unit inside the C2 barrel. The y-axis displays the number of spikes generated. The field potential is the average local field potential recorded during the whisker stimulation. For both displays, time on the x-axis is in seconds and 0 is the time of the onset of the stimulation of whisker C2 (duration 3 milliseconds). Data were obtained after 50 whisker stimulations at 0.5 Hz. The electrolytic lesion made at the end of the recording session reveals the recording site in the cytochrome oxidase-stained section.
For CGU experiments, functional activation was performed by stimulating the trigeminal pathway in α-chloralose-anesthetized rats. All animals had physiologic parameters (pH, Pao2, Paco2, arterial pressure, heart rate, temperature, glycemia, hematocrit) within the normal ranges (data not shown). Unilateral C2 whisker stimulation significantly increased CGU by 70% ± 23% in control rats (Table 1, Figs. 4 and 5). No contralateral metabolic effect was noted because the percentage change in CGU in the inactivated hemisphere was not significant (5% ± 8%). The local mechanical injection had no metabolic consequence per se, as indicated by the fact that the CGU response to C2 stimulation after CSF injection (59% ± 15%, group 2; 79% ± 14%, group 3) was not significantly different from the control response. Administration of the two GLAST random ODN sequences did not alter the CGU response compared with their respective contralateral metabolic responses. Twenty-four hours after injection of the two GLAST antisense sequences, the CGU response to C2 stimulation was significantly decreased compared with their respective contralateral metabolic responses (−67%, group 3; −55%, group 5, P < 0.05, Kruskal-Wallis followed by Tukey test). No significant effect was noted on the background CGU values determined in the PMBSF 24 hours after the different microinjections. Because these PMBSF background CGU values could be considered resting control values (Kossut et al., 1988), this result indicates that both antisense sequences did not significantly alter baseline CGU values, thus allowing the CGU responses to be determined accurately and compared.
Cerebral glucose use (μmol/100 g/min) values determined within the C2 barrel of the PMBSF of the somatosensory cortex (C2) and outside the activated column, but still within the PBMSF (PBMSF Bckg) in the 5 groups of rats
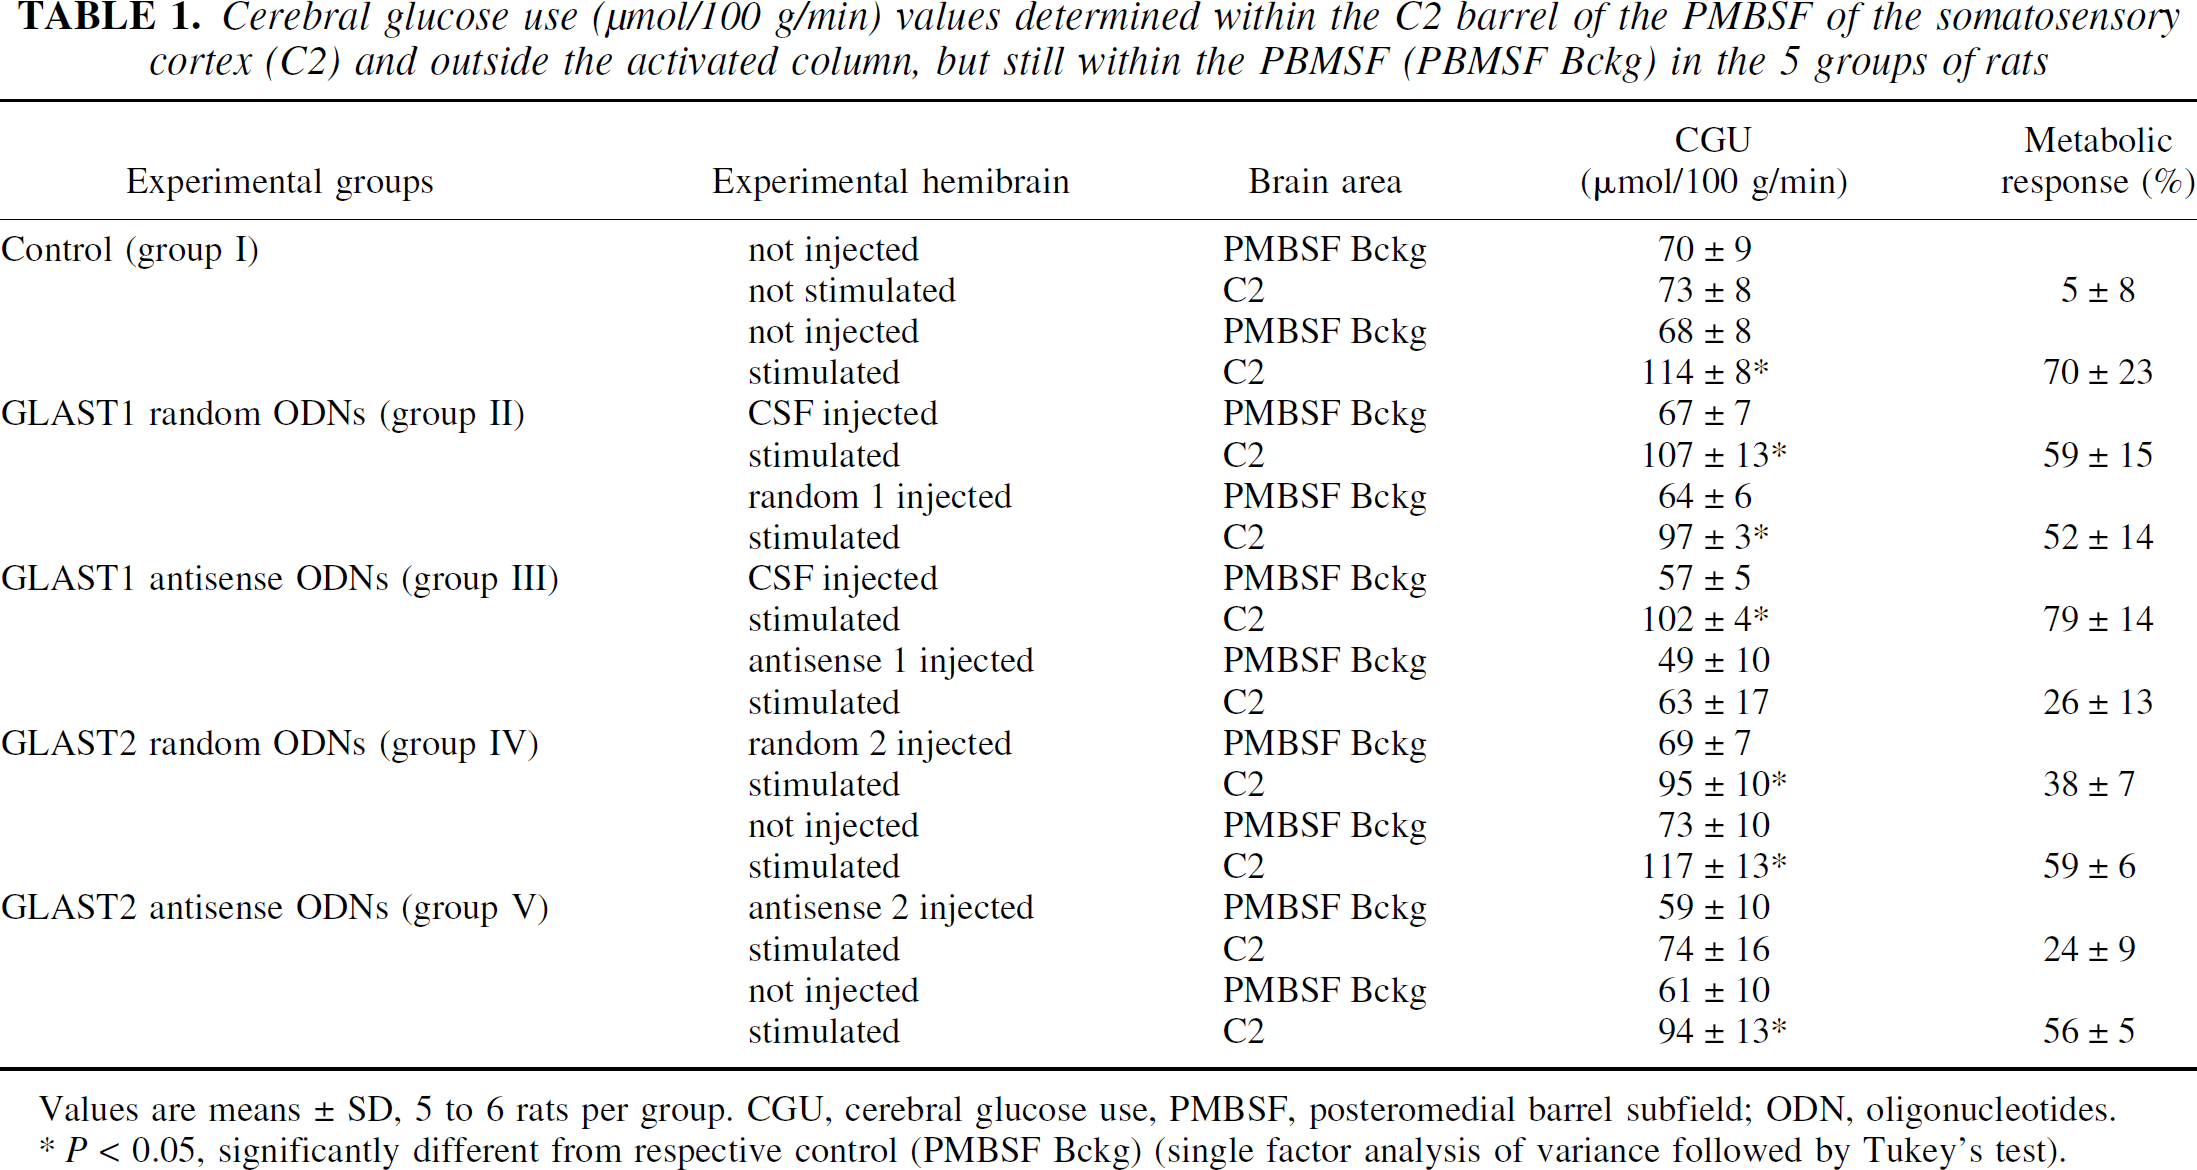
Values are means ± SD, 5 to 6 rats per group. CGU, cerebral glucose use, PMBSF, posteromedial barrel subfield; ODN, oligonucleotides.
P < 0.05, significantly different from respective control (PMBSF Bckg) (single factor analysis of variance followed by Tukey's test).
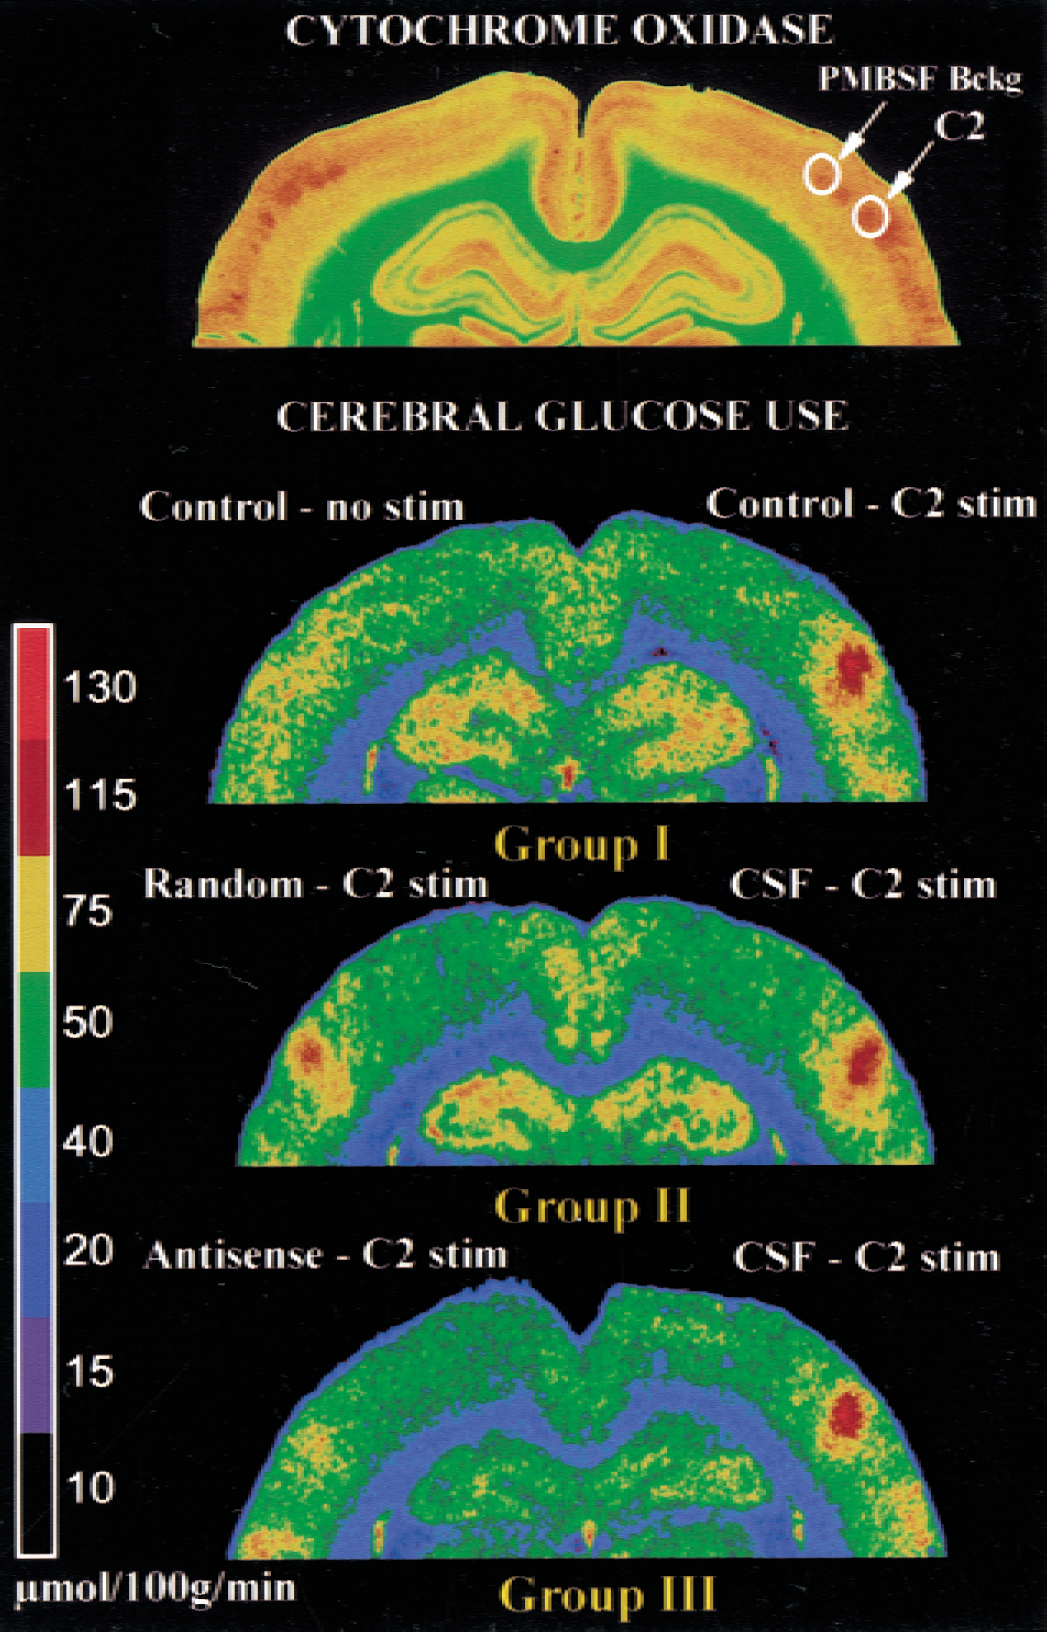
Representative color-coded autoradiograms of cerebral glucose utilization in three experimental groups. Cytochrome oxidase-stained section indicates the anatomic localization of the regions of interest (C2 and posteromedial barrel subfield (PMBSF) background).
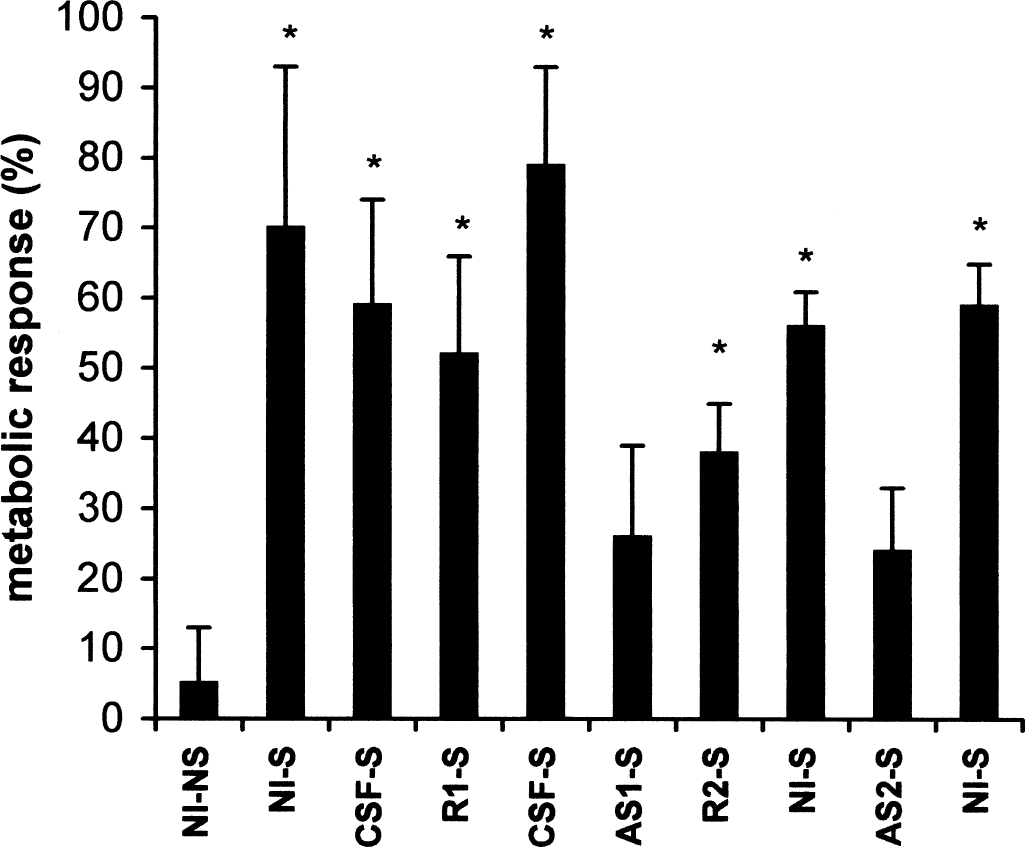
Metabolic response (percentage change) to C2 stimulation in all five experimental groups. NI-NS, not injected and not stimulated; NI-S, not injected and stimulated; CSF-S, cerebrospinal fluid injected and stimulated; R1-S, random 1 injected and stimulated; AS1-S, antisense 1 injected and stimulated; R2-S, random 2 injected and stimulated; AS2-S, antisense 2 injected and stimulated. *P < 0.05 (analysis of variance and Tukey's test).
DISCUSSION
Our results indicate that the glial glutamate transporter GLAST plays a critical role in coupling cortical functional activation to glucose metabolism in the adult rat. Local transient downregulation of GLAST was performed using an antisense strategy. This technique is based on the ability of a short complementary single-stranded oligonucleotide to inhibit translation of the targeted mRNA in a sequence-specific manner (Akhtar and Agrawal, 1997). Because unmodified phosphodiester ODNs are rapidly degraded by nucleases, more resistant ODN analogs have been developed, and the phosphorothioate modification of the backbone is now currently used (Agrawal and Iyer, 1995). The pharmacokinetics of phosphorothioate ODN in the central nervous system has been extensively studied (Szklarczyk and Kaczmarek, 1997; Whitesell et al., 1993). Although phosphorothioate ODNs exhibit a faster clearance after intraparenchymal injection compared with other ODN analogs, they nevertheless remain undegraded up to 48 hours within the tissue without evidence of toxicity (Broaddus et al., 1998). Our results support this contention, because the metabolic responses were still significant 24 hours after injection of both random sequences. Because GLAST antisense was specifically targeted to inhibit the translation of a glia-specific mRNA, we addressed the question of the cellular uptake of intracerebrally administered phosphorothioate ODNs. We found a neuronal uptake of fluorescein-labeled ODNs, suggesting an efficient uptake mechanism in neurons, as recently reported (Sommer et al., 1998). However, 24 hours after injection, astrocytes were also labeled by fluorescent ODNs, indicating that this cell type can be targeted in vivo, as previously reported (Sommer et al., 1998; Whitesell et al., 1993). Considering that, first, we obtained a similar decrease of the metabolic response with two ODN sequences targeted to different parts of the GLAST mRNA; second, one sequence was previously demonstrated in vivo to downregulate in a specific manner the glial glutamate transporter protein GLAST (Rothstein et al., 1996); and, third, no effect was found with both random sequences, we can reasonably assume that the decreased metabolic response was due to a specific decrease in GLAST expression. Such a strategy is considered to be a valuable approach to ascertain a selective antisense effect (Wagner, 1994). Finally, we provided evidence that whisker-related neuronal activity was still observed 24 hours after injection of the antisense or random sequences. Such activity was comparable to that previously described in control rats (Armstrong-James and Fox, 1987). It is therefore unlikely that the significant effect of the antisense on the CGU response to C2 stimulation was secondary to a major attenuation of the intensity of the whisker-induced neuronal activity.
Because GLAST is exclusively located on astrocytes (Lehre et al., 1995; Rothstein et al., 1994) and shares a similar perisynaptic distribution with the α2 subunit of Na+/K+-ATPase within cortical astrocytes (Hamel and Cholet, 2000), our results strongly suggest a significant role of astrocytes in coupling physiologic activation with energy metabolism. Indeed, a close examination of the anatomic and functional characteristics of astrocytes argues in favor of a central role for these cells in coupling neuronal activity to glucose utilization. Thus, the existence of particular astrocytic profiles, the end-feet, that surround brain capillaries led to the suggestion a century ago that these glial cells are involved in the distribution of substances from blood to other brain cells (see Magistretti and Pellerin, 1996, for references). Our recent anatomic data showing a clear relation between perivascular astrocyte end-feet and the endothelial glucose transporter (GLUT1) strongly support this contention (Kacem et al., 1998). Because astrocytes also display processes ensheathing synapses (Blumcke et al., 1995; Hamel and Cholet, 2000; Peters et al., 1991), these cells are ideally positioned to sense synaptic activity and to couple it to glucose uptake. Astrocytes also play a key role in buffering the increase in extracellular K+ associated with neuronal activity (see Amedee et al., 1997, for references). This occurs mainly via inward rectifying K+ currents and spatial buffering by the glial syncytium, two processes that require limited energy demands. Recent in vitro experiments have demonstrated, in contrast to previous findings (Cummins et al., 1979; Peng et al., 1994), that glucose metabolism in astrocytes is not significantly stimulated by raising K+ in the external medium (Takahashi et al., 1995). As noted earlier, astrocytes provide the major cellular site of uptake for synaptically released glutamate by means of efficient transporters (Rothstein et al., 1996). One of the major features of these transporters is that they use the transmembrane Na+ gradient to drive glutamate into the cell so that Na+ is also co-transported within the astrocyte (Bouvier et al., 1992). The extrusion of Na+ requires the intervention of Na+/K+-ATPase and therefore consumes ATP. In vitro experiments have indeed provided evidence that glutamate uptake stimulates Na+/K+-ATPase activity and glucose uptake and phosphorylation in astrocytes (Pellerin and Magistretti, 1994, 1997; Takahashi et al., 1995). Our observations indicating that in vivo, the downregulation of the glial glutamate transporter GLAST decreases the metabolic response to functional activation suggests that, first, brain glucose metabolism is closely linked to glutamatergic neuronal activity and, second, astrocytes are one of the key elements of the metabolic coupling. The notion that brain glucose metabolism is related to glutamatergic neuronal activity has been recently substantiated by a magnetic resonance spectroscopy study indicating a stoichiometry of 1:1 between glutamate recycling (via its uptake and transformation into glutamine within astrocytes) and oxidative glucose metabolism (Sibson et al., 1998).
GLT-1, the other major glutamate transporter found on astrocytes, has been reported to be even more abundantly expressed than GLAST in many brain areas, including the cortex (Lehre and Danbolt, 1998; Rothstein et al., 1994). Our results do not exclude the participation of this transporter to the coupling mechanism proposed here. In fact, the partial inhibition obtained with GLAST antisense would rather argue in favor of other components, one of them being possibly GLT-1.
Our results also raise the question of the metabolic fate of glucose within astrocytes. After its phosphorylation to glucose-6-phosphate, it was shown in cultured astroglial cells that the main metabolic pathway followed by glucose is glycolysis leading to aerobic lactate production (see Wiesinger et al., 1997, for references). One can therefore hypothesize that an increased glial glucose uptake and phosphorylation induced by glutamate uptake will result in lactate release also in vivo. Microdialysis experiments have provided convincing support for this hypothesis because the increased lactate release resulting from physiologic stimulation is of glial origin (Elekes et al., 1996) and can be blocked by glutamate uptake inhibitors (Demestre et al., 1997). This model implies that lactate is subsequently taken up and metabolized by neurons along the oxidative pathway. The distribution of appropriate lactate dehydrogenase isoforms in astrocytes and neurons (Bittar et al., 1996) and the recent anatomic characterization of glial and neuronal lactate transporters (Gerhart et al., 1997, 1998; Koehler-Stec et al., 1998; Pellerin et al., 1998; Pierre et al., 2000) provide further evidence for an exchange of lactate between astrocytes and neurons. The notion that lactate may serve as an energy substrate for brain tissue is supported by numerous experimental data (McIlwain, 1953; Schurr et al., 1988). In addition, it has been recently proposed that extracellular lactate may serve as a local energy pool to fulfill the rapid energy demand during functional activation (Hu and Wilson, 1997). This coupling model may then provide a reasonable explanation for the numerous observations made in vivo indicating transient nonoxidative glucose utilization or an increased lactate level during functional activation in animals (Fellows et al., 1993; Ueki et al., 1988) or humans (Fox et al., 1988; Frahm et al., 1996; Sappey-Marinier et al., 1992).
Finally, our results may have physiopathologic relevance. Decrease in CGU in specific cortical regions is a well-characterized feature of Alzheimer's disease (Duara et al., 1986; Friedland et al., 1985; Friston and Frackowiak, 1991). More recently, a deficient glutamate transport has been involved in the pathogenesis of synaptic damage in Alzheimer's disease (Masliah et al., 1996). This deficiency is possibly linked to abnormal amyloid precursor protein expression (Li et al., 1997) leading to β-amyloid accumulation. β-amyloid inhibits glial glutamate uptake in vitro (Harris et al., 1996) and also glial glucose uptake (Parpura-Gill et al., 1997). Thus, a decrease in glial glutamate uptake may contribute to neurodegeneration in Alzheimer's disease by excitotoxic processes and by impairing the availability of glucose to support energy metabolism.
In conclusion, our results highlight the contribution of astrocytes to metabolic coupling in vivo. We provide evidence that the glial glutamate transporter GLAST is one of the key molecular components of this coupling. Results indicate that astrocytes should be considered as a possible site of alteration in brain metabolism that could also lead to altered imaging signals in pathologic situations.
Footnotes
Acknowledgments:
The authors thank P. Trouvé and Dr. F. Passarelli for their useful help on initial aspects of this work and Charles Quairiaux for help with the electrophysiology.