
Abstract
Hyperbaric oxygen (HBO2) increases oxygen tension (PO2) in blood but reduces blood flow by means of O2-induced vasoconstriction. Here we report the first quantitative evaluation of these opposing effects on tissue PO2 in brain, using anesthetized rats exposed to HBO2 at 2 to 6 atmospheres absolute (ATA). We assessed the contribution of regional cerebral blood flow (rCBF) to brain PO2 as inspired PO2 (PiO2) exceeds 1 ATA. We measured rCBF and local PO2 simultaneously in striatum using collocated platinum electrodes. Cerebral blood flow was computed from H2 clearance curves in vivo and PO2 from electrodes calibrated in vitro, before and after insertion. Arterial PCO2 was controlled, and body temperature, blood pressure, and EEG were monitored. Scatter plots of rCBF versus pO2 were nonlinear (R2 = 0.75) for rats breathing room air but nearly linear (R2 = 0.88–0.91) for O2 at 2 to 6 ATA. The contribution of rCBF to brain PO2 was estimated at constant inspired PO2, by increasing rCBF with acetazolamide (AZA) or decreasing it with N-nitro-
Introduction
The O2 content of blood is the mathematical product of hemoglobin concentration and arterial hemoglobin O2 saturation, the latter being a nonlinear function of arterial oxygen partial pressure (PaO2). The small amount of O2 dissolved in plasma is usually negligible. However, breathing hyperbaric oxygen (HBO2), that is oxygen at pressures greater than 1 atmosphere absolute (ATA), raises PaO2 beyond the point at which hemoglobin is fully saturated, so that the dissolved fraction becomes the main source of O2 available to cells. But this does not assure enhanced O2 delivery to brain, because tissue PO2 also depends on regional blood flow.
Tissue oxygen tension (PO2) is a dynamic balance between O2 delivery and consumption. Many authors have reported increased brain PO2 in HBO2 (Jamieson and Van Den Brenk, 1962; Bennett, 1965; Bean et al, 1971; Torbati et al, 1978; Hunt et al, 1978), and reviews are available (Jamieson, 1989; Camporesi et al, 1996; Dean et al, 2003). It is also known that total or regional cerebral blood flow (rCBF) decreases in HBO2 as a function of pressure and time. But the contribution of CBF to brain PO2 had never been quantified. Cerebral vasoconstriction and decreased total or rCBF have been shown in healthy volunteers and patients breathing O2 at 3.5 ATA for brief periods (Lambertsen et al, 1953; Visser et al, 1996; Omae et al, 1998). In animals, in which HBO2 is maintained for longer times and at higher pressures, the rCBF response is biphasic: the initial decrease in rCBF is followed by a secondary rise to control levels and above (Bean et al, 1971; Torbati et al, 1978; Demchenko et al, 2000a), which heralds the onset of O2-induced EEG spikes or convulsions (Bean et al, 1971; Torbati et al, 1978; Chavko et al, 1998; Demchenko et al, 1998, 2000a; Sato et al, 2002) and may be important in the etiology of central nervous system (CNS) oxygen toxicity.
In our previous studies in mice and rats at 5 ATA, rCBF first fell as brain PO2 rose modestly, but rCBF increased after 40 to 60 mins accompanied by a dramatic rise in brain PO2 (Demchenko et al, 2001; Atochin et al, 2003). This led us to attempt quantitative measurements of the contribution of rCBF to changes in brain PO2 during HBO2, which can only be assessed in the same brain region, because CBF and brain PO2 may differ in adjacent microregions (see Kuschinsky and Paulson, 1992; Lübbers et al, 1994). We used collocated hydrogen clearance and oxygen microelectrodes to measure these two variables.
Our goals were to: (a) surmount the technical challenges of measuring CBF and PO2 simultaneously in the same microregion of brain in HBO2; (b) to assess the contribution of inspired PO2 (PiO2) to brain PO2 in HBO2; (c) quantify the rCBF contribution to brain PO2 in HBO2; (d) test our hypothesis that CBF determines brain PO2 in HBO2; and (e) to mathematically model the rCBF contribution to brain PO2.
Materials and methods
Animal Preparation
Adult, male Sprague—Dawley rats (Charles River, NC, USA n = 87) weighing 304±15 g were used as approved by the Duke University Institutional Animal Care and Use Committee, as described (Demchenko et al, 1998). Anesthesia was induced with urethane (1.2 g/kg, intraperitoneal), the trachea was intubated and both femoral arteries and one femoral vein were catheterized to measure blood pressure, take samples, and infuse drugs. Animals were secured in a stereotaxic frame and ventilated with 30% O2 (balance N2). The skull was drilled over the left and right caudate putamen 0.5 mm anterior and 2.5 mm lateral/medial to bregma (Paxinos and Watson, 1986). After stripping the dura mater, oxygen- and hydrogen-sensitive electrodes were inserted 5.4 mm below the brain surface and fixed in position. Anatomic locations of the electrodes were confirmed postmortem. For EEG recording, two stainless-steel screws were driven into the skull symmetrically over the left and right parietal cortex.
Fully anesthetized rats were given pancuronium bromide (0.5 mg/kg, intravenous) to prevent voluntary respiratory motion and to permit maintaining PaCO2 at 35 to 38 mm Hg by adjusting respiratory volume. Anesthesia and immobility were maintained by intravenous urethane (0.2 g/kg h) and pancuronium bromide (0.1 mg/kgh). Adequacy of anesthesia was verified by testing corneal reflexes during surgical preparation and, after paralysis, by observing blood pressure responses to toe pinch. Control studies indicated that this regimen of supplemental anesthesia is adequate for the HBO2 exposures.
Physiologic Measurements
Arterial blood pressure was measured continuously and integrated to obtain mean arterial blood pressure (MABP). The PaO2, PCO2, and pH were determined before and after HBO2 exposure using an IL 1306 Blood Gas/pH analyzer. Rectal temperature was monitored throughout and held at 37°C±0.5°C using a heating pad. EEG was recorded continuously and EEG spikes equated with CNS oxygen toxicity.
Oxygen Tension and Cerebral Blood Flow Measurements
Brain PO2 and rCBF were measured simultaneously and ipsilaterally in striatum using collocated electrodes (Figure 1) of platinum wire (100 μm diameter) insulated with epoxy, except for 1 mm at the tip. The electrically sharpened 10 μm tips were coated with Nafion® (Aldrich Chemical Co., Milwaukee, WI) to prevent protein fouling and were placed in the same micro-region of striatum, separated by distances from 20 to 120 μm (Demchenko et al, 1998). Oxygen electrodes were calibrated before and after each experiment in three artificial cerebral spinal fluid (ACSF) buffers at 37°C, equilibrated with: 100% nitrogen (0% O2), air (21% O2), and 100% O2. Actual PO2 in the ACSF was measured by the blood gas analyzer. If initial and final calibrations diverged by more than 10%, that experiment was not included in the series. Brain PO2 under HBO2 was determined by linear regression.
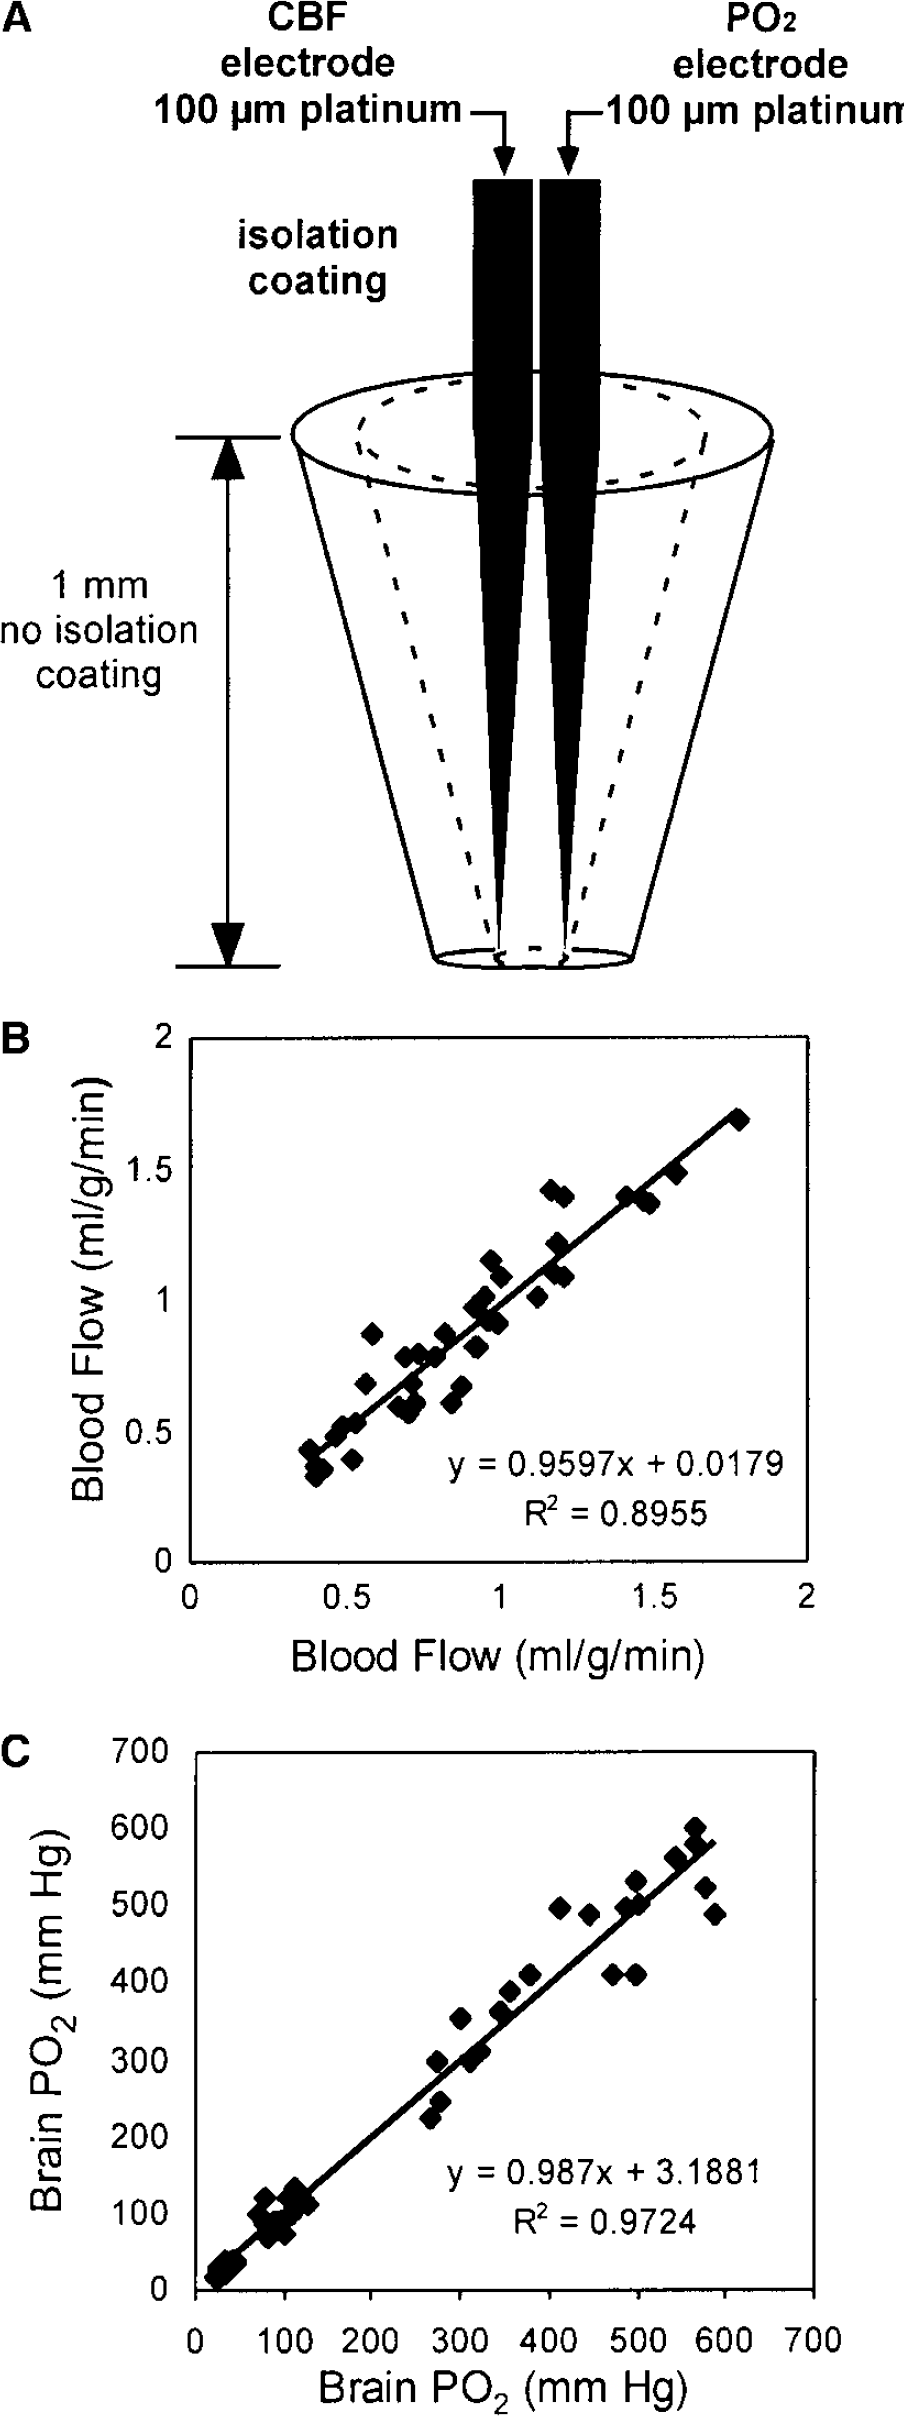
Collocated electrodes simultaneously measure regional cerebral blood flow (rCBF) and brain oxygen tension (PO2). (
To measure CBF, 2.5% H2 in air was introduced through the respirator for 60 sec, then H2 washout curves were captured using WINDAQ software (D-1200 AC, DATAQ Instruments). Absolute CBF (mL/100 g min) was calculated by the initial slope method using Mathematica 3.0 software (Wolfram Research) with minor modifications (Demchenko et al, 1998).
Hyperbaric Oxygen Exposures
Rats were placed in a hyperbaric chamber (volume 36 m3) with the stereotaxic frame, respirator, blood pressure transducer, heating pad, and infusion pump. Electrodes were connected through hermetic wall penetrations to amperometric amplifiers outside the chamber. After 2 h of stabilization in which the animal breathed 30% O2 and blood gas values remained physiologic, three H2 clearance curves were recorded to calculate control rCBF. The respirator was then supplied with 100% O2, and the chamber atmosphere raised at 0.6 ATA per minute with air to 2, 3, 5 or 6 ATA. Hyperbaric oxygen exposures lasted 60 to 75 min while CBF was measured every 15 mins. Immediately after decompression blood gases and pH were determined as the rats continued to breathe 100% O2.
Study Design
In a first series of experiments (1 ATA controls), we correlated CBF with PO2 using three groups of rats breathing 30% O2 (balance N2) at 1 ATA (n = 10 each group). Brain PO2 and CBF were measured at the steady state and after infusion of either the vasodilator acetazolamide (AZA, 35 mg/kg, intraperitoneal), the vasoconstrictor N-nitro-l-arginine methyl ester (l-NAME, 30 mg/kg, intraperitoneal) or saline (Demchenko et al, 2000b, 2001; Gutsaeva et al, 2004).
In a second series (HBO2 without vasoactive drugs), CBF and PO2 were measured in four groups of rats at 2, 3, 5, or 6 ATA (n = 8 to 10 each group) to assess the effect of PiO2 on brain PO2 and CBF.
In a third series (HBO2 with vasoactive drugs), CBF versus PO2 was studied in eight groups of rats treated with AZA or l-NAME 30 mins before exposure to 2, 3, 5, or 6 ATA (n = 8 each group) to evaluate the contribution of CBF to brain PO2 in HBO2.
Data from all these studies were applied to our model of O2 diffusion at the capillary—tissue interface when hemoglobin (Hb) is fully saturated, based on the Krogh cylinder (see Appendix).
Data Analysis
Grouped data are reported as means±standard deviations (s.d.). Cerebral blood flow, brain PO2, and physiologic variables over time were compared using ANOVA and Fisher's post hoc analysis. Paired t-tests enabled comparison of absolute and percent changes in rCBF or PO2 in HBO2, with or without
Results
Cerebral Blood Flow and Oxygen Tension Measurements in the Same Microregion of Striatum
Our individual working electrodes sample a cone-like tissue volume of 0.58 mm3, since a 90% oxygen diffusion field encompasses a tissue radius 6.3 times that of the cathode (Baumgartl et al, 1974). And two electrodes ~0.2 mm apart at their tips sample a shared cone of 0.43 mm3 for PO2 and PH2 (Figure 1A). Because the volume of the rat striatum in one hemisphere is approximately 36 mm3, the sampled region constitutes less than 2% of striatum volume. To show that CBF and PO2 recorded from the same brain region were highly correlated, we compared measurements in which both Pt electrodes in one hemisphere recorded only PO2 or only CBF (Figures 1C and Figure 1B).
Cerebral Blood Flow and Oxygen Tension in Control Conditions
At 1 ATA (series I, n = 31), striatal CBF was stable at 78±5 mL/100 g min (Figure 2A) and striatal PO2 ranged from 29 to 38 mm Hg, averaging 34±5.5 mm Hg (Figure 2B), throughout 90 mins of observation in rats ventilated on 30% O2 with arterial PCO2 at 35 to 38 mm Hg. For rats exposed to HBO2 (series II and III, n = 88), average initial control values for CBF at 1 ATA were 80±6 mL/100 g min and for brain PO2 were 35±5 mm Hg. Switching to room air decreased striatal PO2 to 25±4 mm Hg (P<0.05) without changing rCBF significantly (not shown).
In rats in series I (breathing 30% O2 at 1ATA), treated with
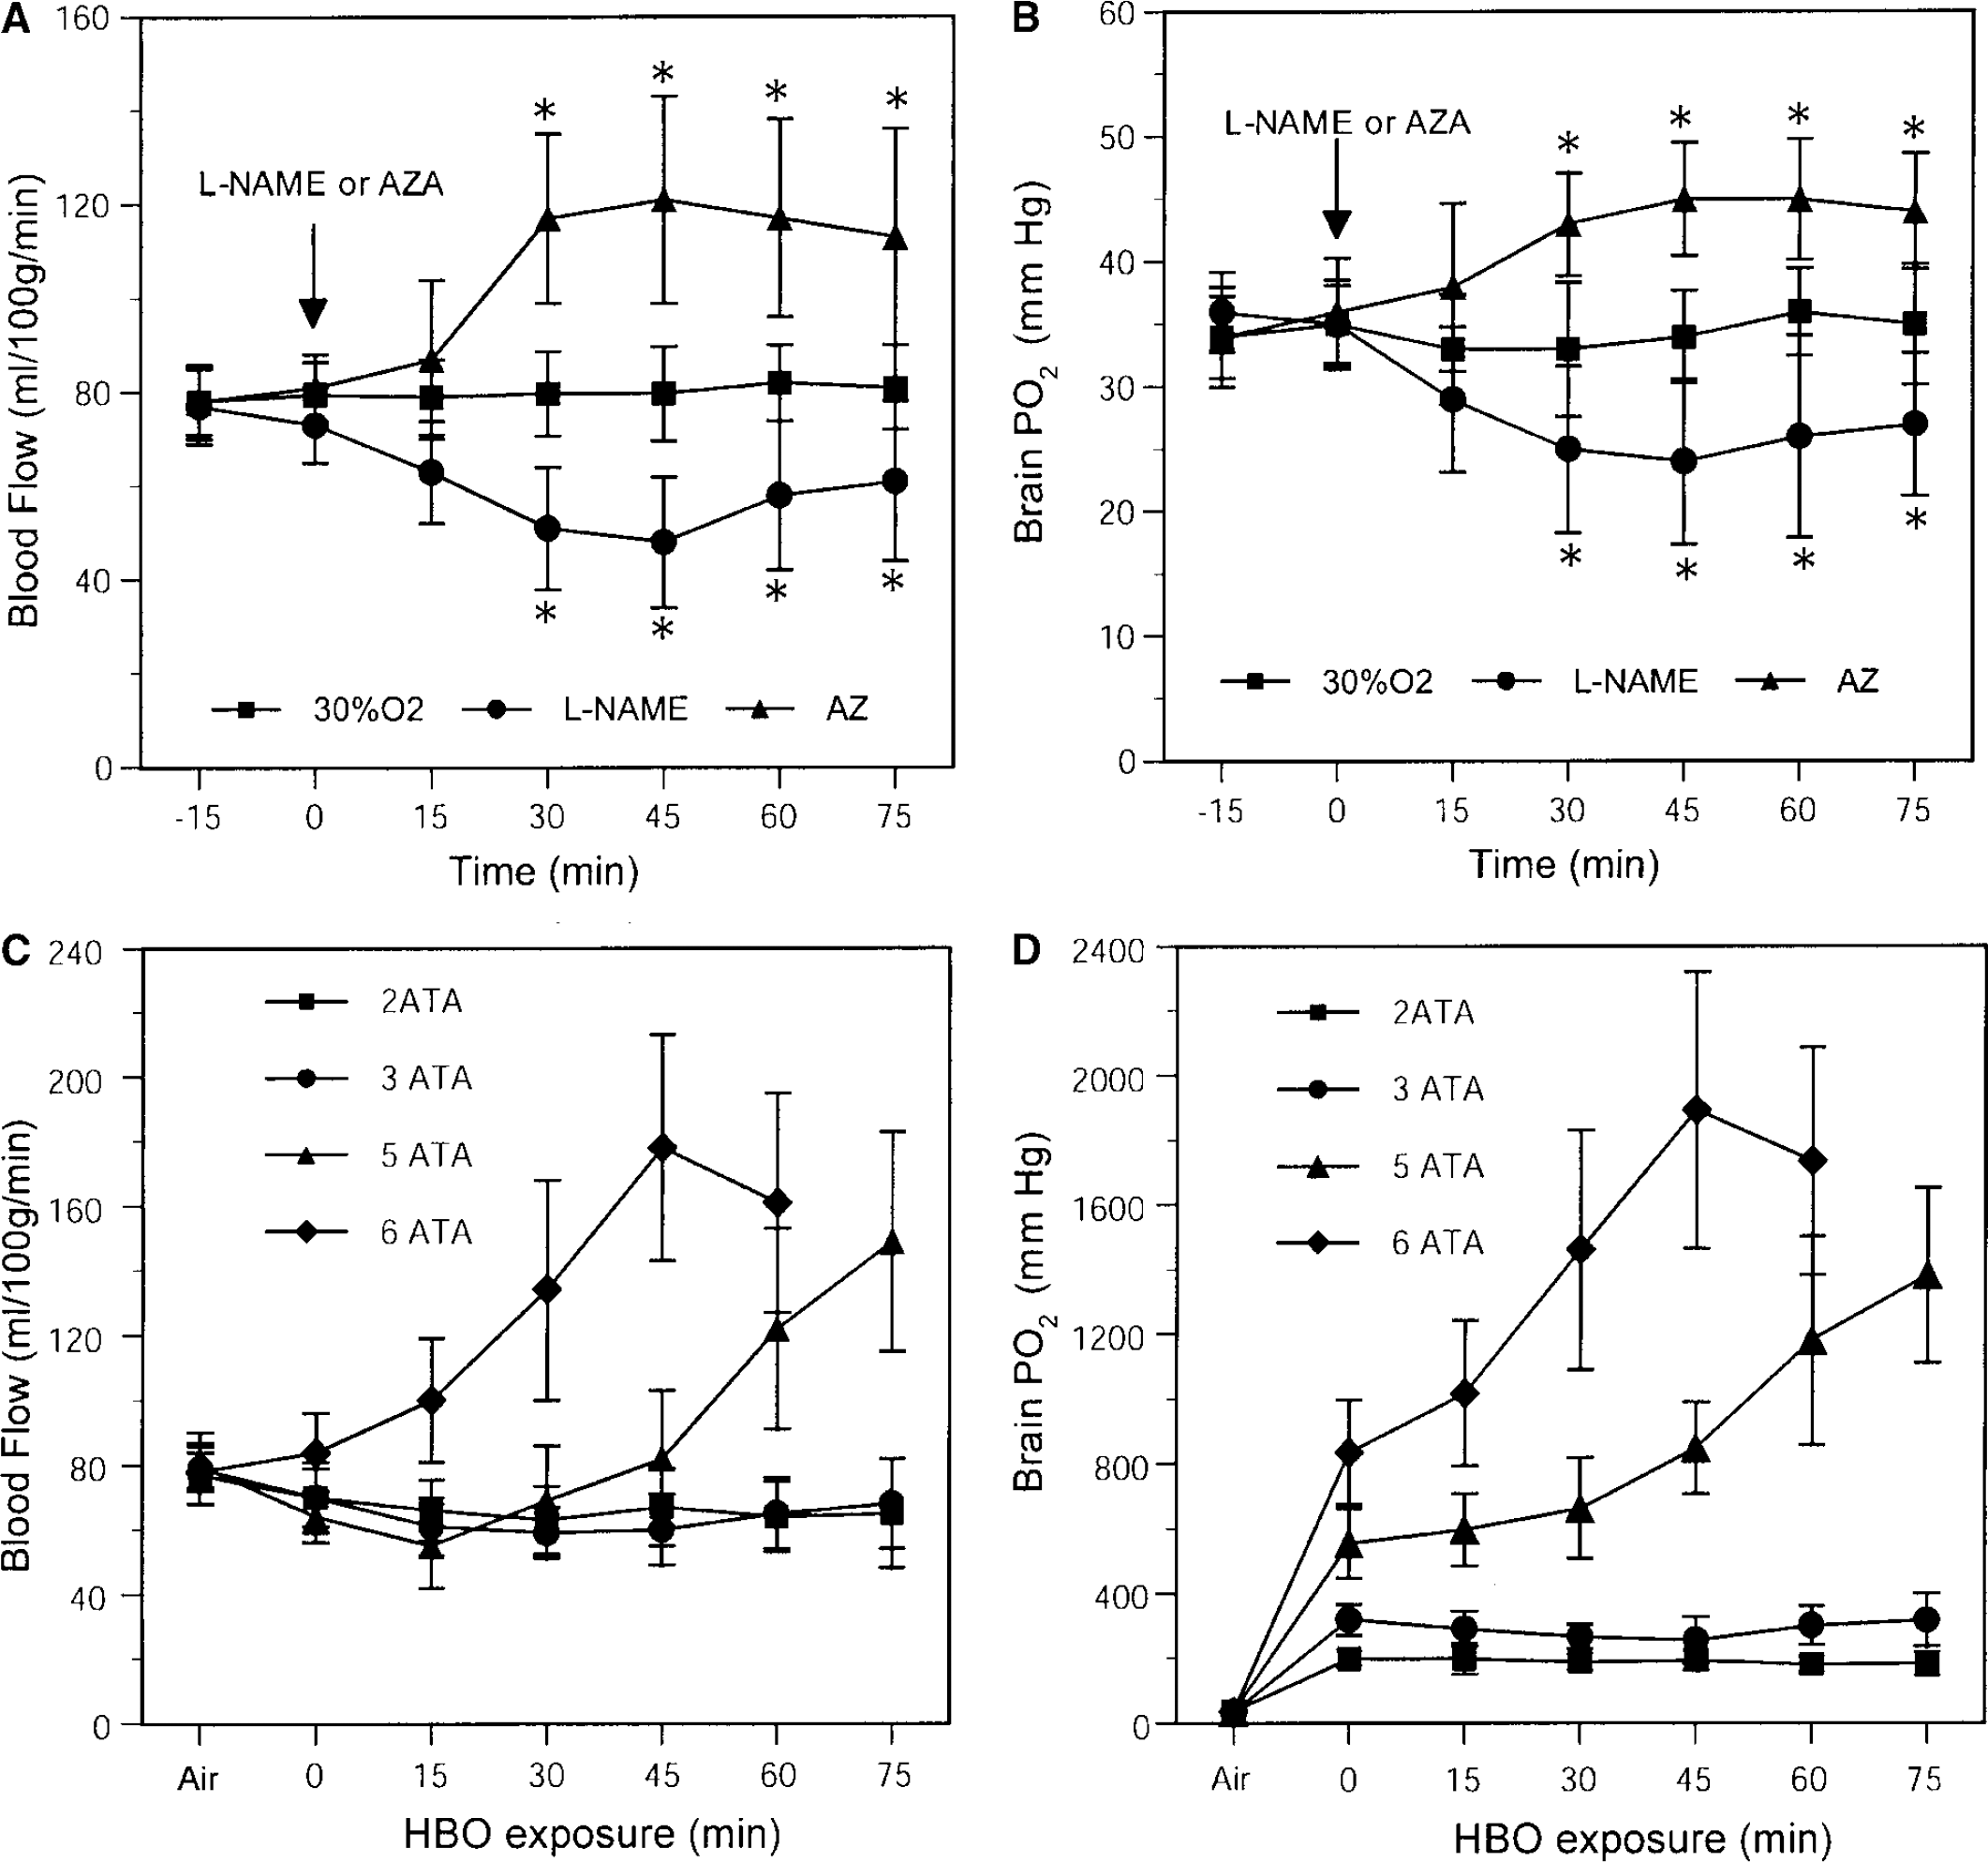
Striatal regional cerebral blood flow (rCBF) (
Changes in brain PO2 paralleled CBF in the same brain region after administration of
Gas-exchange and mean arterial blood pressure in control rats breathing 30% O2 (balance N2), before and after receiving
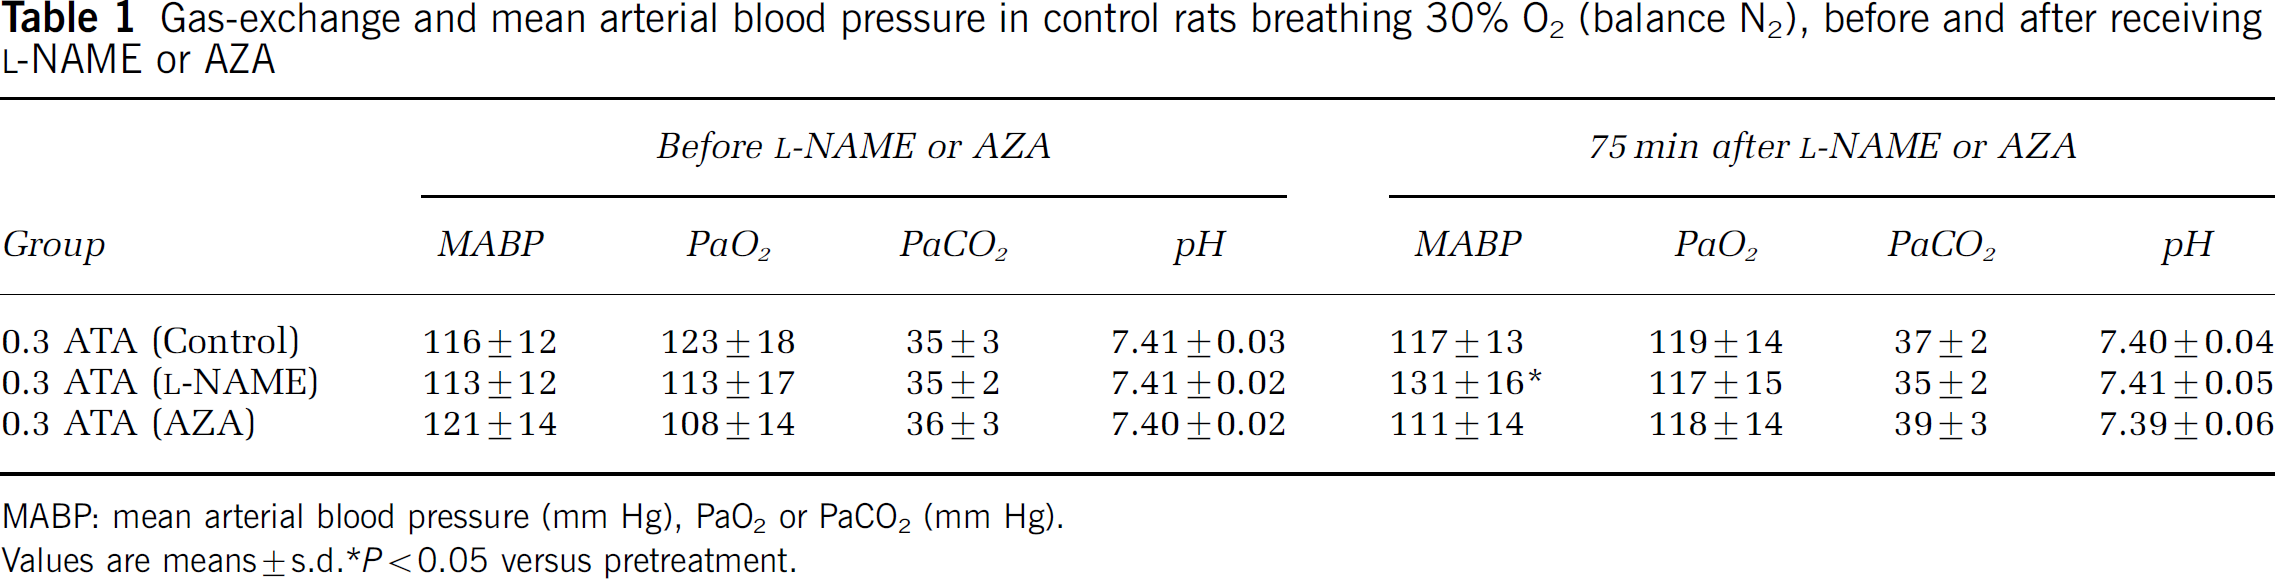
MABP: mean arterial blood pressure (mm Hg), PaO2 or PaCO2 (mm Hg).
Values are means±s.d. P<0.05 versus pretreatment.
Cerebral Blood Flow and Oxygen Tension in Hyperbaric Oxygen
Cerebral blood flow responses to HBO2 were strongly PiO2-dependent. At 2 and 3 ATA, striatal blood flow decreased by 18%±5% (P<0.01) and 24%±13% (P<0.05), respectively, over 30 mins of HBO2 and then remained near these levels until decompression (Figure 2C). In these animals, no EEG evidence of O2 toxicity was observed throughout the 75 mins exposure. However, after 15 mins at 5 ATA, CBF decreased 34%±11% (P<0.01), then gradually rose and by 45 mins returned to pre-exposure levels, and over the next 30 mins increased by 81%±31% (P<0.01) above initial control values (Figure 2C). Paroxysmal EEG spikes exceeding 100 μV were observed at a mean time of 62±7 mins after initiating HBO2 and always followed increased rCBF. Hyperbaric oxygen at 6 ATA produced a different pattern: striatal blood flow rose immediately, reaching 128%±47% (P<0.01) of control after 45 mins (Figure 2C).
Brain PO2 responses to HBO2 also depended on PiO2 and time. At 1 ATA, ventilation with 100% O2 increased mean striatal PO2 to 98±7 mm Hg, whereas during steady-state HBO2 at 2 or 3 ATA, brain PO2 reached stable values of 181 to 199 and 255 to 319 mm Hg, respectively (Figure 2D). During compression to 5 ATA, brain PO2 rose, despite vasoconstriction, to an average of 554±106 mm Hg, and when vasoconstriction was abolished and CBF rebounded to pre-exposure levels, PO2 increased to 849±141 mm Hg. After 45 mins, PO2 climbed dramatically to more than 1,500 mm Hg, and EEG spikes appeared at 900 to 1000 mm Hg. Hyperbaric oxygen at 6 ATA produced even greater changes: striatal PO2 reached 836±161 mm Hg after compression and after the next 45 mins exceeded 2,000 mm Hg (Figure 2D). Because EEG spikes appeared at 37±8 mins, O2 exposure at 6 ATA was limited to 60 mins.
Figure 3 illustrates the effect of the vasoconstrictor
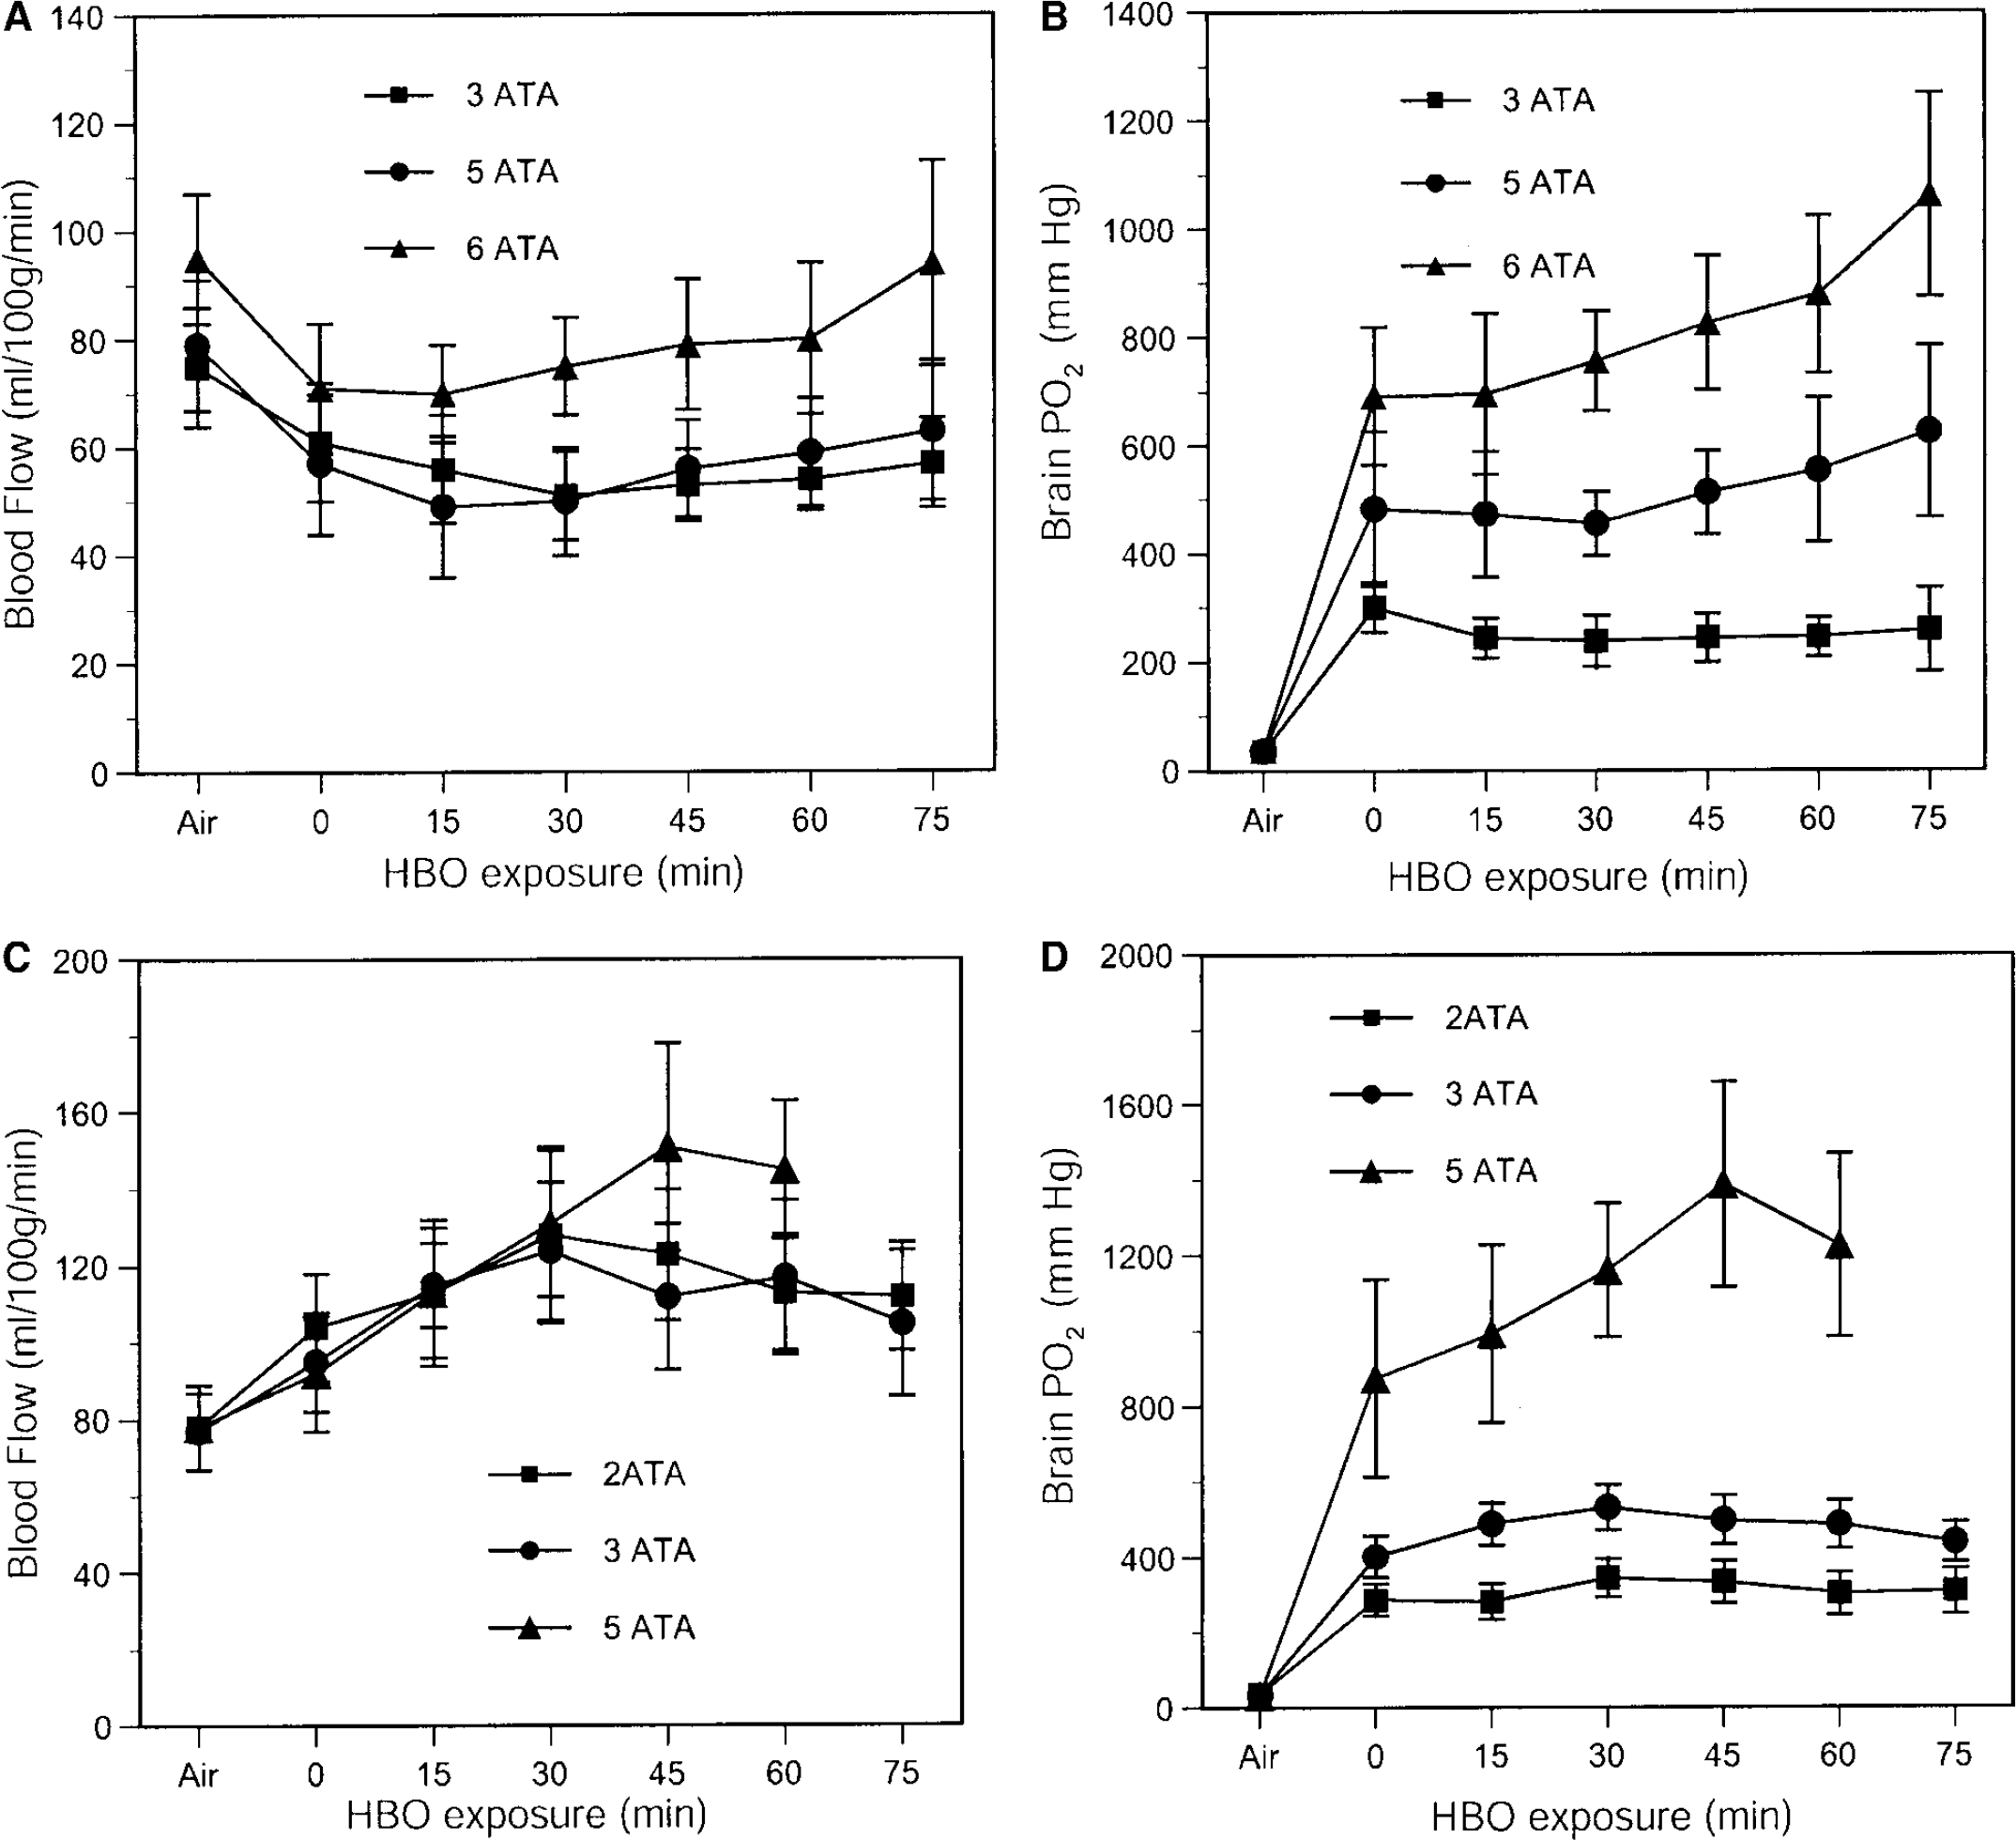
Effects of hyperbaric oxygen (HBO2) on striatal cerebral blood flow (CBF) and oxygen tension (PO2) are shown in rats pretreated with
In all HBO2-exposed animals, baseline MABP, pH, PaO2, and PaCO2 values were similar (Table 2). After HBO2 exposure, arterial PaCO2 and pH were slightly higher than initial values, but well within the physiologic range for rats. The PaO2 was greater than 400 mm Hg for animals breathing 100% O2 at 1 ATA, before and after HBO2, indicating that normal pulmonary gas exchange was preserved and very high arterial PO2 values were attained when blood gases could not be measured during the HBO2 exposures. Arterial blood pressure in rats exposed to 2, 3, 5, or 6 ATA rose by 17% to 31% during compression and the first few minutes of HBO2 and increased again immediately before or with the appearance of EEG spikes.
Gas-exchange and mean arterial blood pressure in rats exposed to oxygen at 2 to 6 ATA
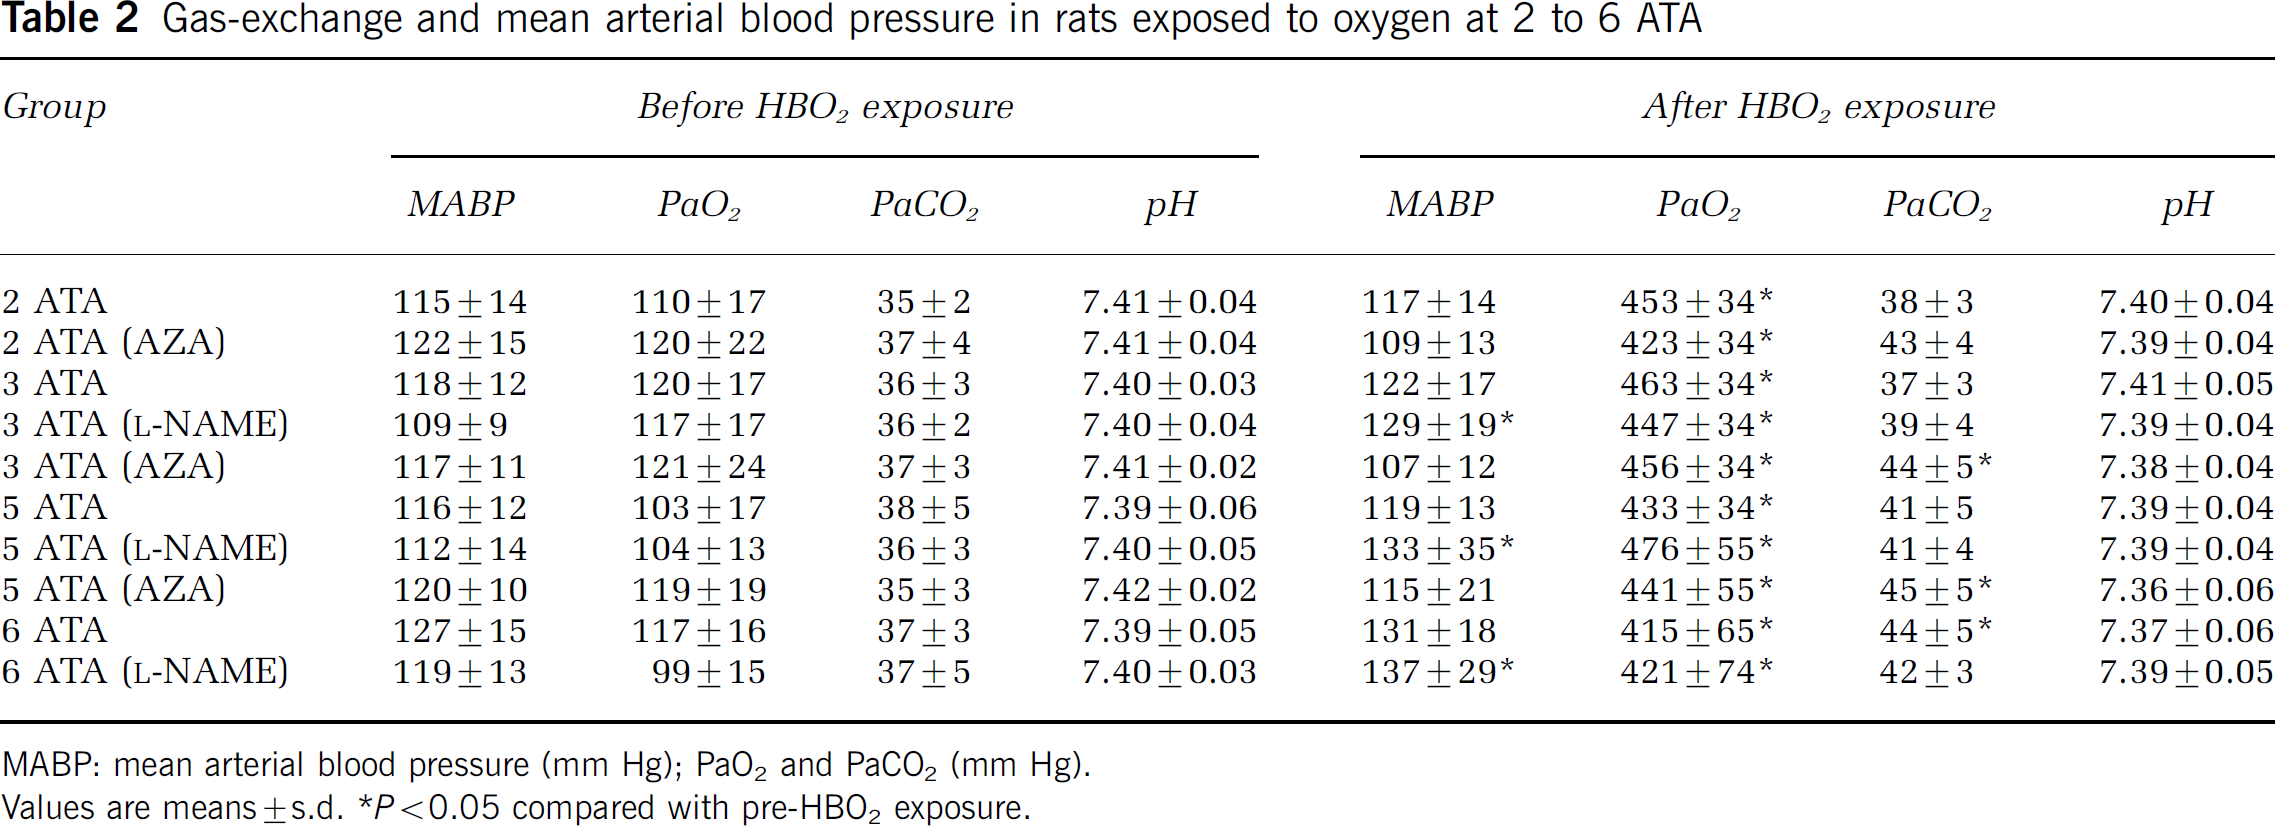
MABP: mean arterial blood pressure (mm Hg); PaO2 and PaCO2 (mm Hg).
Values are means±s.d.P<0.05 compared with pre-HBO2 exposure.
Cerebral Blood Flow—Oxygen Tension Correlation During Hyperbaric Oxygen
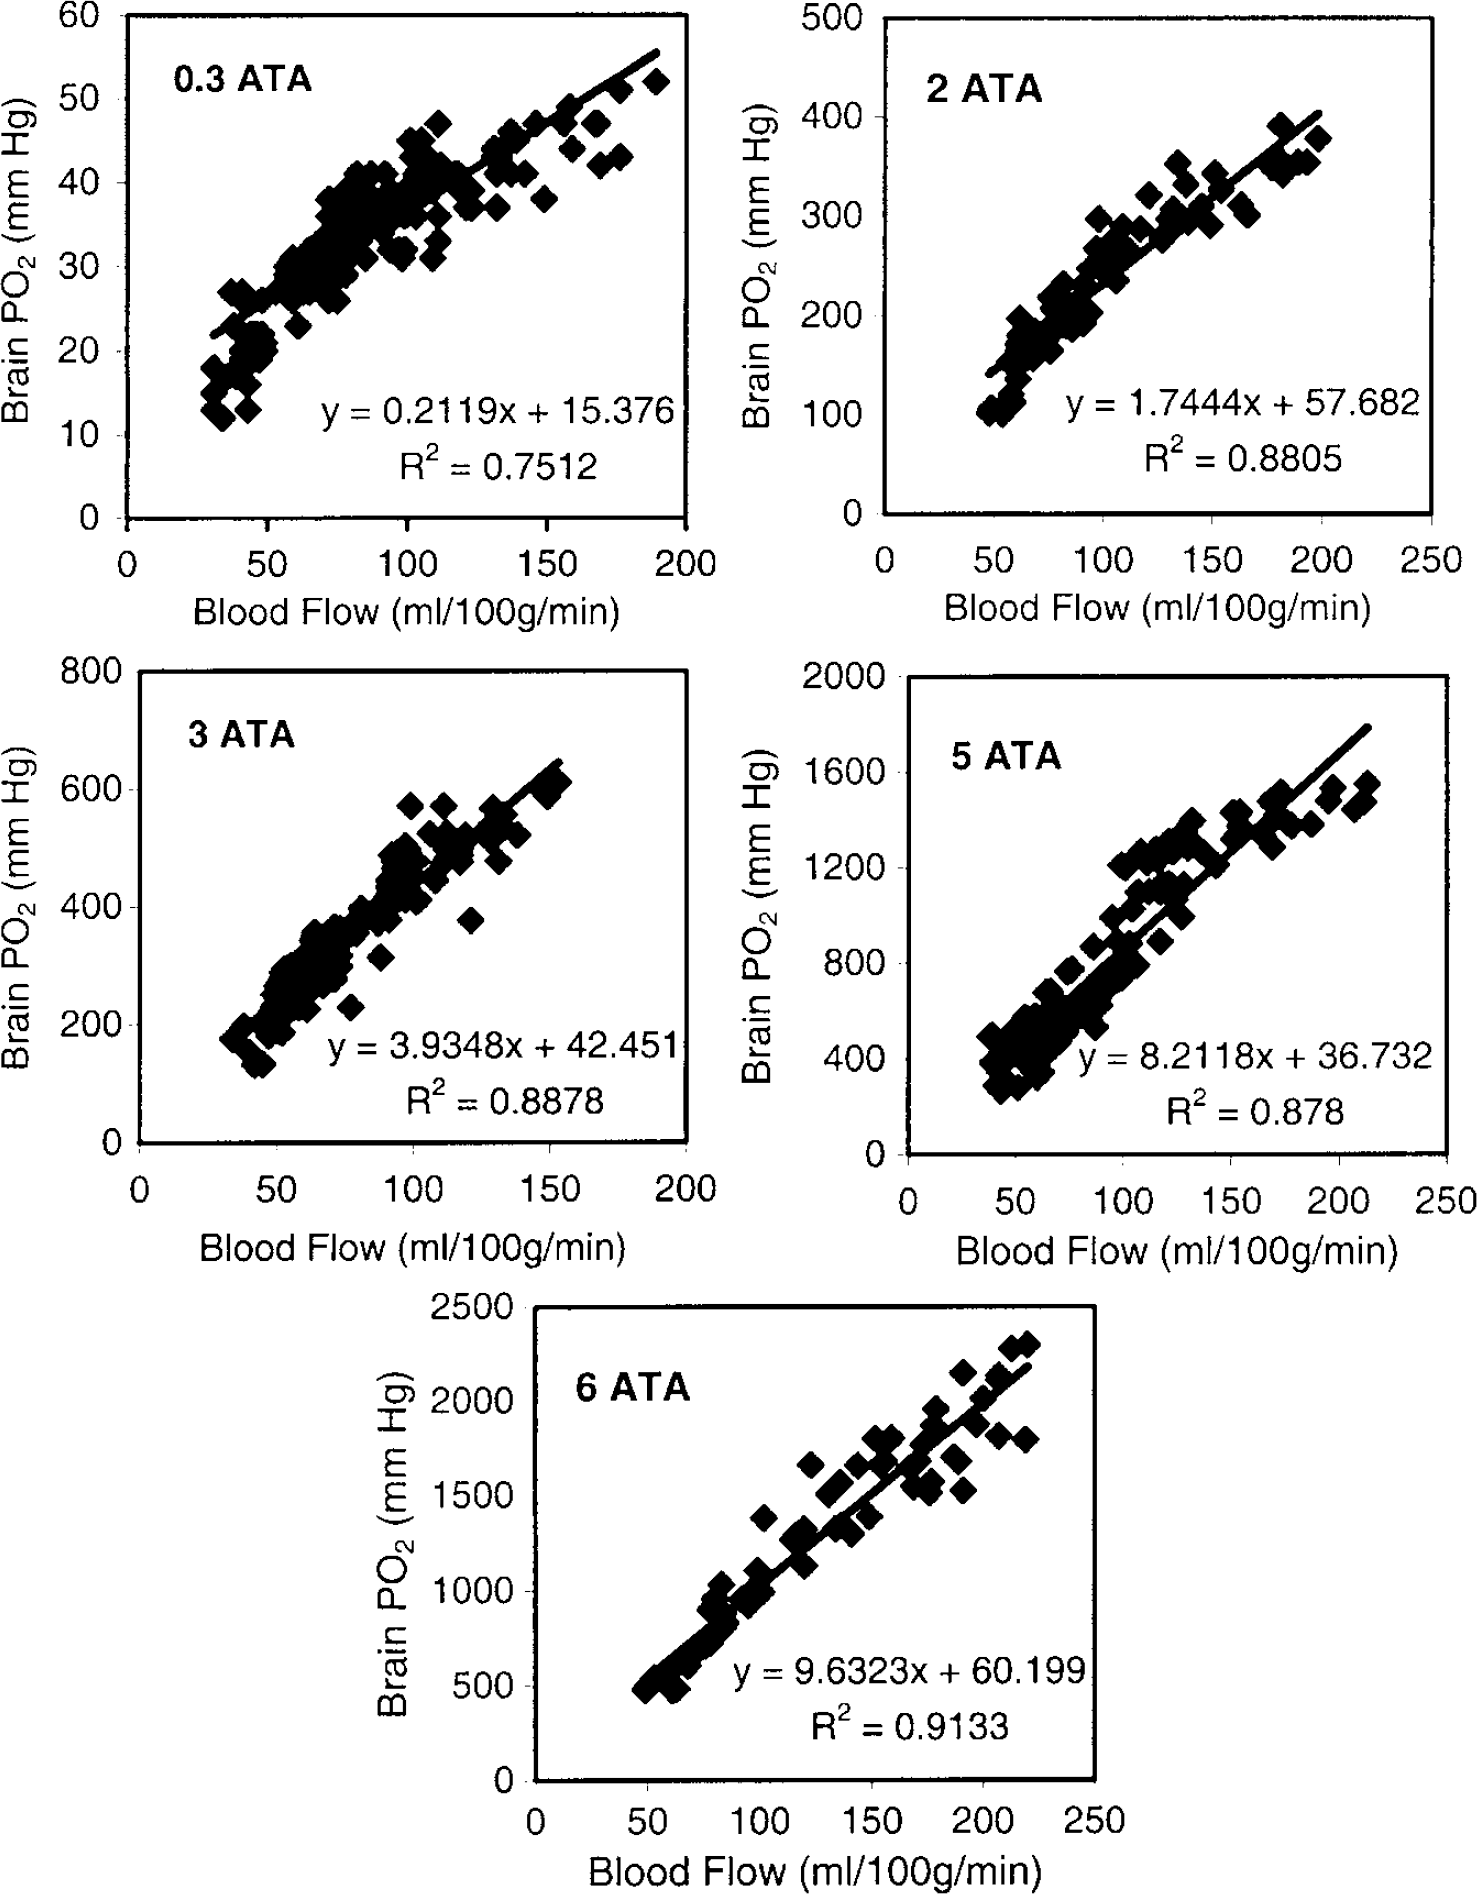
Figure 4 shows scatter plots of PO2 versus rCBF measured simultaneously in the same brain region in 30% O2 at 1 ATA and in 100% O2 at 2, 3, 5, and 6 ATA, with and without
Simulation of Cerebral Blood Flow—Oxygen Tension Relationships
A Krogh-cylinder model—a cylindrical blood vessel surrounded by a cylinder of perfused tissue (Figure 6 and Appendix-)–simulates CBF—PO2 relationships for variations in HBO2 or blood velocity (BV). With a BV assumed between 250 to 1000 μm/sec, tissue cylinder PO2 in the model varies almost linearly with PiO2 between 2 and 6 ATA (Figure 5A). The model's predictions were compared with real data from direct measurements of CBF and brain PO2. The modeled HBO2-dependent changes in brain PO2 were very similar to our experimentally determined results (Figure 5B).
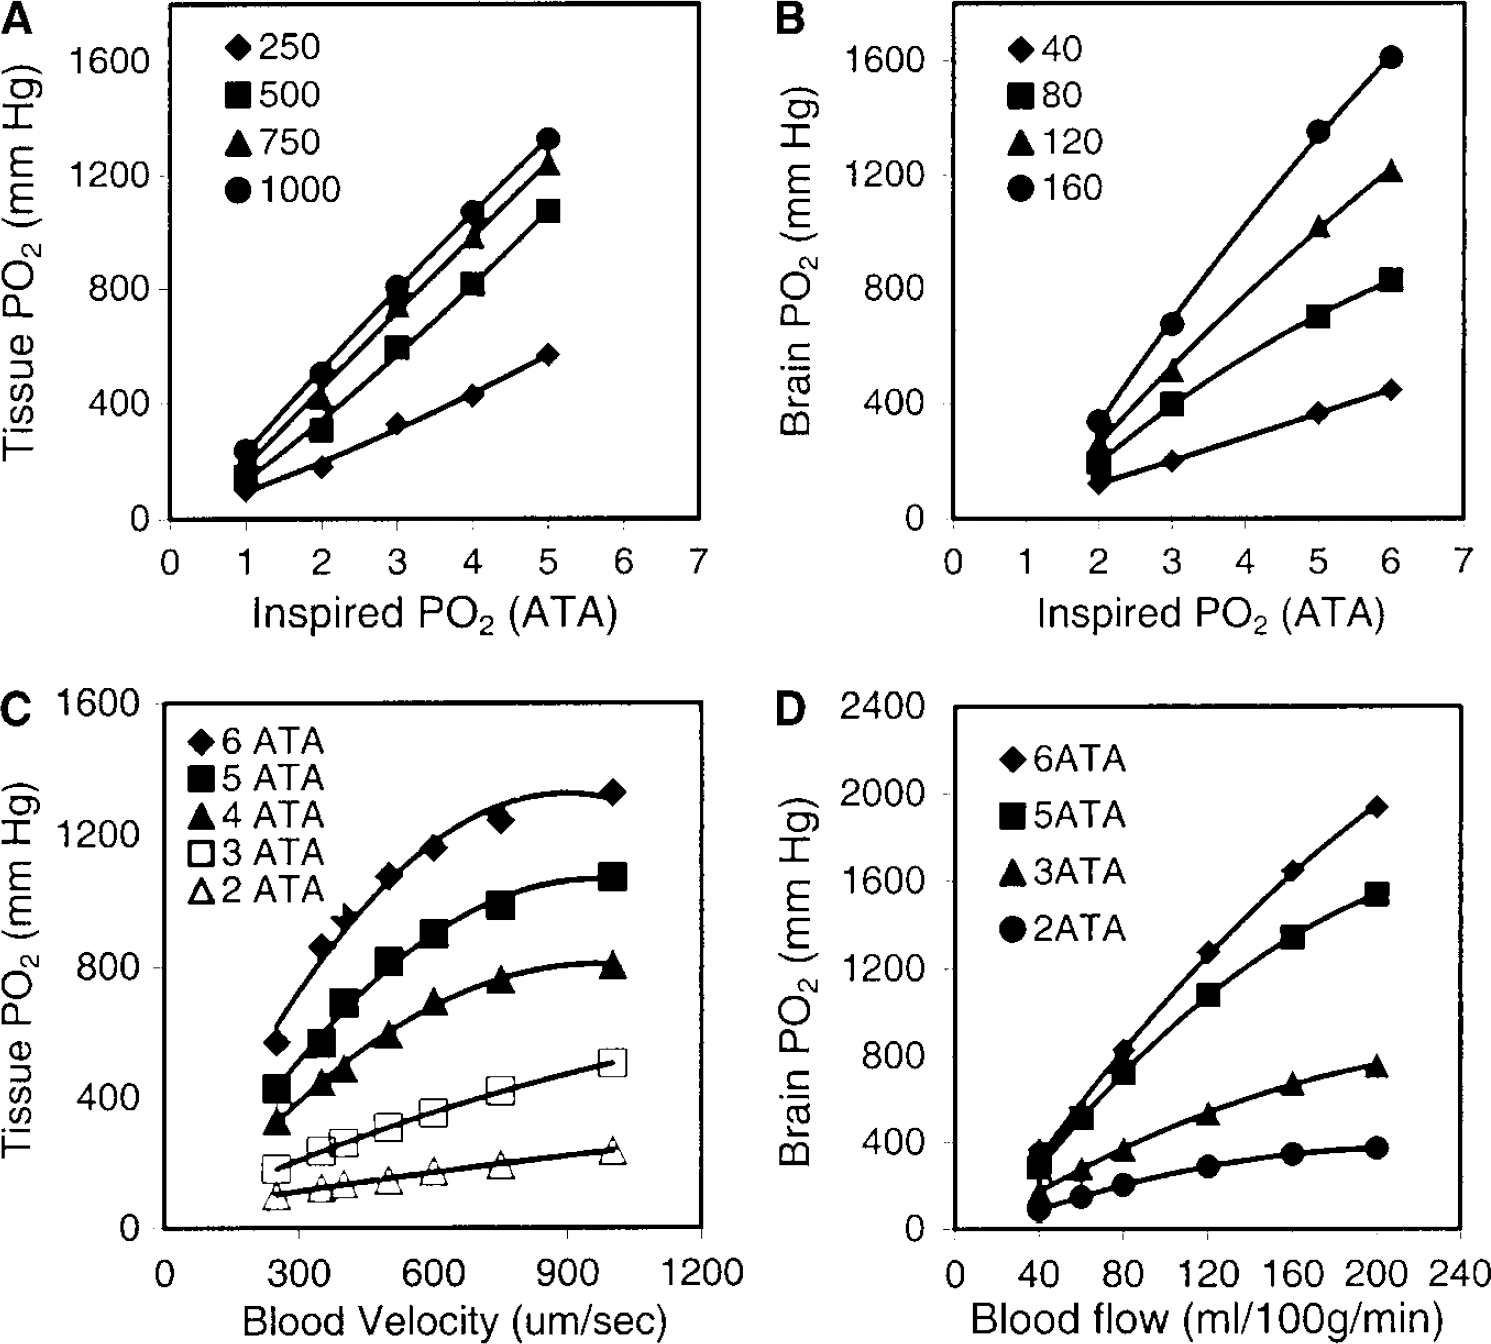
Modeled simulations (
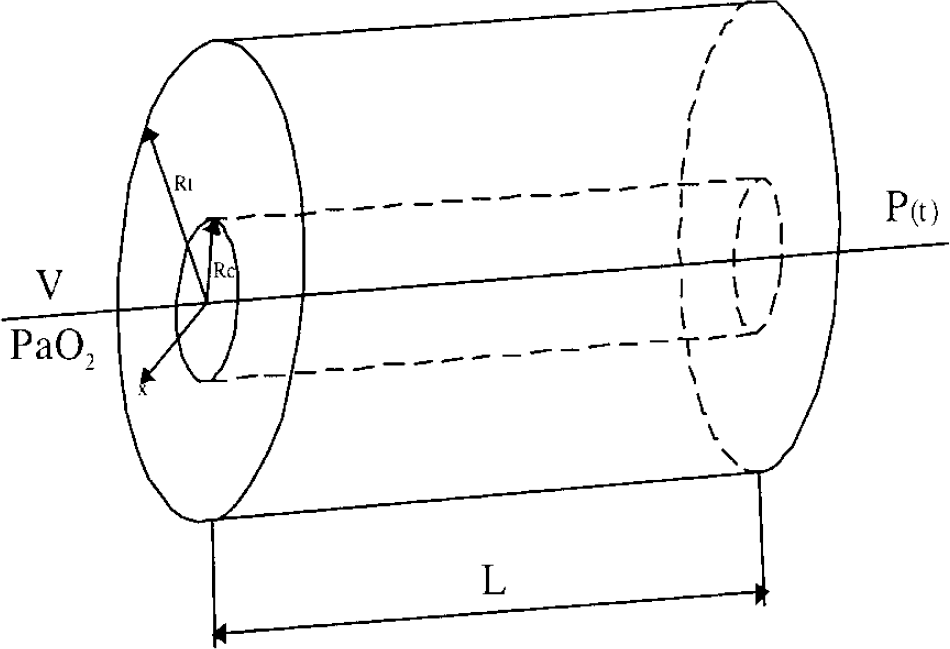
Diagram of a simple capillary/tissue oxygen diffusion model based on Krogh geometry. (See Appendix for explanation.)
Our simulations of BV versus tissue PO2 (Figure 5C) approached linearity for BV from 250 to 800 μm/sec. However, further increases up to 1500 μm/sec caused smaller, nonlinear increases in tissue cylinder PO2. Our experimentally determined CBF—PO2 data fitted to higher order polynomial solutions (Figure 5D) revealed overall similarities to the model. When brain PO2 values, experimentally determined at various values of CBF, were scaled as percent changes, linear approximations showed a CBF/brain PO2 ratio of ~1: 0.9 for HBO2 exposures of 2 to 6 ATA. And modeled BV—PO2 relationships showed overall similarity to the experimental data (not shown).
Discussion
We have quantified CBF—PO2 relationships in HBO2 to a degree not previously achieved. Moreover, by comparing our experimental data to a mathematical model of O2 transport from blood to tissue, the CBF dependence of brain PO2 is accurately predicted when PiO2 exceeds 2 ATA. However, several additional points need to be discussed.
Advantages and Limitations of Cerebral Blood Flow—Oxygen Tension Measurements in the Same Brain Region
Under physiologic conditions, blood flow in the rat brain is distributed heterogeneously and may differ in adjacent microregions (Leniger-Follert and Lübbers, 1976; Kuschinsky and Paulson, 1992; Iadecola et al, 1994). Because CBF affects both O2 delivery and brain tissue oxygenation, quantitative CBF—PO2 relationships must be based on the absolute values of these parameters in the same brain region. For this reason, we selected electrochemistry—which permits highly localized measurements—to record regional blood flow and brain PO2 using paired microelectrodes inserted together in close proximity.
We chose the striatum for our study because our previous work showed that its vascular responses to HBO2 are pronounced and because it is vulnerable to HBO. Electrophysiologic studies by others confirm that bioelectrical abnormalities take place in the striatum and then spread to reticular and cortical regions (Rucci et al, 1967). And morphologic studies have shown that cortical areas are not affected by the neuronal necrosis found mainly in striatum and subcortical structures of post-HBO convulsed brains (Balentine, 1982). In addition, electrode measurements can be made more precisely in striatum because it is a relatively large structure.
For O2 polarography, Baumgartl et al (1974, 2002) and Lübbers et al (1994) reported that 90% of the O2 signal is produced in a tissue volume whose radius is 6.3 times that of the electrode. Because diffusion coefficients and solubility for O2 and H2 are so similar (Young, 1980), this can also be applied to the hydrogen electrode. Our electrodes sample from calculated tissue volumes of 0.58 mm3. The common tissue volume sampled by the O2 and H2 electrode pair is about 0.41 mm3 (see Figure 1). From data of Laursen and Diemer (1980), we calculate that the striatum contains about 2,500 microvessels/mm3. Therefore, our electrodes measure CBF and PO2 in a region containing ~1,000 microvessels. We confirmed that CBF and PO2 are recorded from the same brain region in initial experiments in which both Pt electrodes in one hemisphere recorded only PO2 or only CBF (Figures 1C and Figure 1B).
In the PO2 distributions around microvessels found by others using polarographic microelectrodes (typically <25 μm in diameter), values near zero coexist with those near that of arterial blood (Feng et al, 1988; Lübbers et al, 1994; Erecinska and Silver, 2001). Our 100 μm diameter electrodes however, with conical sensing surfaces of about 0.9 mm2, integrate PO2 measurements from all sites in a tissue volume of 0.58 mm3. Therefore, in rats ventilated with 30% O2 we found a tighter range of basal PO2 (29 to 38 mm Hg).
Control rCBF and rCBF measured after
Temporal Profile of Cerebral Blood Flow and Oxygen Tension During Hyperbaric Oxygen
Absolute CBF and brain PO2 have been recorded in HBO2 in only a few studies because of the technical difficulties involved. Data from various animal species show that brain PO2 increases similarly with blood oxygen content at sea level, but show marked variations during HBO2 exposure, even under the same conditions. For example, Jamieson and Van Den Brenk (1962) report average cortical PO2 values in anesthetized rats of 452, 917, and 1293 mm Hg in HBO2 at 3, 5, and 6 ATA, respectively. However, other authors have published mean values in rat striatum of 253 to 480 mm Hg (maximums were 490 to 1,010 mm Hg) during 60-mins HBO2 at 5 ATA (Hunt et al, 1978). Individual cortical PO2 measurements as high as ~2,000 mm Hg have been described in anesthetized rats at 2.8 ATA (Thom et al, 2002).
Reasons for these discrepancies have been discussed previously (Dean et al, 2003) and include electrode size and location as well as proximity to blood vessels: near the external vessel wall of precapillary cerebral arterioles, tissue PO2 approaches that of arterial blood (Duling et al, 1979; Ivanov et al, 1999; Vovenko, 1999). But we think the most important source of discrepancies is that PO2 and CBF have not been quantatively measured simultaneously and collocally. Indeed, striatal PO2 in rats we exposed to HBO2 at 3 ATA ranged between 255 and 319 mm Hg when vasoconstriction was observed, but increased by 23% to 62% after AZA-induced increases in CBF.
At 5 ATA, striatal PO2 was 554 mm Hg during oxygen-induced cerebral vasoconstriction at the onset of HBO2; but when CBF returned to control levels, PO2 was 849 mm Hg and then when CBF rose by 81%, PO2 increased to 1,600 mm Hg. By contrast,
Both here and in our previous work (Demchenko et al, 2000b, 2001), simultaneous measurements of rCBF and PO2 in the same brain region in HBO2 show that PO2 follows blood flow in a time-dependent manner. At 3 and 5 ATA, we found that CBF in the striatum fell and remained stable for 75 mins at 3 ATA, and for at least 30 mins at 5 ATA. Cerebral vasoconstriction has been shown using different methods in anesthetized and awake animals after relatively brief periods of HBO2 (Bean et al, 1971; Torbati et al, 1978; Bergo and Tyssebotn, 1992; Demchenko et al, 19982000a). Vasoconstriction presumably protects the brain from excess tissue oxygenation, and is in part related to interruption of NO− release from S-nitrosohemoglobin (Stamler et al, 1997) and to inactivation of NO− by superoxide anion (Demchenko et al, 2000b). Indeed, the temporal profile of CBF responses to HBO2 at 5 ATA are biphasic: striatal blood flow initially decreases but then returns to or rises above control levels. Similar rCBF responses have been found in rats at 5 or 6 ATA by others (Bean et al, 1971; Torbati et al, 1978; Chavko et al, 1998).
Apparent exceptions to hyperoxic vasoconstriction in rats exposed to HBO2 have been observed in laser Doppler measurements of cortical blood flow (Zhang et al, 1995; Sato et al, 2002; Thom et al, 2002). Laser-Doppler probes determine red cell velocity, not blood flow, and these two parameters may not correlate well during vasoconstriction in extreme hyperoxia. And again, the timing of these measurements is important, because initial declines in CBF due to vasoconstriction may be quite brief, whereas secondary increase in CBF above basal levels at 4 ATA or above may be protracted (Demchenko et al, 2000b, 2003).
Contribution of inspired Oxygen Tension and Cerebral Blood Flow to brain Oxygen Tension
When hemoglobin is fully saturated with oxygen and O2 delivery greatly exceeds the cerebral metabolic rate for O2 (CMRO2), only three factors contribute to brain PO2: PaO2 (which with normal lungs approaches PiO2), CBF, and changes in cerebral metabolic rate for O2. By assuming constant CMRO2, we obtained data to estimate the importance of the other two factors. Cerebral metabolic rate for O2 is stable at HBO2 pressures of at least 3 ATA (Clark and Thom, 2003). Although rats exposed to HBO2 at 5 ATA show elevations in cerebral metabolic rate for glucose (CMRgl), a correlate of CMRO2 (Torbati et al, 1982), this reaches statistical significance only in the immediate preconvulsive period (Torbati and Lambertsen, 1983). To alter CBF, we used the well-known vasoactive NOS inhibitor
We estimated the effect of inspired O2 on brain oxygenation by comparing striatal PO2 in rats at different HBO2 pressures but at a constant rCBF of 80 mL/100 g min, because resting CBF values measured in different groups of rats were in the range of 76–83 mL/100 g min in this and other studies (Ohata et al, 1981; Fellows and Boutelle, 1993; Lowry et al, 1997; Demchenko et al, 2000b). At this rCBF, using the regression equations of Figure 4, we calculated striatum PO2 values of 357, 694, and 831 mm Hg in HBO2 at 3, 5, and 6 ATA, respectively, yielding ratios of inspired PO2 to brain PO2 of 6.3, 5.5, and 5.5.
To compute the ratio of arterial to brain PO2, we need accurate measurements of arterial PO2 in rats. In this and our previous studies, arterial PO2 in rats ventilated with 100% O2 at 1 ATA were in the range of 420 to 510 mm Hg (Demchenko et al, 2000b). Preliminary data for this study found PaO2 values up to 1497±75 mm Hg in HBO2 at 3 ATA (unpublished data). Actual arterial PO2 in rats exposed to more than 3 ATA apparently has not been determined, but anesthetized cats ventilated with oxygen at 1, 2, 3, 4, 5, and 6 ATA had average PaO2 values of 421, 1,003, 1,561, 2,247, 2,730 and 3,206 mm Hg, respectively (Selivra, 1979). Assuming similar values, ratios of PaO2 to brain PO2 (PaO2/PbO2) are 4.2, 3.6, and 3.9 for HBO2 at 3, 5, and 6 ATA, respectively. Hence, simple calculations suggest that brain PO2 is related to inspired PO2 by a factor of ~6 (with normal lungs) and to arterial PO2 by a factor of ~4. These factors allow estimation of brain PO2 at various levels of HBO2, within the constraints of the CBF response, which shows individual variability in HBO2 and is affected by injury and disease. However, the fact that we consistently observed these ratios is intriguing and suggests an interesting new avenue of research.
Again using the regression equations of Figure 4, we found that decreasing CBF by 50%, in steady-state HBO at 3, 5, or 6 ATA, decreases brain PO2 by 43%, 46%, and 42%, respectively. And increasing CBF by 100% elevates brain PO2 by 88%, 94%, and 98%, respectively. Thus, under these conditions, brain PO2 is almost directly proportional to CBF.
How Does Cerebral Blood Flow Elevate Brain Oxygen Tension in Hyperbaric Oxygen?
Hyperbaric oxygen raises brain PO2 by increasing the volume of oxygenated tissue around small vessels, establishing a steeper O2 diffusion gradient between blood and tissue. But how an increase in CBF brings this about is unclear. We modeled CBF-dependent brain tissue oxygenation in HBO2 using a Krogh-cylinder model (see Appendix), which reflects general rather than specific morphologic features, but allows examination of the effects of both radial diffusion and convective flux of plasma oxygen on tissue oxygen distribution (see review by Popel, 1989). Theoretical work with this model shows that the oxygen pressure field surrounding the tissue cylinder within which local PO2 varies under hyperbaric conditions depends on both input PO2 and BV, but in different ways. When input PO2 is raised, tissue cylinder PO2 increases mainly at the arterial end of the capillary, whereas increases in velocity lead to increases in PO2 at the venous end. However, physiologic conditions that increase CBF may also elevate PO2 at the capillary entrance, which during 100% oxygen breathing is lower than in the aorta due to precapillary loss of oxygen because the walls of precapillary arterioles are gas permeable (Duling et al, 1979; Ivanov et al, 1999; Vovenko, 1999) and because of countercurrent diffusive shunting between arterioles and venules (Popel, 1989).
Our modeling calculations also show nonlinear BV—PO2 relationships for blood velocities over 800 μm/sec. Our in vivo studies also show nonlinear CBF—PO2 relationships when striatal CBF is increased more than 100% in HBO2 (Figure 5). There are at least two reasons for nonlinearity: the high blood velocity shown in the model decreases time for oxygen diffusion during capillary transit; and increases in CMRO2 during preconvulsive neuronal activation, which despite concomitant increases in CBF, might increase O2 extraction as suggested by Buxton and Frank (1997) and other (Mintun et al, 2001). We do not exclude the latter possibility, but the ratio of brain O2 delivery to CMRO2 at 5 and 6 ATA is high and any falloff in striatal PO2 by preconvulsive activation should be small.
In summary, these studies indicate that brain oxygenation in HBO2 is equally affected by inspired oxygen pressure and CBF. The ratio of PiO2 to brain PO2 is approximately 6:1 under normal physiologic conditions and does not change at constant CBF during HBO2 in the range of 3 to 6 ATA. Our results also indicate that patterns of tissue PO2 response are greatly affected by local alterations in CBF under HBO2, and that PO2 directly tracks CBF when hemoglobin is fully saturated. If brain PO2 needs to be raised to a specific level, this will be best achieved by combining HBO2 with agents that counteract O2 vasoconstriction.
Footnotes
Acknowledgements
The authors are also grateful to Albert Boso and Craig Marshall for excellent technical assistance.
Appendix A
The Krogh-cylinder model (Figure 6) assumes a central capillary surrounded by a homogeneously respiring tissue cylinder. Oxygen diffuses radially outwards from capillary plasma, and its content in the blood decreases linearly from the arterial to the venous end of the capillary, provided: (a) hemoglobin is 100% saturated; (b) PO2 distribution in the tissue cylinder is symmetrical about its axis, (c) tissue oxygen consumption is homogeneous and constant, and (d) the solubility coefficient for oxygen is constant.
Given these conditions, the radial distribution of tissue PO2 in terms of capillary and tissue cylinder radii is expressed by the Krogh—Erlang equation
where U (x, y) is the PO2 in the point x, y located on the radius of tissue cylinder; P(y) is the PO2 in the point y on the capillary wall; Rc and Rt are the radii of the capillary and tissue cylinder, respectively, and equal to 3 and 30 μm according to Grunewald and Sowa (1977); D and α are the diffusion and solubility coefficients for O2, respectively, and equal 1.7 × 10⁻⁵ cm2/sec and 3 × 10⁻⁵ mLO2/g mm Hg (Kreuzer, 1982); and m is an O2 consumption of 1 × 10⁻³ mLO2/g sec (Gleichmann et al, 1962; Thews, 1968).
Equation (A.1) defines PO2 at any point of the tissue cylinder from Rc to Rt, if PO2 on any point of the capillary wall is known. To find the capillary wall PO2, the following equation (A.2) was used:
Here Po is the blood PO2 at the arterial end of capillary, L is the capillary length of 1,000 mm (Ma et al, 1974; Seylaz et al, 1999), V is the blood velocity. By combining equations (A.1) and (A.2) it is possible to compute a PO2 value for any point of the tissue cylinder:
But to compare experimental and modeling data, the average PO2 in the tissue cylinder must be determined. For this, in equation (A.3), U was integrated for radius, angle and length (x, L, Ψ) of the tissue cylinder and divided by the square of cylinder cross-sectional area and length of the cylinder: