
Abstract
The authors evaluated representations of discretely activated, neighboring brain regions using real-time optical intrinsic signals by transcranial imaging with 540-nm and 610-nm broadband illumination of the mouse barrel cortex. Iron filings were glued to two neighboring whiskers (C2 + D2) that were stimulated magnetically, singly and together. Real-time images were collected, averaged, and analyzed statistically. Postmortem filling of arteries with fluorescent beads was shown in relation to histochemical staining of barrels to accurately relate surface changes to functional cortical columns. Significant optical intrinsic signal changes are related to overlapping distributions of arterioles that feed the two separate areas. Activation of adjacent and interacting cortical columns leads not only to increased magnitude of vascular responses in those columns, but also to wider spatial extent of absorption changes occurring principally in areas of cortex fed by vessels upstream of the active cortex. The localization of changing hemoglobin absorption around upstream blood vessels and their vascular domains suggests that propagated vasodilation of upstream parent vessels is greater when vasodilatory signals from separate areas of active cortex converge on common arterioles that feed them.
Neural activity can be inferred from vascular responses resulting from various stimuli (Raichle, 1994). Local perfusion and vessel related signals are the bases for three methods used to assess neural activity: O15 positron emission tomography (Raichle, 1983), functional magnetic resonance imaging (Belliveau et al., 1991), and intrinsic optical signal (IOS) imaging (Grinvald et al., 1986). Positron emission tomography provides direct, three-dimensional measures of local cerebral blood flow, albeit at relatively low spatial and temporal resolution. Because the method of positron emission tomography is based on injected radioactive isotopes, this limits both the number of studies that can be done in a single patient and the ages of subjects that can be studied. In contrast, functional magnetic resonance imaging is non-invasive, and provides measurements related to changes in the oxygenation of hemoglobin associated with evoked changes in flow but does not measure blood flow directly. Fast, high-resolution blood oxygen-level–dependent imaging (Silva et al., 2000) provides a picture of changes in active regions of the brain in humans and other animals at higher spatial and temporal resolutions than positron emission tomography. Technically, there is virtually no limit to the number of studies that can be performed in persons of any age.
Intrinsic optical signal imaging is invasive because direct observation of the brain is required. At visible wavelengths, the observations are necessarily confined to accessible areas of the brain close to the surface. When measured in the 540-nm (green) wavelength range, IOS detects changes in hemoglobin absorption by erythrocytes in pial vessels and parenchymal capillaries. When measured in the 610-nm (red) wavelength range, IOS detects changes in hemoglobin oxygenation in erythrocytes (Mayhew et al., 2000). Because of the resolution, speed, and sensitivity with which photons can be detected, IOS provides images of active tissues at temporal and spatial resolutions sufficient to follow evoked changes closely (Grinvald et al., 1986). Observations at different time points are limited to experimental animals.
Malonek and Grinvald (1996) characterized the spatial precision and dynamics of blood oxygenation signals with optical imaging spectroscopy. They found that erythrocyte hemoglobin deoxygenation, but not erythrocyte delivery, colocalized to orientation columns in cat V2 (area 18) with stimuli covering the visual field. They concluded that changes in the absorption of green light were blood-flow related, which they likened to “watering the entire garden for the sake of one thirsty flower.” Intraoperative optical imaging with red light (610–620 nm) in humans with independent activation of the tips of three adjacent fingers (Cannestra et al., 1998) showed overlapping representations. Although generally consistent with underlying neurophysiology, IOS is sufficiently different at 540 nm to suggest that the mechanisms of vascular hemoglobin delivery could contribute significantly to changes that do not match known functional representations. We hypothesized that vascular architecture, which has been largely ignored, contributes significantly to apparent mismatches between neural and vascular responses. Accordingly, we investigated vascular and neural activation in functionally discrete but adjacent areas of the cortex separately and together by monitoring the IOS (Dowling et al., 1996; Erinjeri and Woolsey, 2001).
The barrel cortex (Woolsey and Van der Loos, 1970) provides a practical context in which to study the relation between stimulus-evoked activity in focal groups of neurons and resulting vascular responses. A barrel is an anatomical marker in layer IV of the somatosensory cortex for a column of cells activated by a whisker on the contralateral face of the mouse, rat, and many other rodents. Whisker stroking is a simple means by which to alter neural activity in an anatomically identifiable part of the brain. In the mouse, there are five rows of whiskers (A–E), with five to nine whiskers per row (e.g., whisker A1 or E9).
The stereotyped location, size, and shape of barrels (activated by appropriate whiskers) (Simons, 1983, 1985; Woolsey and Wann, 1976) contrasts with the variable vascular trees that feed them (Rovainen et al., 1993). This arrangement permits interpretation of the sources of variation in optical signals. Furthermore, the small size of the mouse brain permits the observation of nearly all of the cortex in a hemisphere (Woolsey, 1967), effective reconstruction of the entire vascular tree feeding the active area, and unique comparisons with responses in larger-scale mammalian systems.
In the present study, we characterize the responses to individual and simultaneous activation of two adjacent mouse whisker barrels in different rows (C2 and D2) with real-time IOS imaging. We describe results for both 540-nm optical signals (light absorption by erythrocytes related to hemoglobin concentration, and resulting from changes in capillary hematocrit levels and pial arterial vasodilation) and 610-nm optical signals (light absorption by erythrocytes related to changes in hemoglobin oxygenation). The findings are consistent with a mechanism of integration of vasodilatory signals by the arteriolar tree.
MATERIALS AND METHODS
Experimental procedures
Real-time optical imaging
Details of the imaging system and analysis are provided elsewhere (Dowling et al., 1996; Erinjeri and Woolsey, 2001). Briefly, illumination was provided by filtered light (520–560 or 600–620 nm) supplied by a 150-W, 21-V EKE light bulb (Opti-Quip, Highland Mills, NY, U.S.A.) powered by a regulated power supply. The voltage was further stabilized by placing 10 0.29-F capacitors in parallel with the power supply. A focusing unit (Edmund Scientific, Tonawanda, NY, U.S.A.) increased the intensity of the incident light. The image of the brain surface through the skull was magnified 0.75 to 3 times with a Nikon SMZ-U dissecting microscope (Nikon Corporation, Melleville, NY, U.S.A.) while focusing on surface vessels and captured with a CCD camera (72S; Hamamatsu Corporation, Bridgewater, NJ, U.S.A.) at 30 Hz. These 640 × 480-pixel images were stored digitally using a real-time capture card (AG-5, Scion Corporation, Frederick, MD, U.S.A.) in a Power Macintosh G3 Computer running the public domain National Institutes of Health Image 1.62 program (developed by Wayne Rasband at the US National Institutes of Health and available at http://rsb.info.nih.gov/nih-image), which we optimized by modifying the source code.
Data analysis
Each of the 10 300-image video clips (total size, 900 megabytes; 640 × 480-pixel grayscale images × 300 images per trial × 10 trials) were analyzed with a “first frame analysis.” The prestimulus background absorption was subtracted from each frame of each 300-image movie. After subtracting the background, all 10 video clips were averaged together to yield one 30-Hz, 10-second, 300-frame optical image sequence per animal from which time courses could be followed for particular regions of interest.
To evaluate the significance of changes in 540-nm absorption at locations on the cortex, a repeated-measures analysis of variance was performed at each of the 307,200 locations measured by the CCD array (640 × 480). From this analysis, the F ratio for the optical time course was generated at each location in the cortex and F-map images were produced based on the statistical question posed. The resulting image represents the likelihood that a time course of an IOS at a location on the surface of the brain exhibited an exponential increase after stimulus onset and a subsequent exponential decay (Fig. 2B).
Using this statistical map, we computed the contiguous region of cortex where changes in optical time-course were unlikely to be random (P < 0.05). The areas of these significantly different regions were used for statistical comparisons of IOS resulting from different stimuli or different illumination. Sizes of regions of interest compared included total areas of change, overlapping areas of change with different stimuli, and areas of change upstream to the activated barrel. The upstream area was defined by drawing a line through the center of the activated barrel perpendicular to the principal axis of the vessels feeding that barrel.
Histology
After imaging, the mice were deeply anesthetized and perfused transcardially with heparinized saline, followed by 4% paraformaldehyde in 0.1 mol/L phosphate buffer, followed by 0.1 mol/L phosphate buffer. A mixture of 0.5% 10 μm green fluorescent beads (Duke Scientific, Palo Alto, CA, U.S.A.) to lodge in arterioles and 0.5% TRITC-dextran (Molecular Probes, Eugene, OR, U.S.A.) in 1.5% gelatin to fill arteries, capillaries and veins was then perfused and the animals were placed on ice for 30 minutes (Hedenstierna et al., 2000). The brains were removed and immersed in 4% paraformaldehyde in 0.1 mol/L phosphate buffer for 3 to 7 days at 4°C. Tangential, 150-μm serial sections were cut on a freezing microtome, reacted for cytochrome oxidase activity (Wong-Riley, 1979; Wong-Riley and Welt, 1980) and wet-mounted using Vectashield mountant (Vector Laboratories, Burlingame, CA, U.S.A.). Surface sections with pial arterioles and deeper sections with parenchymal arterioles were captured digitally at two times using a CCD camera attached to a Nikon Labophot microscope (Boyce Scientific, Gray Summit, MO, U.S.A.). The surface sections were aligned to the in vivo image from imaging with Adobe Illustrator 9.0 (Adobe Systems, San Jose, CA, U.S.A.) by translation, rotation, and scaling. The deeper sections in which the cytochrome oxidase-positive barrels were identified and drawn were then added to the overlay using the parenchymal vessels as fiducials. Therefore, the digital overlay represents an alignment of pial vessels, parenchymal arterioles, barrels, and optical-image time courses.
RESULTS
Magnitude of optical changes
To determine the effect of simultaneous activation of neighboring areas of cortex on the strength of evoked vascular response in those regions, the C2 and D2 whiskers were stroked individually and together while 540-nm optical signals from the contralateral hemisphere were recorded (Fig. 1). During single-whisker stimulation, 540-nm absorption increased over the activated whisker barrel in each animal (Figs. 1C and 1D). Peak responses were in surface arterioles feeding the stimulated whisker's barrel column. When both whiskers were stroked together, the magnitude of increase in 540-nm optical changes over both barrels was greater than that evoked by either whisker alone during the last second of stimulus (Figs. 1E and 2A). In addition to local responses, multiwhisker stimulation evoked increases in 540-nm absorption in surface vessels up to 500 μm from the active area. In contrast, 610-nm optical signals had peak magnitudes centered over the two stroked whisker barrels and were not related to the pattern of surface arterioles (Fig. 1F); 610-nm optical signals often changed in veins draining the active region and the cortex around it.
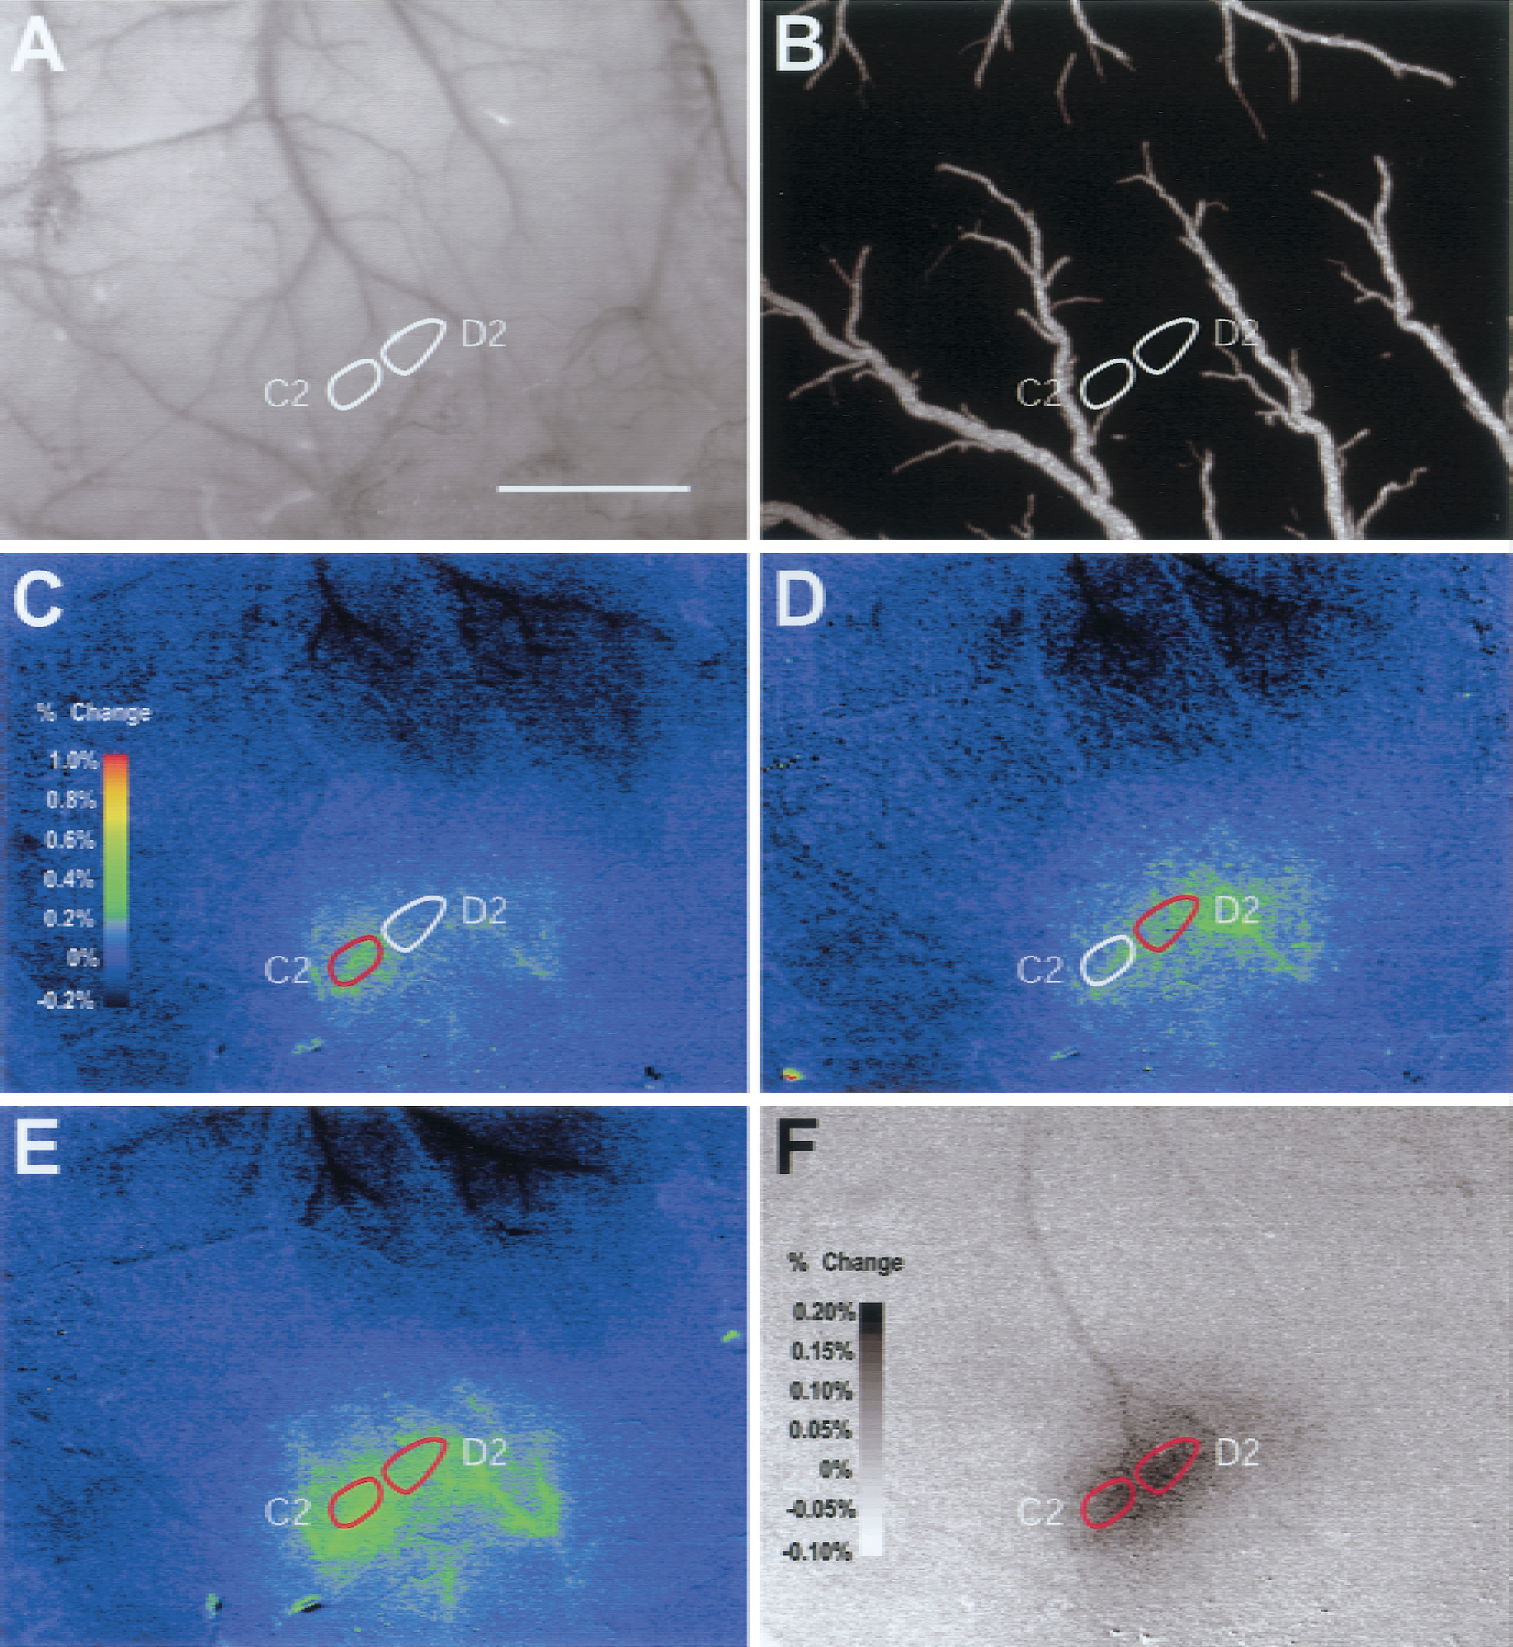
C2/D2 whisker stimulation: intrinsic optical signal (IOS) localization.
Timing of optical changes
To test how simultaneous activation of neighboring areas of the cortex influenced the timing of evoked vascular changes, the time courses of 540-nm optical changes were measured over the C2 and D2 whisker barrels before, during, and after 3 seconds of C2, D2, or C2 and D2 whisker stimulation (Fig. 2B). The same initial rate (slope) of IOS change throughout the first second of stimulation was found for all three conditions. With stimulation of C2 or D2 alone, the rate slowed between the second and third seconds of stimulation. However, stimulation of C2 and D2 together resulted in a change prolonged throughout the stimulus period close to the initial rate. The IOS change for all three stimuli peaked approximately 500 milliseconds after the stimulus and the rates of decrease for all three curves were similar. As the magnitude of change with C2 and D2 stimulation was higher than the individual cases, the time to baseline was slightly longer.
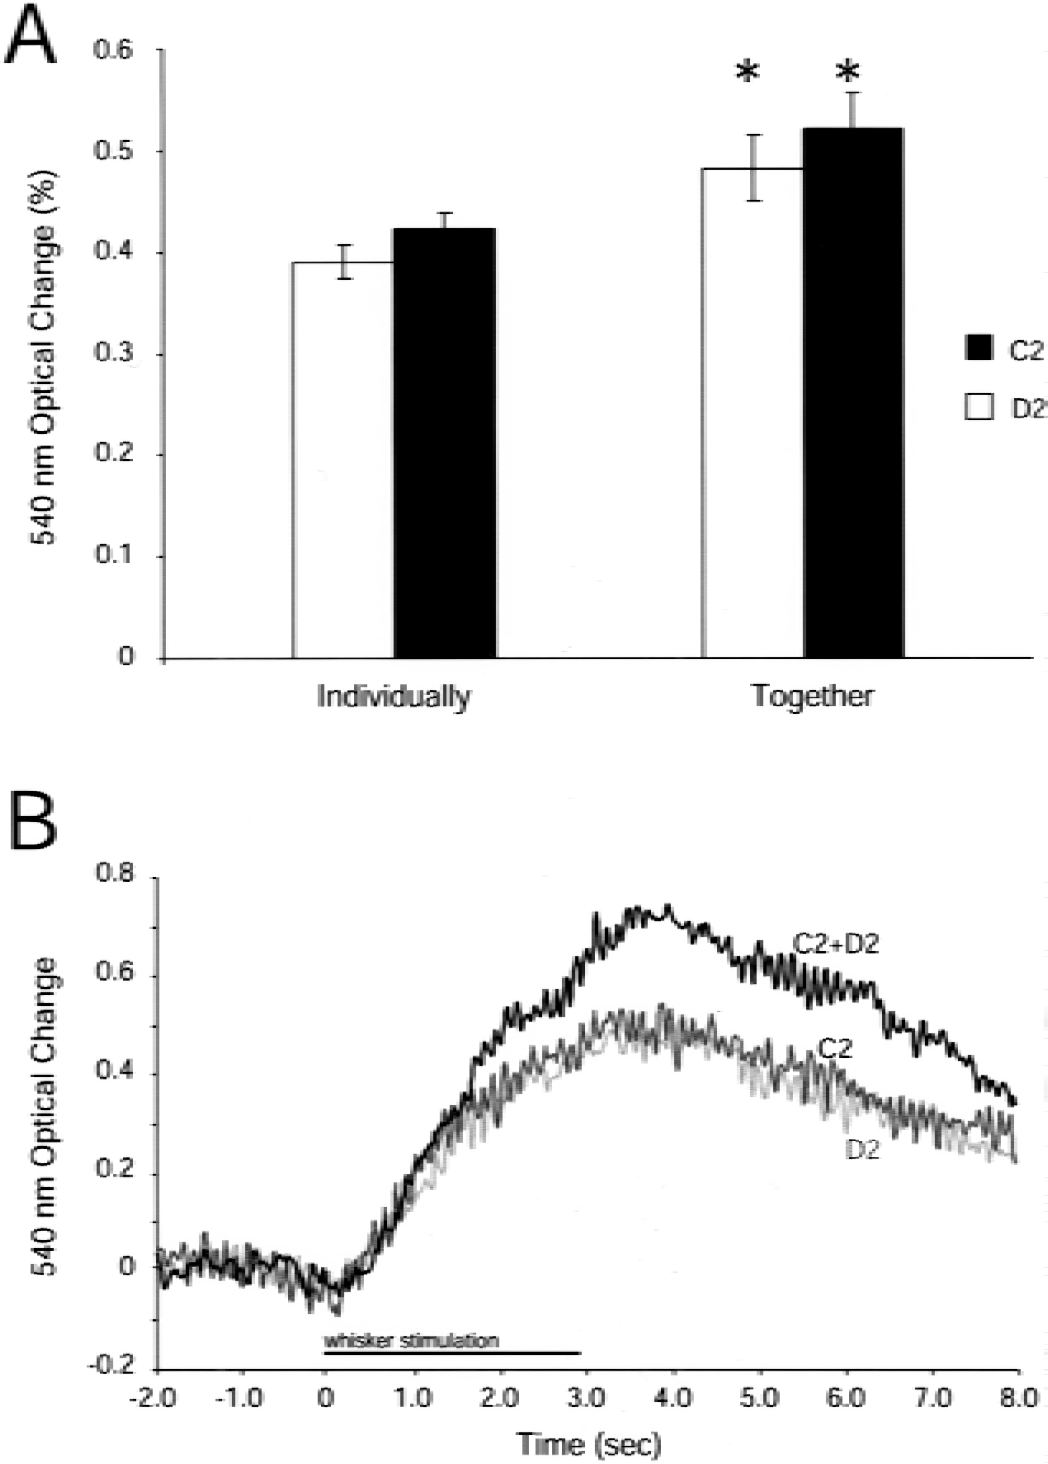
C2/D2 whisker stimulation: magnitude and timing of the 540-nm intrinsic optical signal (IOS).
Spatial extent of optical changes
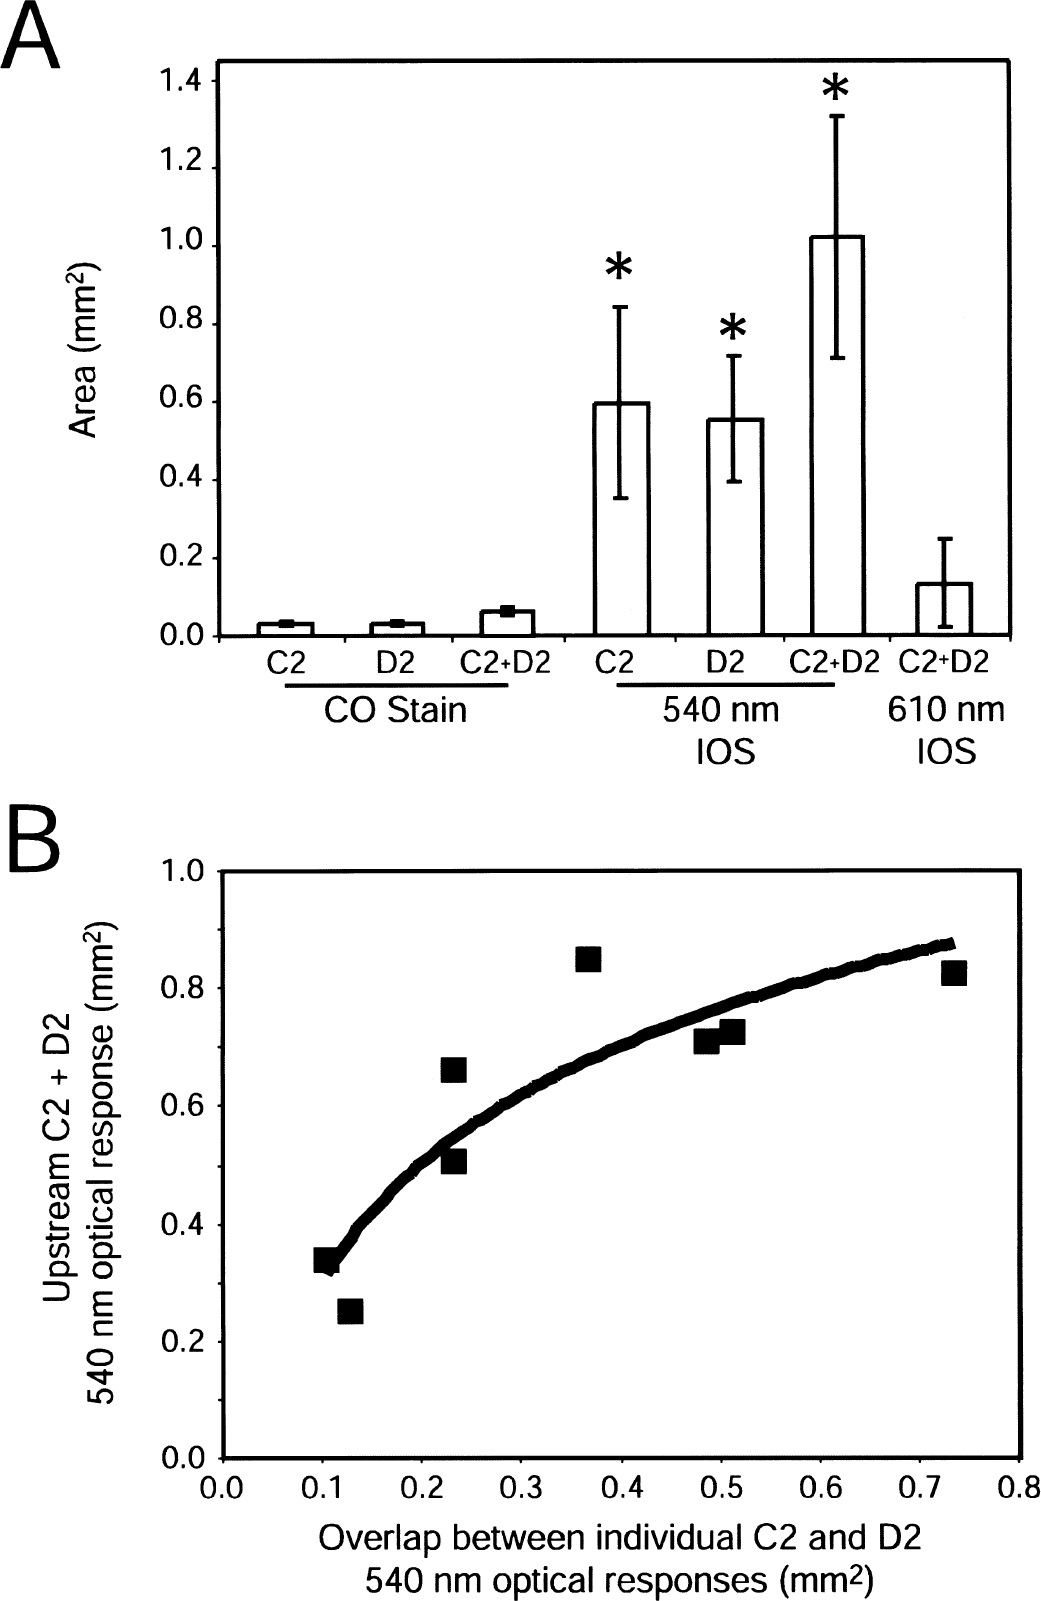
To test the hypothesis that vascular responses to combinations of stimuli are the spatial combination of vascular responses to individual stimuli, the region of significant (P < 0.05) 540-nm optical change was determined while stimulating the C2 or D2 whiskers or the C2 and D2 whiskers for 3 seconds (Fig. 3). Individual C2 and D2 responses were much larger than the anatomical surface projection of the barrel (Figs. 4A and 4B). Response regions always contained the anatomical region of the stroked whisker barrel, but were not always centered on or symmetrical about the barrel, with a preference for territories upstream of (more proximal to in an arterial sense) the activated barrel. The size and shape were strongly influenced by the branching pattern of arterioles feeding the active barrel. The region of 540-nm optical changes evoked by stimulation of the C2 whisker barrel and the D2 whisker barrel were not mutually exclusive. In fact, there was considerable overlap, particularly regarding arterioles feeding both barrels.
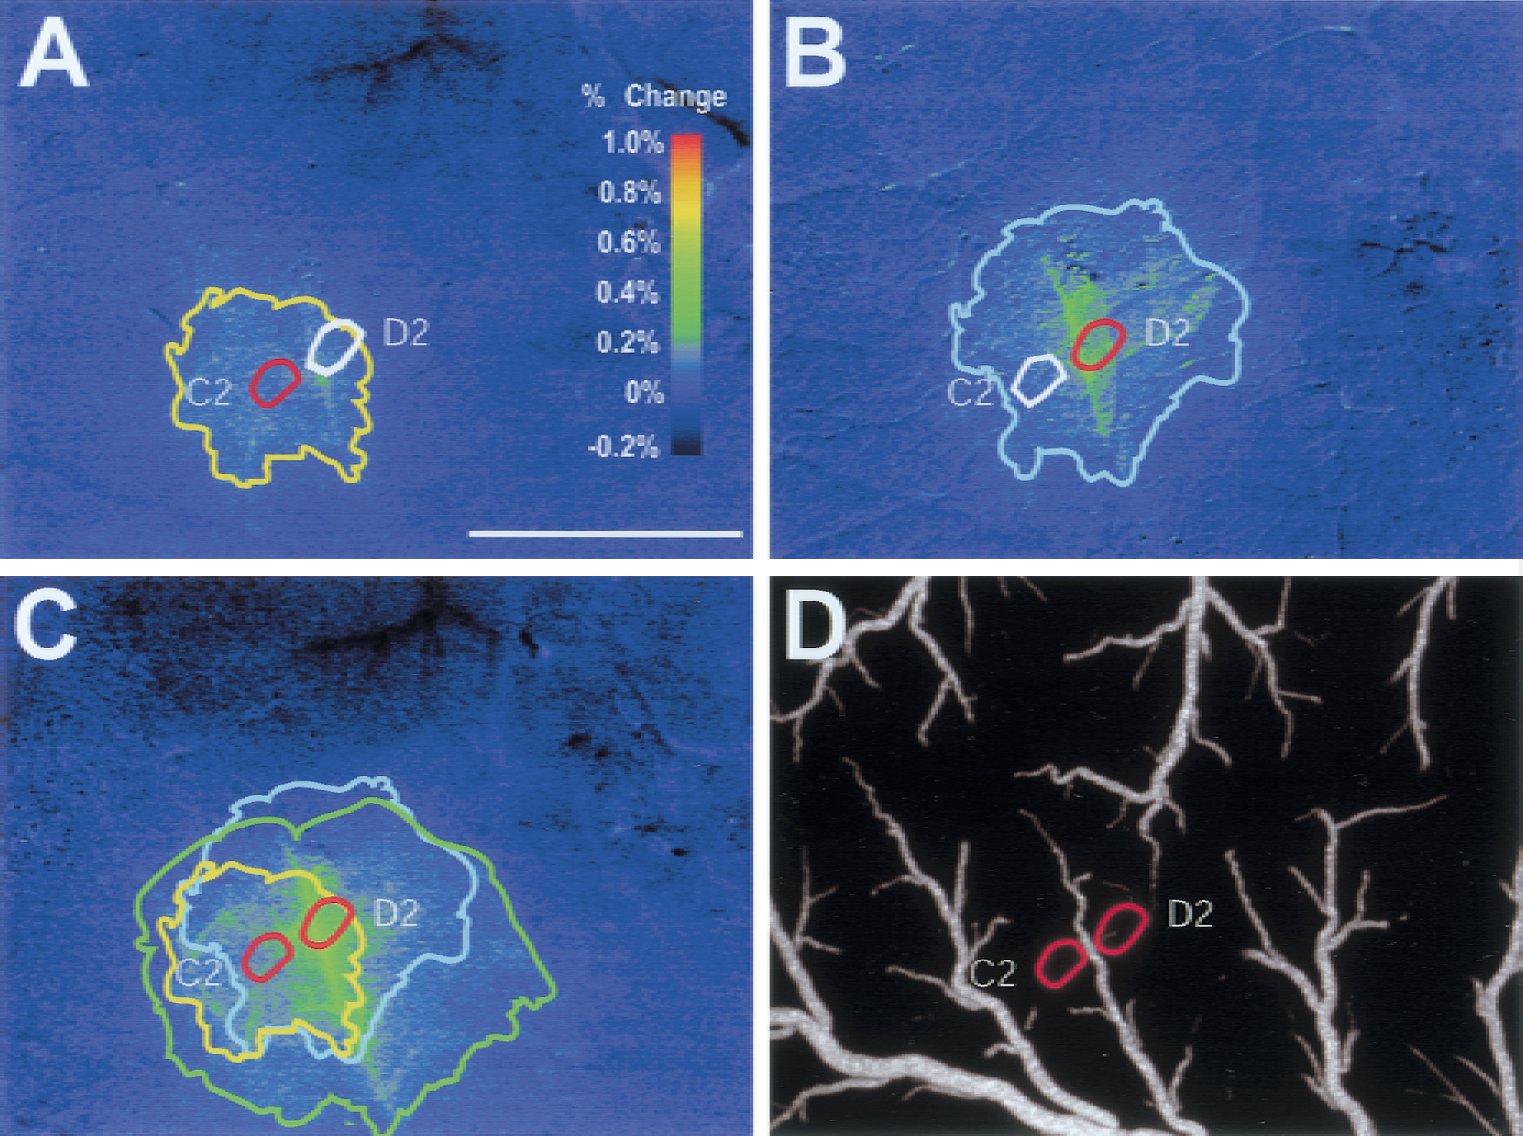
C2/D2 whisker stimulation: spatial extent of 540-nm responses.
Spatial extent of intrinsic optical signal (IOS).
Stimulation of C2 and D2 together led to 540-nm responses that were more extensive than the combination of the individual D2 and C2 responses (Figs. 3C and 4A). However, this effect was not due to widespread activation of cortex because significant (P < 0.05) 610-nm optical signals (activity-dependent deoxygenation of hemoglobin) were barrel shaped and nearly barrel sized (Figs. 1F and 4A). The augmented 540-nm area was in regions fed by tributaries of upstream parent vessels common to the C2 and D2 barrels. This effect was greater in cases where the degree of overlap between the individual C2 and D2 response was larger (i.e., when C2 and D2 shared a feeding vessels) (Fig. 3D).
DISCUSSION
These experiments show that activation of adjacent and interacting cortical columns leads not only to increased magnitude of vascular responses in those columns, but also to increased spatial extent of absorption changes occurring principally upstream of the active cortex. The rate (slope) of IOS change with complex stimuli (combination of stroking the C2 and D2 whiskers) was not greater than that of simple stimuli (individual stroking of C2 or D2 whiskers). The localization of changing hemoglobin absorption around upstream blood vessels and their vascular domains suggests that propagated vasodilation of upstream parent vessels is greater when vasodilatory signals from separate areas of active cortex converge on common arterioles that feed them.
Iadecola et al. (1997) demonstrated that activation of discrete areas of cerebellar cortex led to both local increases in cerebellar blood flow and delayed vasodilation of blood vessels feeding, but remotely located from, the active area. Both effects were proportional to the intensity of local activity. Here, we demonstrate that propagated vasodilation is augmented through combined activation of the same blood vessel by downstream branches to separate but nearby areas of active cortex. This effect is proportional to the extent of local neural activity. We conclude that blood vessels summate upstream vasodilatory responses to provide increased flow in capillary beds within the active area of the brain.
In the mouse barrel cortex, a barrel column is the group of neurons that fire in response to stroking a particular whisker. Although neurons in barrels (in layer IV) respond principally to one whisker, neurons in supragranular and infragranular layers above and below a barrel column respond to more than one whisker (Bernardo et al., 1990; McCasland and Woolsey, 1988; Simons and Woolsey, 1979). A barrel column can be thought of as a hyperboloid rather than a cylinder: the narrow “waist” of the hyperboloid corresponds to a barrel in layer IV, whereas the superficial and deep portions of a whisker barrel column in the supragranular and infragranular layers are broader. Therefore, paired whisker deflections such as those used in the present experiments lead to firing rates in each of the stroked whisker barrel columns that are higher than that of independently fired rates (Goldreich et al., 1998; McCasland and Woolsey, 1988; Simons and Woolsey, 1979). We found that the rate of onset and offset of 540-nm signals was identical for C2, D2, and C2 plus D2 stimulation. However, when the strength of a stimulus is increased by spatial summation of neural activity, vascular responses are matched to the intensity of the stimulus not by increasing the rate of vascular response, but by increasing the magnitude. In contrast, Blood et al. (1995) found that the frequency of whisker stroking leads to a faster time to peak (i.e., rate) of vascular responses. Brain vessel responses apparently differ depending on whether neural activity is increased as a result of temporal summation (increasing stroking frequency) or as a result of spatial summation (simultaneous activation of neighboring areas). To meet energy needs, the rate of adenosine triphosphate hydrolysis should be greater in the former, whereas its spatial extent should be wider in the latter (e.g., Yarowsky et al., 1983).
Our results suggest that during simple stimuli (single whisker stimulation), maps of neural activity are related to maps of vascular responses through a transformation that depends on the pattern of the vascular tree. For stimulation of multiple whiskers, the transformation of maps of neural activity into maps of vascular responses is dominated by temporospatial integration of vasodilatory signals in the vascular tree. Local activity in cortex produces resistance decreasing vasodilatory signals (Iadecola, 1993), which hyperpolarize the membranes of vascular endothelium and smooth muscle (Knot et al., 1996; McGahren et al., 1998; Tyml et al., 1997). Vasodilatory signals are propagated electrotonically through the vasculature by gap junctions along arterioles via the cellular path of least resistance (Little et al., 1995a,b), namely, upstream feeding vessels. By this mechanism, spatially distinct neural activations can have overlapping areas of vascular response when the same upstream arterioles are dilated. In the case where shared arterioles are simultaneously signaled by activation of separate but nearby neural ensembles, these common arterioles presumably summate vasodilatory signals through increasing hyperpolarization. This summed electrical signal is conducted passively further upstream through the vessels to provide an appropriate level and spatial extent of blood flow to both neural ensembles; the greater the summation of local responses, the farther the vascular responses extend upstream.
The vascular responses in arterioles less than 100 μm in diameter on the surface of mouse brains are analogous to those responses occurring in comparably sized parenchymal blood vessels in human cortex. Diffusion of oxygen and nutrients are similar regardless of scale. Indeed, the density of precapillary arterioles we observed in the mouse is only twice the density in humans (Duvernoy et al., 1981). Therefore, the present findings indicate that the limit of the precision of the 540-nm signal is the extent to which a single feeding arteriole feeds a single neuronal module. A whisker barrel column in a mouse has approximately 10% of the surface projection of a somatosensory cortical column in the monkey (Powell and Mountcastle, 1959). Several 100-μm arterioles ought to feed a single functional column in humans in contrast to a single arteriole supplying several functional columns in mice. With stimuli activating a single cortical column (e.g., equivalent to a barrel column) as opposed to an entire functional area (i.e., area 18), the more robust 540-nm IOS can provide adequate resolution to map function in larger animals because the number of arterioles per cortical column is five to 10 times greater in humans than in the mouse.
At its core, IOS imaging is digital-subtraction light microscopy, and should in theory only be able to give spatially focused information from superficial layers of cortex, despite that (1) most optical imaging systems are wide-field, low-magnifications systems that have a low numerical aperture and large depth of field of 100 μm or more, and (2) longer-wavelength red light can penetrate deeply through the cortex. Although the idea of imaging deep layers of the cortex by focusing several hundred microns into the cortex is attractive (Ratzlaff and Grinvald, 1991), the brain strongly scatters light within it and will lead to a mixture of some light from deep in cortex combined with blurred surface images. To avoid these limitations, confocal (Dirnagl et al., 1992) or multiphoton (Kleinfeld et al., 1998) strategies may be used. Because this study concentrates on the integration of vascular signals in proximal upstream arterioles evoked by coactivation of neighboring areas of cortex, we focused on surface vessels.
The IOS does not measure cerebral blood flow and, at the capillary level, cerebral blood flow may not be the only determinant of erythrocyte distribution in the brain. In addition to blood flow, hematocrit levels, vessel-tissue oxygen gradients, transit time and path length, and diffusion coefficients determine oxygen release from erythrocytes within a capillary bed (Hudetz, 1997, Hudetz et al., 1996; Mayhew et al., 2000). Path lengths (Boero et al., 1999), oxygen gradients (Moskalenko et al., 1997), transit times (Woolsey et al., 1996), and blood flow (Adachi et al., 1994; Woolsey et al., 1996) have been measured in discrete locations in the barrel cortex related to neural activity evoked by stimulating a single whisker. As the principal oxygen carrier, hemoglobin in erythrocytes reflected in the 540-nm IOS indicate changes in oxygen delivery to meet need. Alternatively, changes in erythrocyte distribution may not indicate a specific need for oxygen, but instead may be a byproduct of mechanisms for increasing flow and erythrocyte delivery to active brain (Ido et al., 2001; Mintun et al., 2001). Spatial integration of signals conducted via vessels could explain the relation between hemoglobin changes and vascular architecture. Therefore, IOS at 540 or 610 nm are functional imaging modalities that are blood-delivery based, but not necessarily blood-flow based (Dunn et al., 2001). We have shown specific flow responses confined to particular whisker and barrel columns (Woolsey et al., 1996). Because barrels provide a template for direct comparison of results with different methods from separate studies, we conclude that blood flow coincides better with the changes seen at 610 nm rather than at 540 nm. Therefore, the 540-nm IOS does not represent flow per se, and hence is not “water for the garden” (Malonek and Grinvald, 1996).
Footnotes
Acknowledgments:
The authors thank Brad Miller and Nicquet Blake for helpful discussions, and Kathy Diekmann for assistance with manuscript preparation.