
Abstract
We defined lesion and structurally normal regions using magnetic resonance imaging at follow-up in patients recovering from head injury. Early metabolic characteristics in these regions of interest (ROIs) were compared with physiology in healthy volunteers. Fourteen patients with severe head injury had positron emission tomography within 72 h, and magnetic resonance imaging at 3 to 18 months after injury. Cerebral blood flow (CBF), oxygen utilization (CMRO2), and oxygen extraction fraction (OEF) were all lower in lesion ROIs, compared with nonlesion and control ROIs (P < 0.001); however, there was substantial overlap in physiology. Control ROIs showed close coupling among CBF, blood volume (CBV), and CMRO2, whereas relationships within lesion and nonlesion ROIs were abnormal. The relationship between CBF and CMRO2 generally remained coupled but the slope was reduced; that for CBF and OEF was variable; whereas that between CBF and CBV was highly variable. There was considerable heterogeneity between and within patients. Although irreversibly damaged tissue is characterized by marked derangements in physiology, a more detailed analysis shows acute changes in physiology and physiologic relationships within regions of the brain that appear structurally normal at follow-up. Such pathophysiological derangements may result in selective neuronal loss and impact on functional outcome.
Keywords
Introduction
Severe traumatic brain injury (TBI) remains a major public health problem with many patients suffering an unfavorable outcome (Menon, 1999). Improved understanding of the pathophysiological consequences of TBI is important for developing and assessing novel neuroprotective strategies, and for predicting the eventual neuropsychological outcome. However, the metabolic processes responsible for secondary neuronal injury are complex and incompletely elucidated.
Although imaging studies have shown evidence of early ischemia after head injury (Coles et al, 2004), we have not been able to identify robust physiologic and metabolic thresholds for tissue survival (Cunningham et al, 2005). One possible explanation for this is that there may be additional mechanisms of tissue hypoxia and energy failure such as metabolic suppression, mitochondrial dysfunction, and microvascular occlusion (Menon et al, 2004; Robertson, 2004; Verweij et al, 2000; Vespa et al, 2005). Such mechanisms are unaccompanied by high oxygen extraction fraction (OEF), but may result in selective neuronal loss rather than pan-necrosis (Stein et al, 2004). Such potential mechanisms may, in part, explain why other studies using similar imaging techniques have found less impressive evidence of ischemia (Diringer et al, 2002; Vespa et al, 2005). Other imaging studies have shown alterations in cerebral physiology, not only within focal lesions identified by structural imaging, but also within remote brain regions (Coles et al, 2004; Vespa et al, 2004). In addition, there is increasing evidence of pathophysiological heterogeneity both between and within patients (Vespa et al, 2004). Although imaging studies showing late reductions in N-acetylaspartate within regions that appear structurally normal are consistent with selective neuronal loss, evidence of early derangements in cerebral physiology within regions of the brain, which ultimately appear structurally normal has not been well characterized.
In this study, we have coregistered acute 15Oxygen positron emission tomography (15O PET), imaging data obtained within 72 h of injury, with follow-up MR imaging data. Our aim was to compare normal physiologic relationships in control subjects to the acute metabolic characteristics of tissue from visible lesions, and that which appears structurally normal at follow-up MR imaging. Further, we aimed to explore if there were differences within and between patients in the metabolic characteristics of this tissue. To investigate regional pathophysiologic heterogeneity, we have explored relationships between the physiologic variables at both a region of interest (ROI) and voxel-based level.
Materials and methods
This retrospective study included 14 patients with severe TBI (admission GCS ≤ 8, or subsequent deterioration in GCS to ≤ 8), who had been admitted to Addenbrooke's Hospital Neurosciences Critical Care Unit. Eligible patients underwent 15O PET within 72 h of injury and had MR imaging at 3 to 18 months after injury, which showed a structural abnormality. The control group comprised 10 healthy volunteers who had undergone PET and magnetic resonance imaging, and for whom technically adequate images were available. Follow-up studies were performed after informed consent was obtained from patients; all volunteers gave informed consent. Assent was obtained from the next of kin for the acute patient studies. All studies were approved by the Local Research Ethics Committee at Addenbrooke's Hospital, and by the Administration of Radioactive Substances Advisory Committee of the United Kingdom. Although data from a number of these patients has been reported and used in earlier studies from our institution, it has not been used in any similar analyses.
Clinical Protocols
Patients were managed with protocol driven therapy aimed at maintaining ICP < 20 mmHg and cerebral perfusion pressure > 60 mm Hg, as described earlier (Coles et al, 2007), and based on international standards for managing patients with head injury (Brain Trauma Foundation; American Association of Neurological Surgeons; Congress of Neurological Surgeons, 2007; Maas et al, 1997). Interventions included sedation (propofol up to 8 mg kg−1h−1 and fentanyl 1 to 2 μg kg−1h−1) and neuromuscular blockade, surgery for space-occupying lesions, drainage of cerebral spinal fluid, volume supplementation, and vasoactive agents (dopamine and/or norepinephrine) for cerebral perfusion pressure augmentation, osmotic diuretics (boluses of 0.5 g/kg of mannitol), and mild hyperventilation (to ~35 mm Hg). Hyperthermia was treated vigorously, and mild hypothermia (~36°C) was commonly used to assist ICP control.
Although hemodynamic stability was ensured during PET studies by titrating fluids and vasoactive agents, sedative infusions were left unchanged. It is important to emphasize that no other material changes in management occurred on the day of the PET study in any of the patients, thus ensuring stable physiology during the acquisition of imaging data.
Imaging Data
15O PET imaging was performed within 72 h of patients' admission to the Neurosciences Critical Care Unit, on a General Electric Advance scanner (GE Medical Systems, Milwaukee, WI, USA). A transmission scan, using two rotating germanium-68 rods, was performed for all patients, and used to correct the emission data for photon attenuation. Emission data were acquired in three-dimensional mode during a 20-min steady state infusion of 800 MBq of H215O, after a 60-sec inhalation of 300 MBq C15O, and in two-dimensional mode during a 20-min steady state inhalation of 7200 MBq of 15O2. Images were reconstructed using PROMIS 3D filtered back projection algorithm, with corrections applied for attenuation, scatter, randoms, and dead time. From radioactivity concentrations in brain and arterial blood, parametric maps of cerebral blood flow (CBF), oxygen utilization (CMRO2), blood volume (CBV), and OEF were calculated as described earlier (Coles et al, 2004). Magnetic resonance imaging studies were performed, on a 3-Tesla Bruker MedSPEC system. Patients were studied at 3 to 18 months after injury. MR data were reconstructed using Bruker Paravision 2 (Bruker Biospin MRI, Germany).
Positron emission tomography images were analyzed using custom designed automated software (PETAN (Smielewski et al, 2002)), which incorporates elements of several software packages, including Matlab 6.0 (MathWorks, Natick, MD, USA), Statistical Parametric Mapping (SPM, Wellcome Department of Cognitive Neurology, London, UK) and Analyze (AnalyzeDirect, Lenexa, KS, USA). All the PET images were individually coregistered with the MR images using vtkCISG software (Computational Imaging Sciences Group, Kings College, London. http://www.image-registration.com), and the coregistered images were spatially smoothed using a 6-mm Gaussian filter. The PET images from patients were coregistered to FLAIR (fluid attenuated inversion recovery) MR data, which provide optimal delineation of structurally abnormal regions. The PET images from the control subjects were coregistered to MR SPGR (spoiled gradient recalled) data.
Region of Interest and Voxel-Based Analyses
Without knowledge of the PET data, we constructed lesion ROIs, nonlesion ROIs, and control ROIs based on MR data. Areas of structural abnormality were identified on follow-up FLAIR imaging. Using the threshold tool in Analyze software these areas were outlined on all relevant slices and considered as one ROI. Where possible, these lesion ROIs were mirrored onto the contralateral hemisphere to produce corresponding nonlesion ROIs. Control ROIs of comparable size and regional location to patient ROIs were produced from control MR data. All ROIs were projected onto the corresponding coregistered PET imaging data (see Figure 1). Values for CBF, CMRO2, OEF, and CBV were determined for each ROI (for ROI-based analyses), and also for the entire population of voxels within each group of ROIs (for voxel-based analyses). To investigate regional inter- and intra-patient differences in pathophysiology, we analyzed relationships between physiologic variables at the voxel-based level. For the voxel-based analyses, for each individual contusion (ROI), we plotted summary curves for the relationships between the physiologic variables.
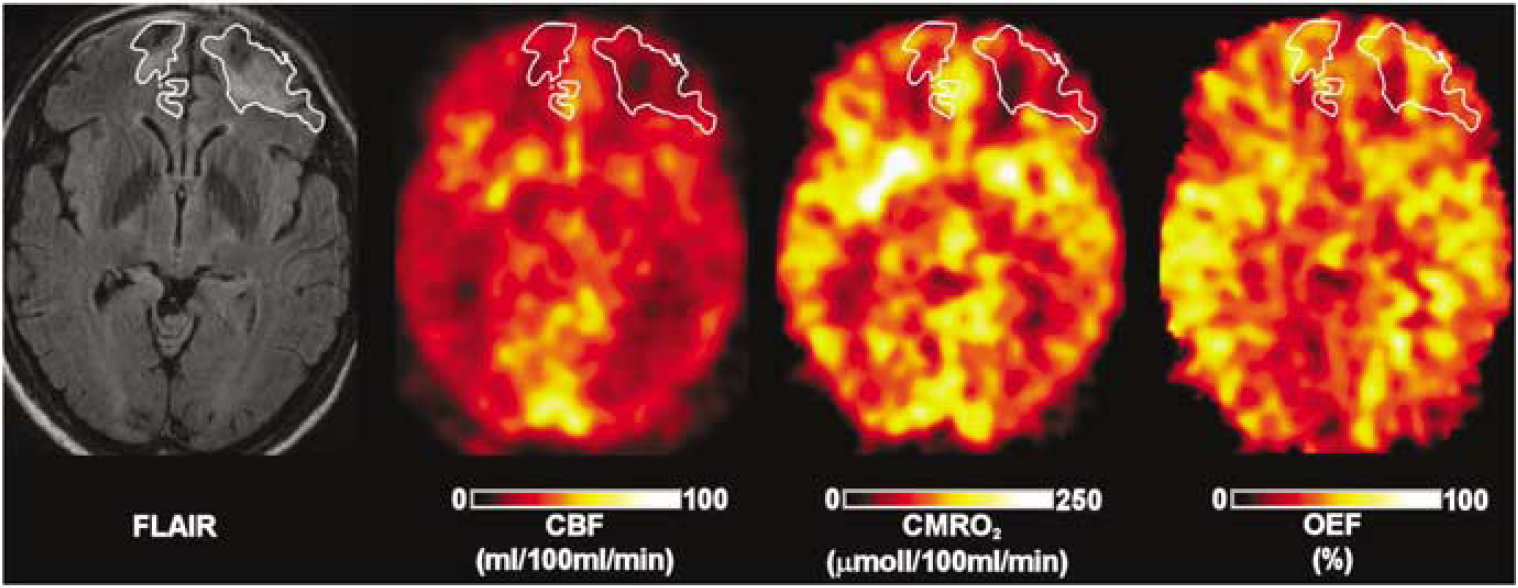
Construction of regions of interest (ROIs). Regions of injury were defined on follow-up fluid attenuation inversion recovery (FLAIR) imaging and applied to the coregistered positron emission tomography cerebral blood flow (CBF), oxygen metabolism (CMRO2), oxygen extraction fraction (OEF), and blood volume data.
Statistical Analysis
Statistical analysis was undertaken using Statview (Version 5, 1998, SAS Institute Inc, Cary, NC, USA). Across each group of ROIs, values for each physiologic variable were averaged to give overall values for lesion, nonlesion, and control ROIs, and compared using Kruskal-Wallis test; if a significant difference was detected post hoc comparisons were performed using Mann-Whitney U test. A P-value < 0.05 was considered statistically significant. To ensure that the lesion ROIs that could be mirrored to produce nonlesion ROIs were representative of the whole group of lesion ROIs, these were compared with lesion ROIs that could not be mirrored. Descriptive statistics are given as median and interquartile range, unless otherwise stated.
The relationships between the PET parameters within the ROI groups were plotted using locally weighted scatterplot smoothing (Lowess) with 66% tension (Cleveland and Devlin, 1988) within each individual ROI using Statview. Lowess is an outlier resistant method based on local polynomial fits (Alian and Rafferty, 2008). In addition, the relationship between CMRO2 and CBF, and between CBF and CBV, for the three groups of ROIs was examined using linear regression, from which we determined the slope (or gradient) of the relationship. We compared the slope between the groups by means of the t-test with unequal variance, and compared the variability of slope within the groups by tests of ratios of variances. For plots that involved CBV, we ignored voxels with CBV values > 15%, to exclude voxels with substantial partial volume contamination by vascular structures.
Results
The demographic and clinical characteristics of the 14 patients are shown in Table 1. The majority of patients were young males (mean age, 29 years; range, 17 to 41 years), whereas controls (9 males and one female; mean age, 45 years; range, 29 to 59 years). Patients had a mean (range) admission Glasgow Coma Score of 8 (4 to 13). The mean (range) time to acute PET imaging was 43 (8 to 72) hours; mean (range) time to follow-up MR imaging was 239 (96 to 575) days.
Clinical and demographic characteristics
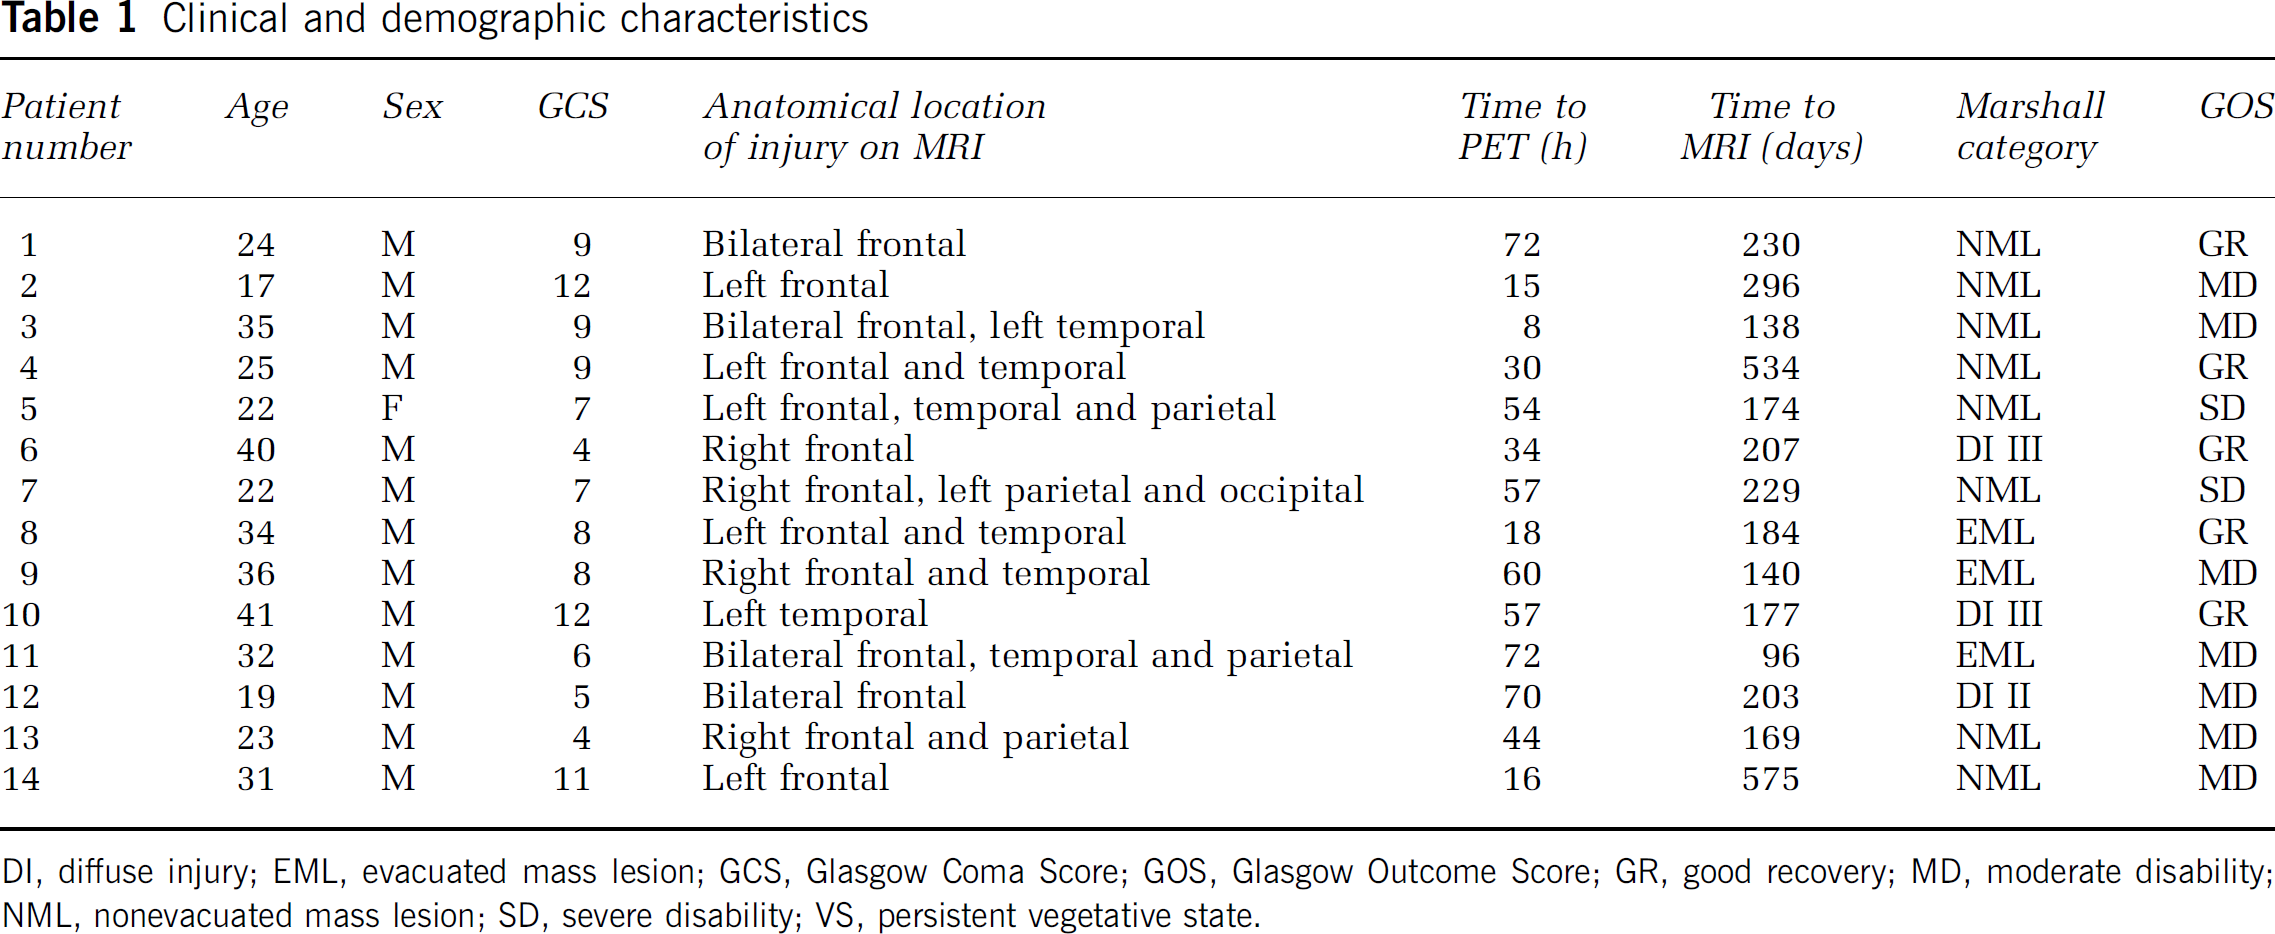
Dl, diffuse injury; EML, evacuated mass lesion; GCS, Glasgow Coma Score; GOS, Glasgow Outcome Score; GR, good recovery; MD, moderate disability; NML, nonevacuated mass lesion; SD, severe disability; VS, persistent vegetative state.
Characteristics of Regions of Interest
Across the 14 eligible patients, a total of 31 lesion ROIs (contusions) were identified. Three patients had one contusion, two had three contusions, one patient had four contusions, and the remainder had two contusions. Three patients had surgery before PET imaging: two patients had removal of hematoma (in these patients, the contusion ROIs represented anatomically distinct lesions that were not surgically evacuated), and one patient had removal of an acute subdural hematoma and contusional tissue (however, this patient still had hyperintense lesion tissue on the follow-up MR imaging and this was used as the lesion ROI). Twenty-one lesion ROIs could be mirrored to the contralateral hemisphere to produce 21 nonlesion ROIs. On the control images, 30 ROIs were constructed in similar regions to the lesion ROIs (predominantly frontal, temporal, and parietal).
Region of Interest-Based Analysis
CBF, CMRO2, CBV, and OEF values for the three groups are summarized in Table 2.
Physiological variables for the regions of interest (ROIs)
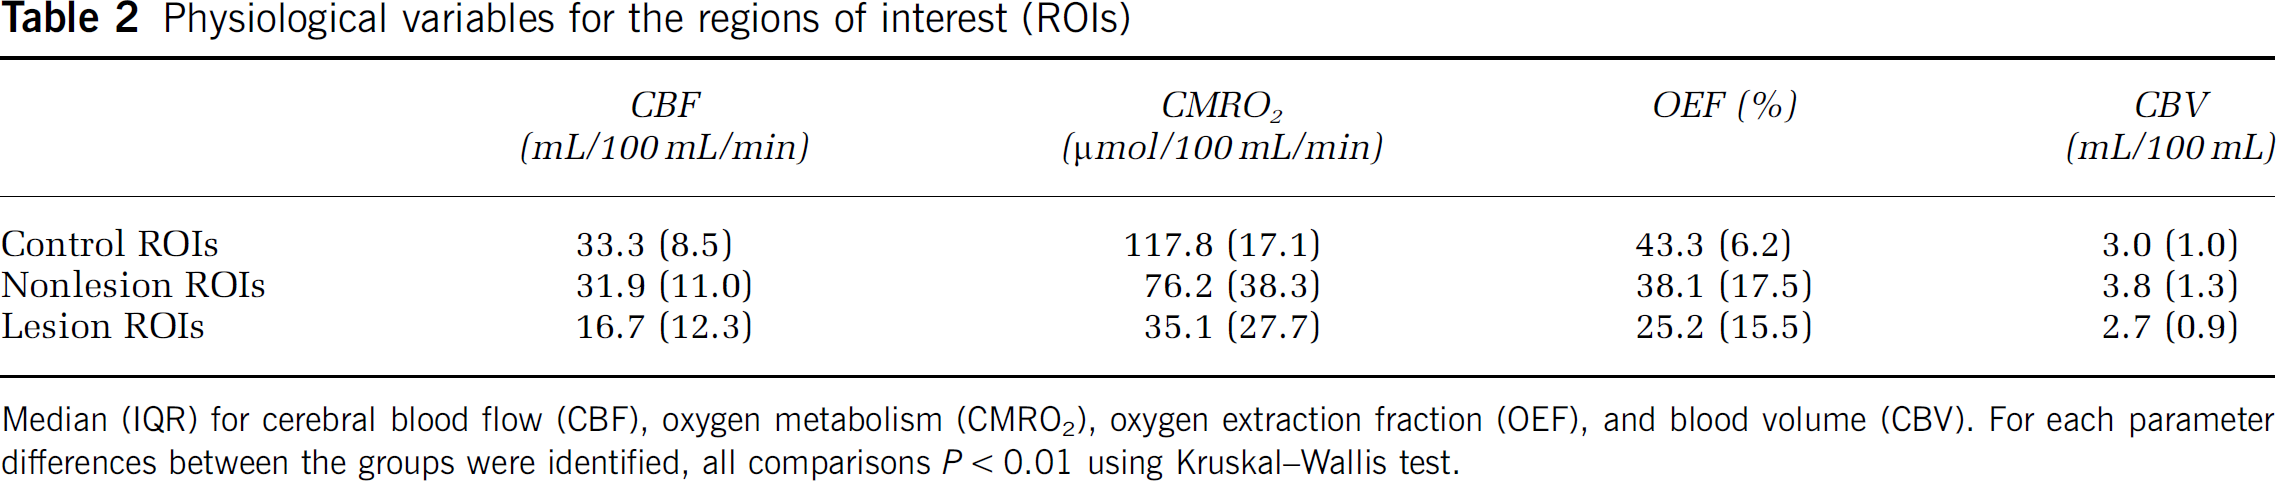
Median (IQR) for cerebral blood flow (CBF), oxygen metabolism (CMRO2), oxygen extraction fraction (OEF), and blood volume (CBV). For each parameter differences between the groups were identified, all comparisons P < 0.01 using Kruskal-Wallis test.
Statistical analysis showed that lesion ROIs had significantly lower CBF, CBV, CMRO2, and OEF values compared with nonlesion ROIs (all P < 0.001 Mann-Whitney U test), and lower CBF, CMRO2, and OEF when compared with control ROIs (all P < 0.0001 Mann-Whitney U test). The CBF and OEF values were not significantly different in nonlesion and control ROIs, whereas CMRO2 was significantly lower (P < 0.001) and CBV higher (P <0.05) in nonlesion compared with control ROIs. The CBV in lesion ROIs was significantly lower than in nonlesion ROIs (P <0.001 Mann-Whitney U test). There was no statistical difference between ‘mirrored' ROIs and ‘nonmirrored’ ROIs.
Voxel-Based Analysis
Comparison of physiologic variables for lesion, nonlesion and control Regions of Interest: Although there was considerable overlap of the distributions for CBF, CMRO2, and OEF for the three groups, the distributions for lesion ROIs were distinctly positively skewed and shifted to the left compared with nonlesion and control ROIs. The distributions for the control and nonlesion ROIs were similar for CBF but showed a shift towards lower CMRO2 and higher OEF values in the patients. There was a substantial degree of overlap between the three ROIs for the CBV distribution. However, the lesion ROIs were shifted to the left, whereas the nonlesion ROIs were shifted to the right of control (Figure 2).
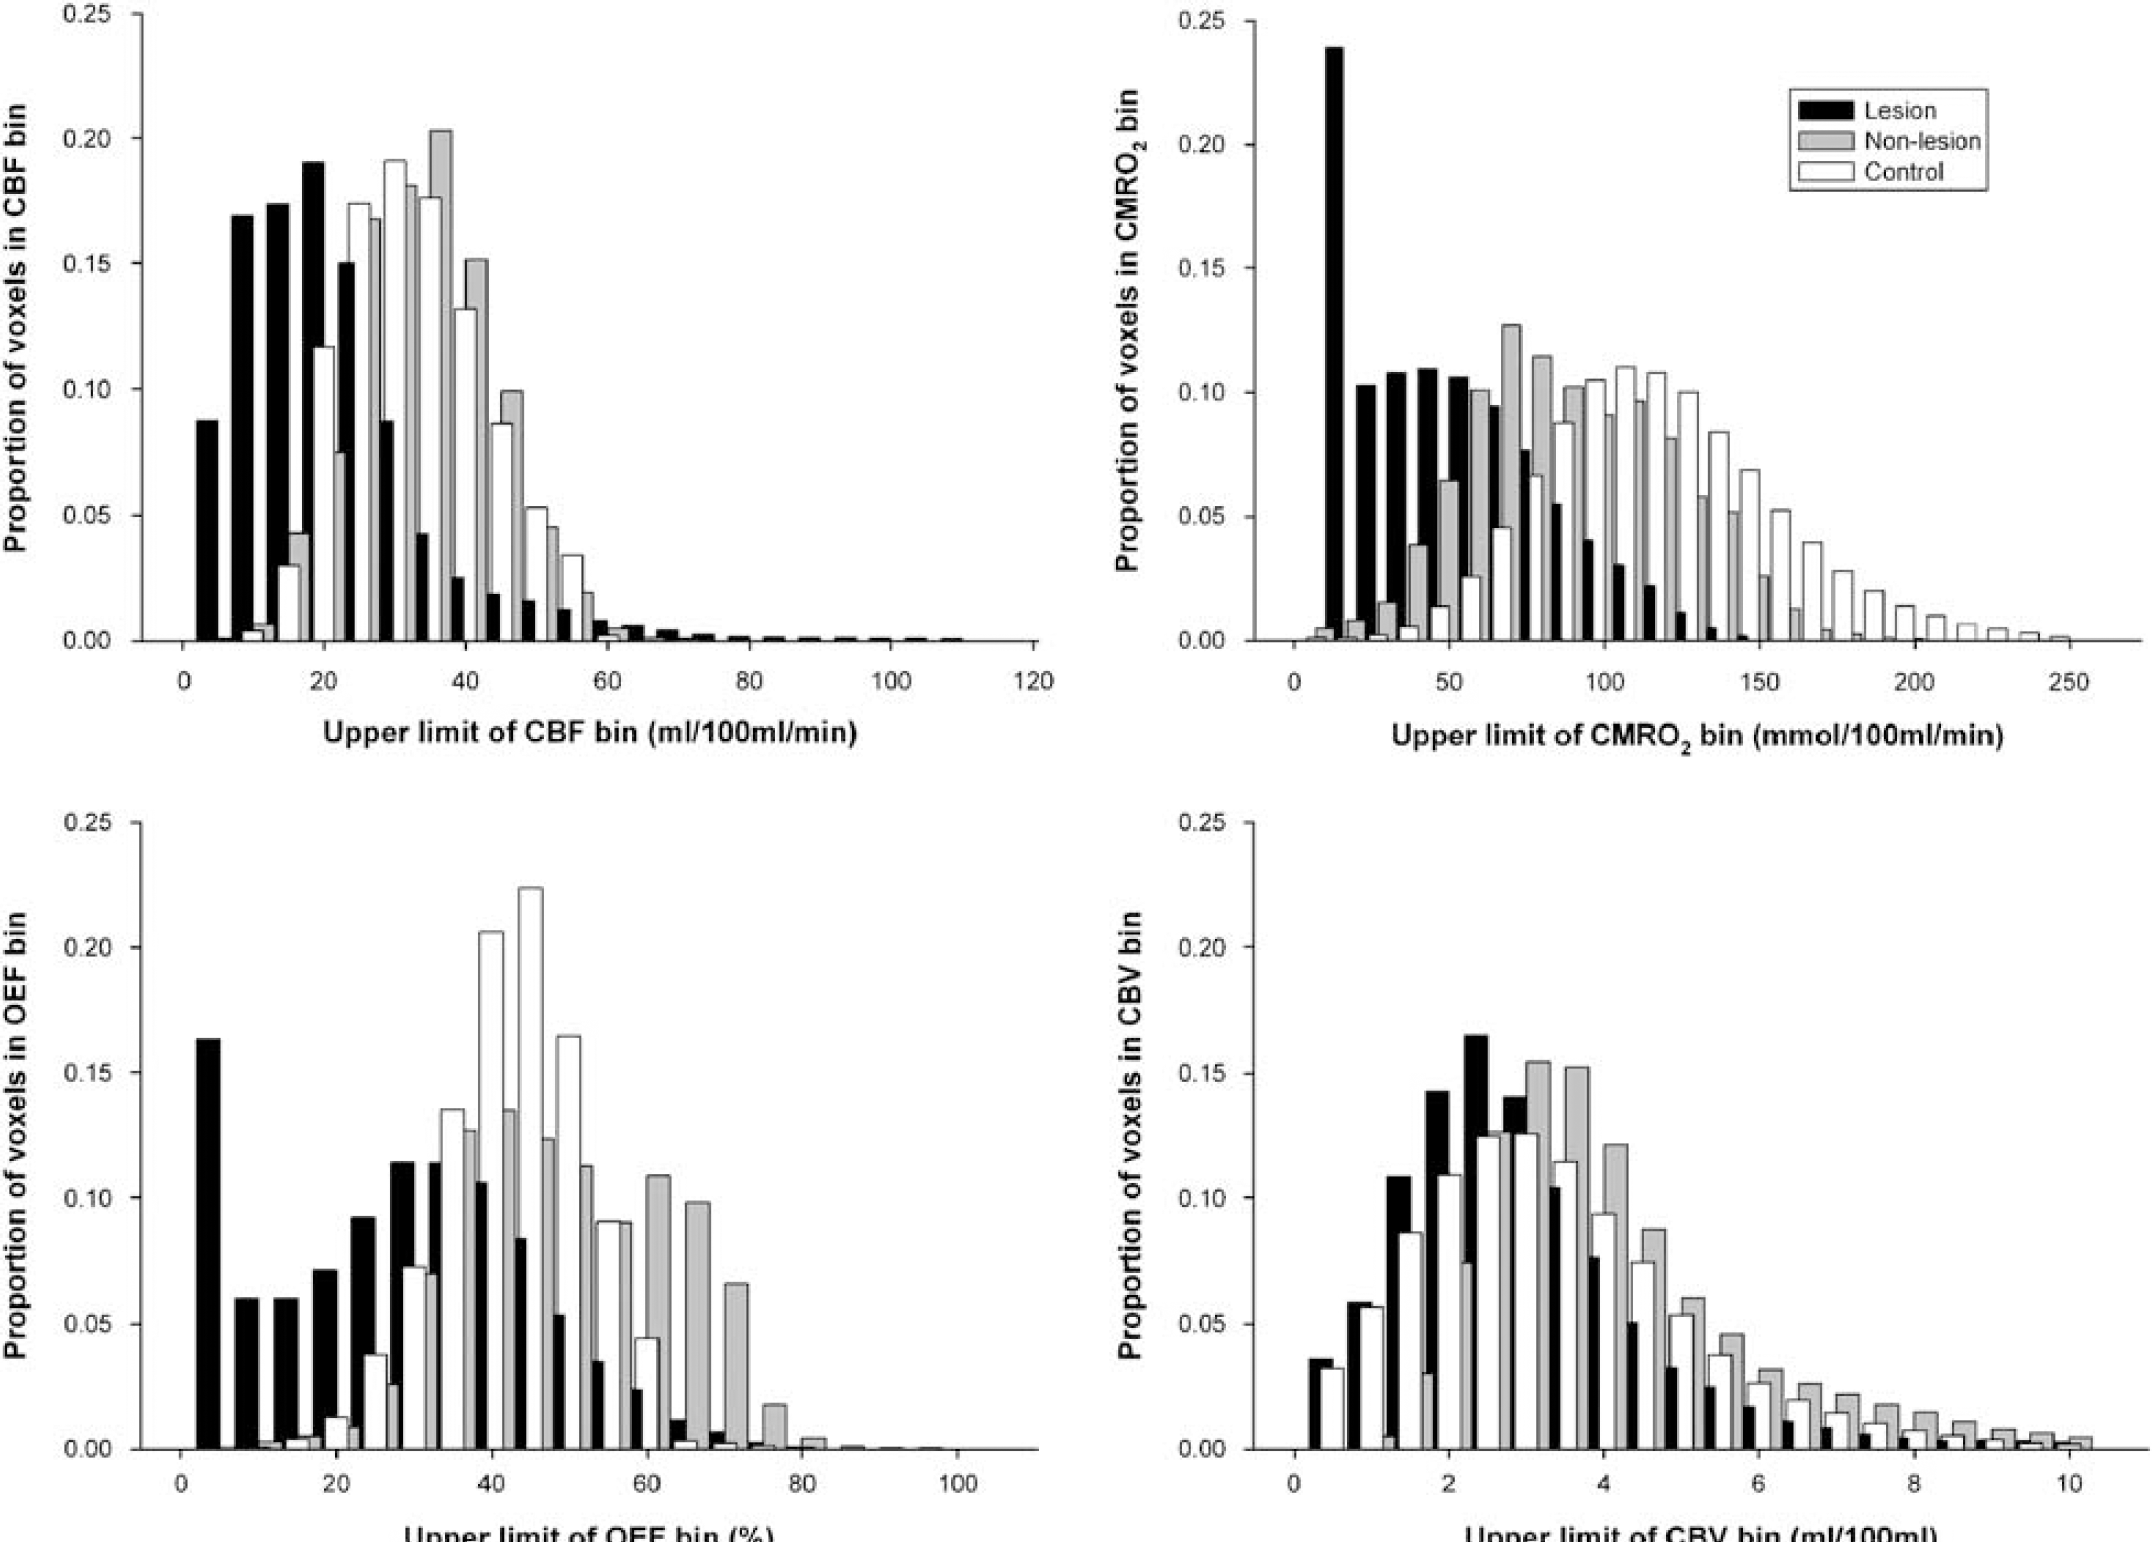
Histogram showing frequency distributions of CBF, CMRO2, OEF, and CBV voxel values in lesion, nonlesion, and control regions of interest.
Relationships between physiologic variables: Relationships between the physiologic variables are shown in Figure 3. General inspection of this data showed that, when compared with normal control tissue, the relationships between the physiologic variables were altered in both lesion and nonlesion tissue. There was far more variability between the ROIs in lesion and nonlesion tissue, compared with control tissue. This variability was also apparent within individual patients (as illustrated in Figure 4), with different regions displaying markedly different pathophysiological patterns.
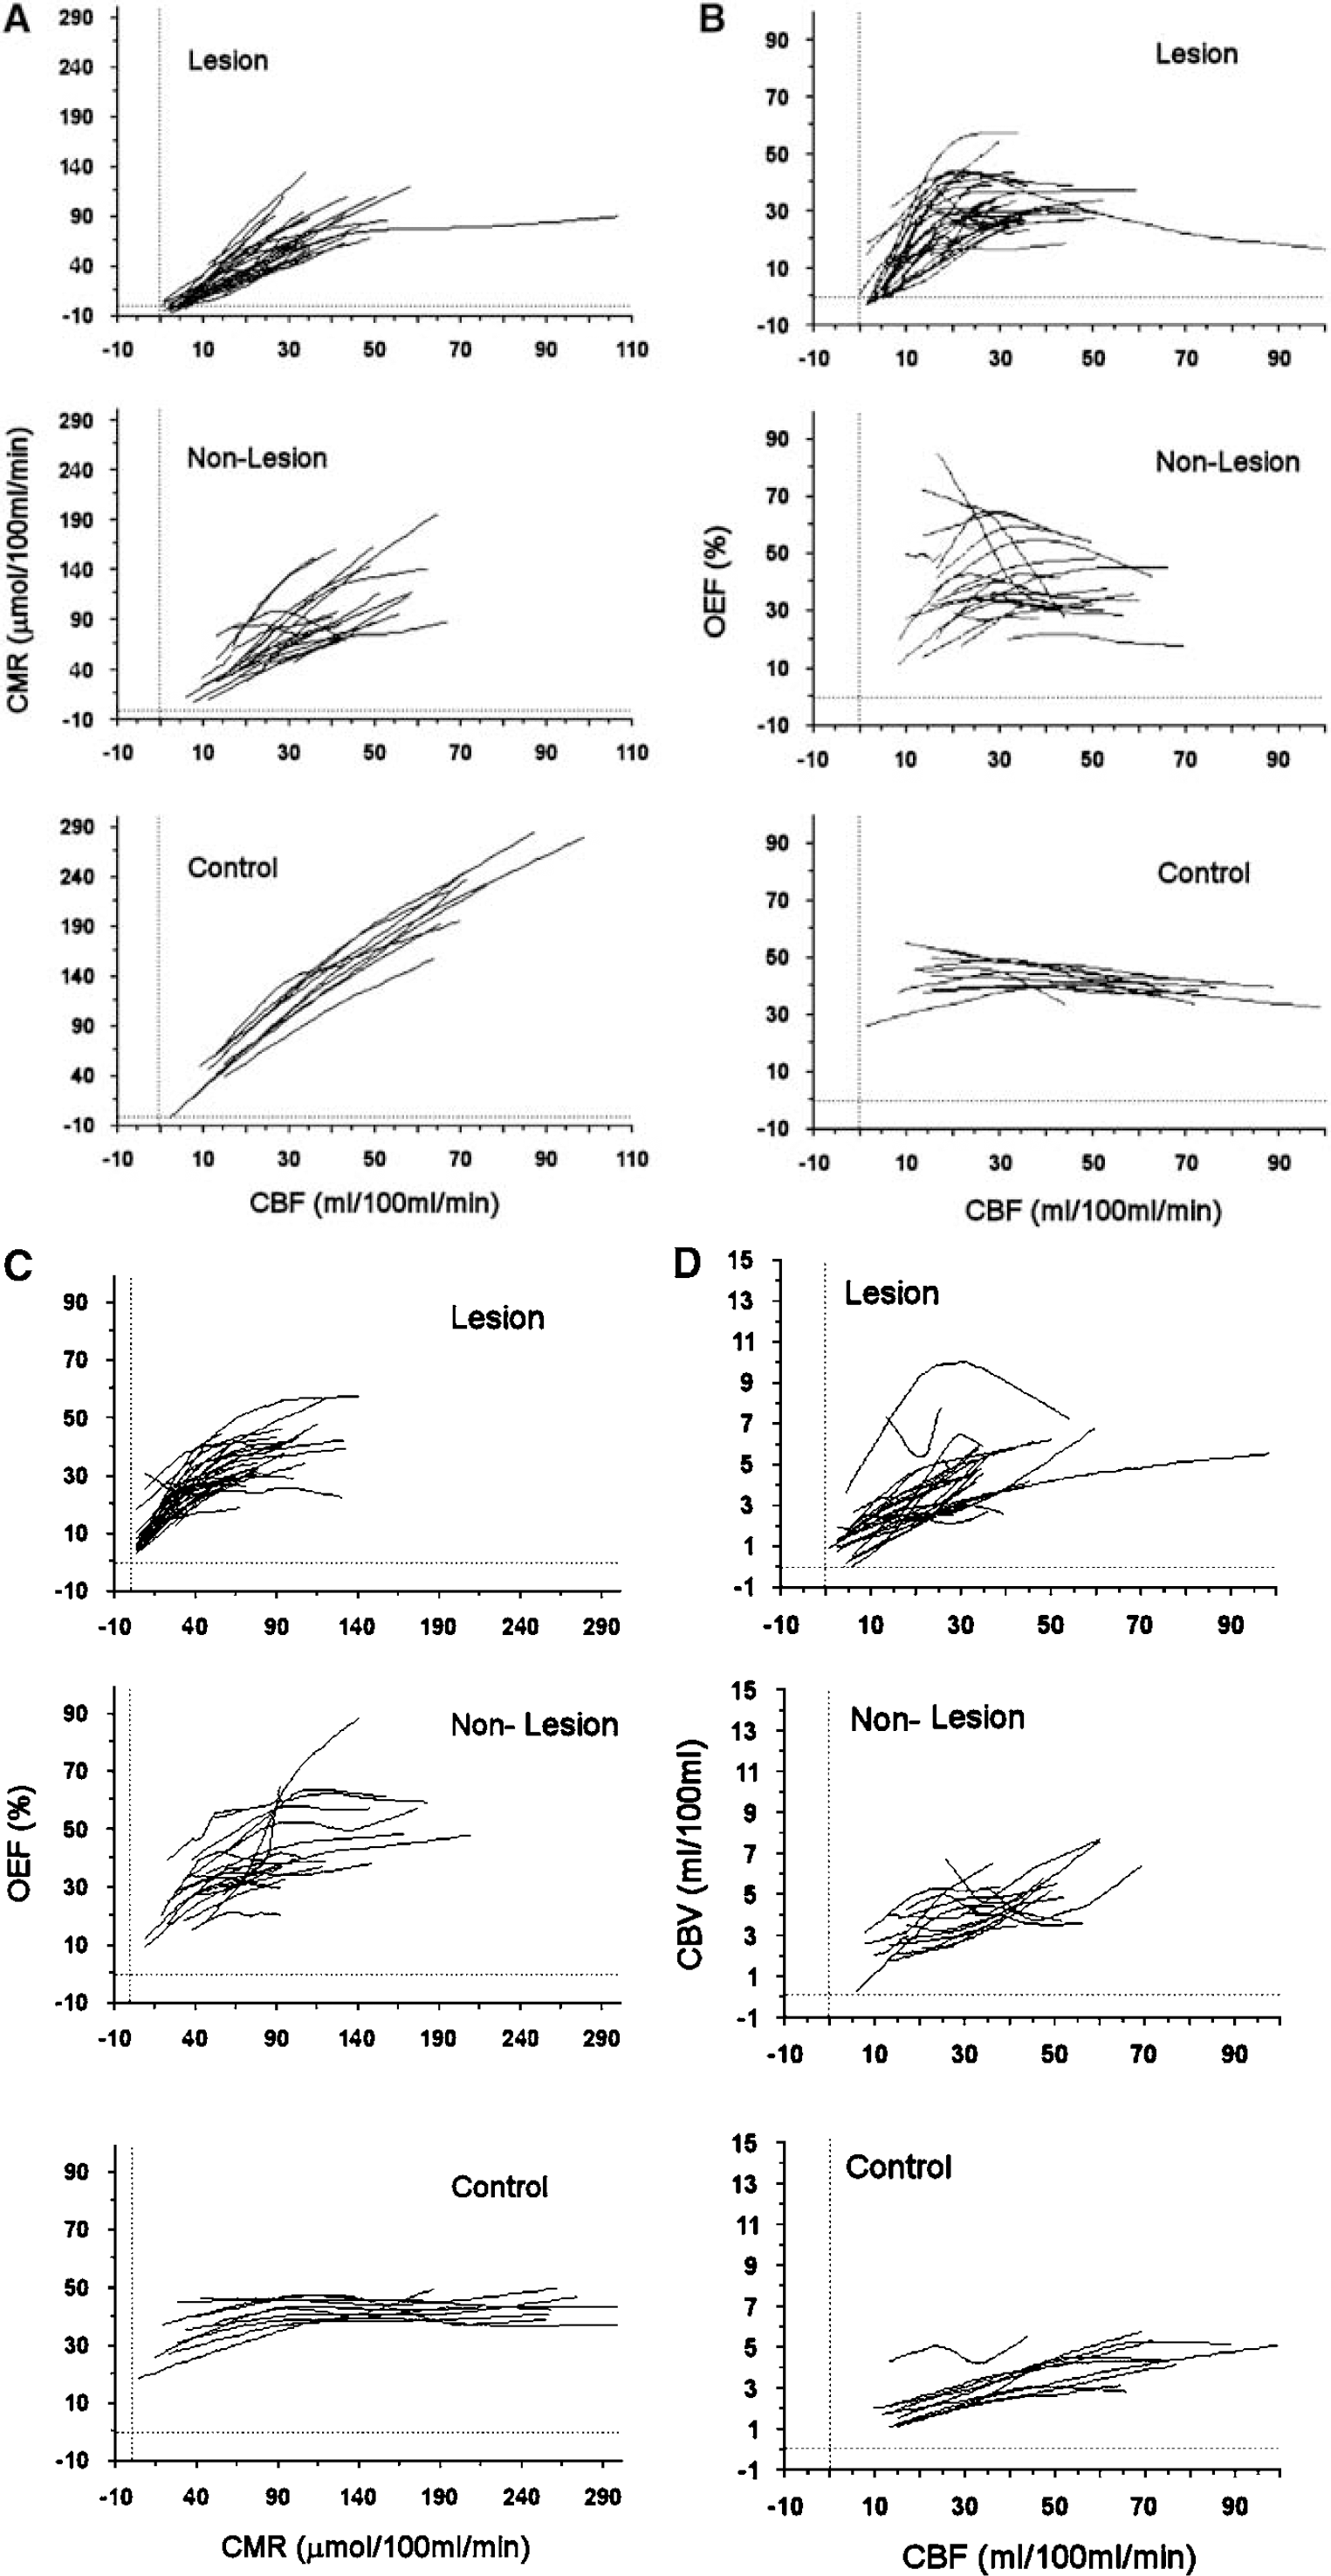
Relationships between PET parameters. Locally weighted regression smoothing (Lowess) plots for voxels from each ROI. (
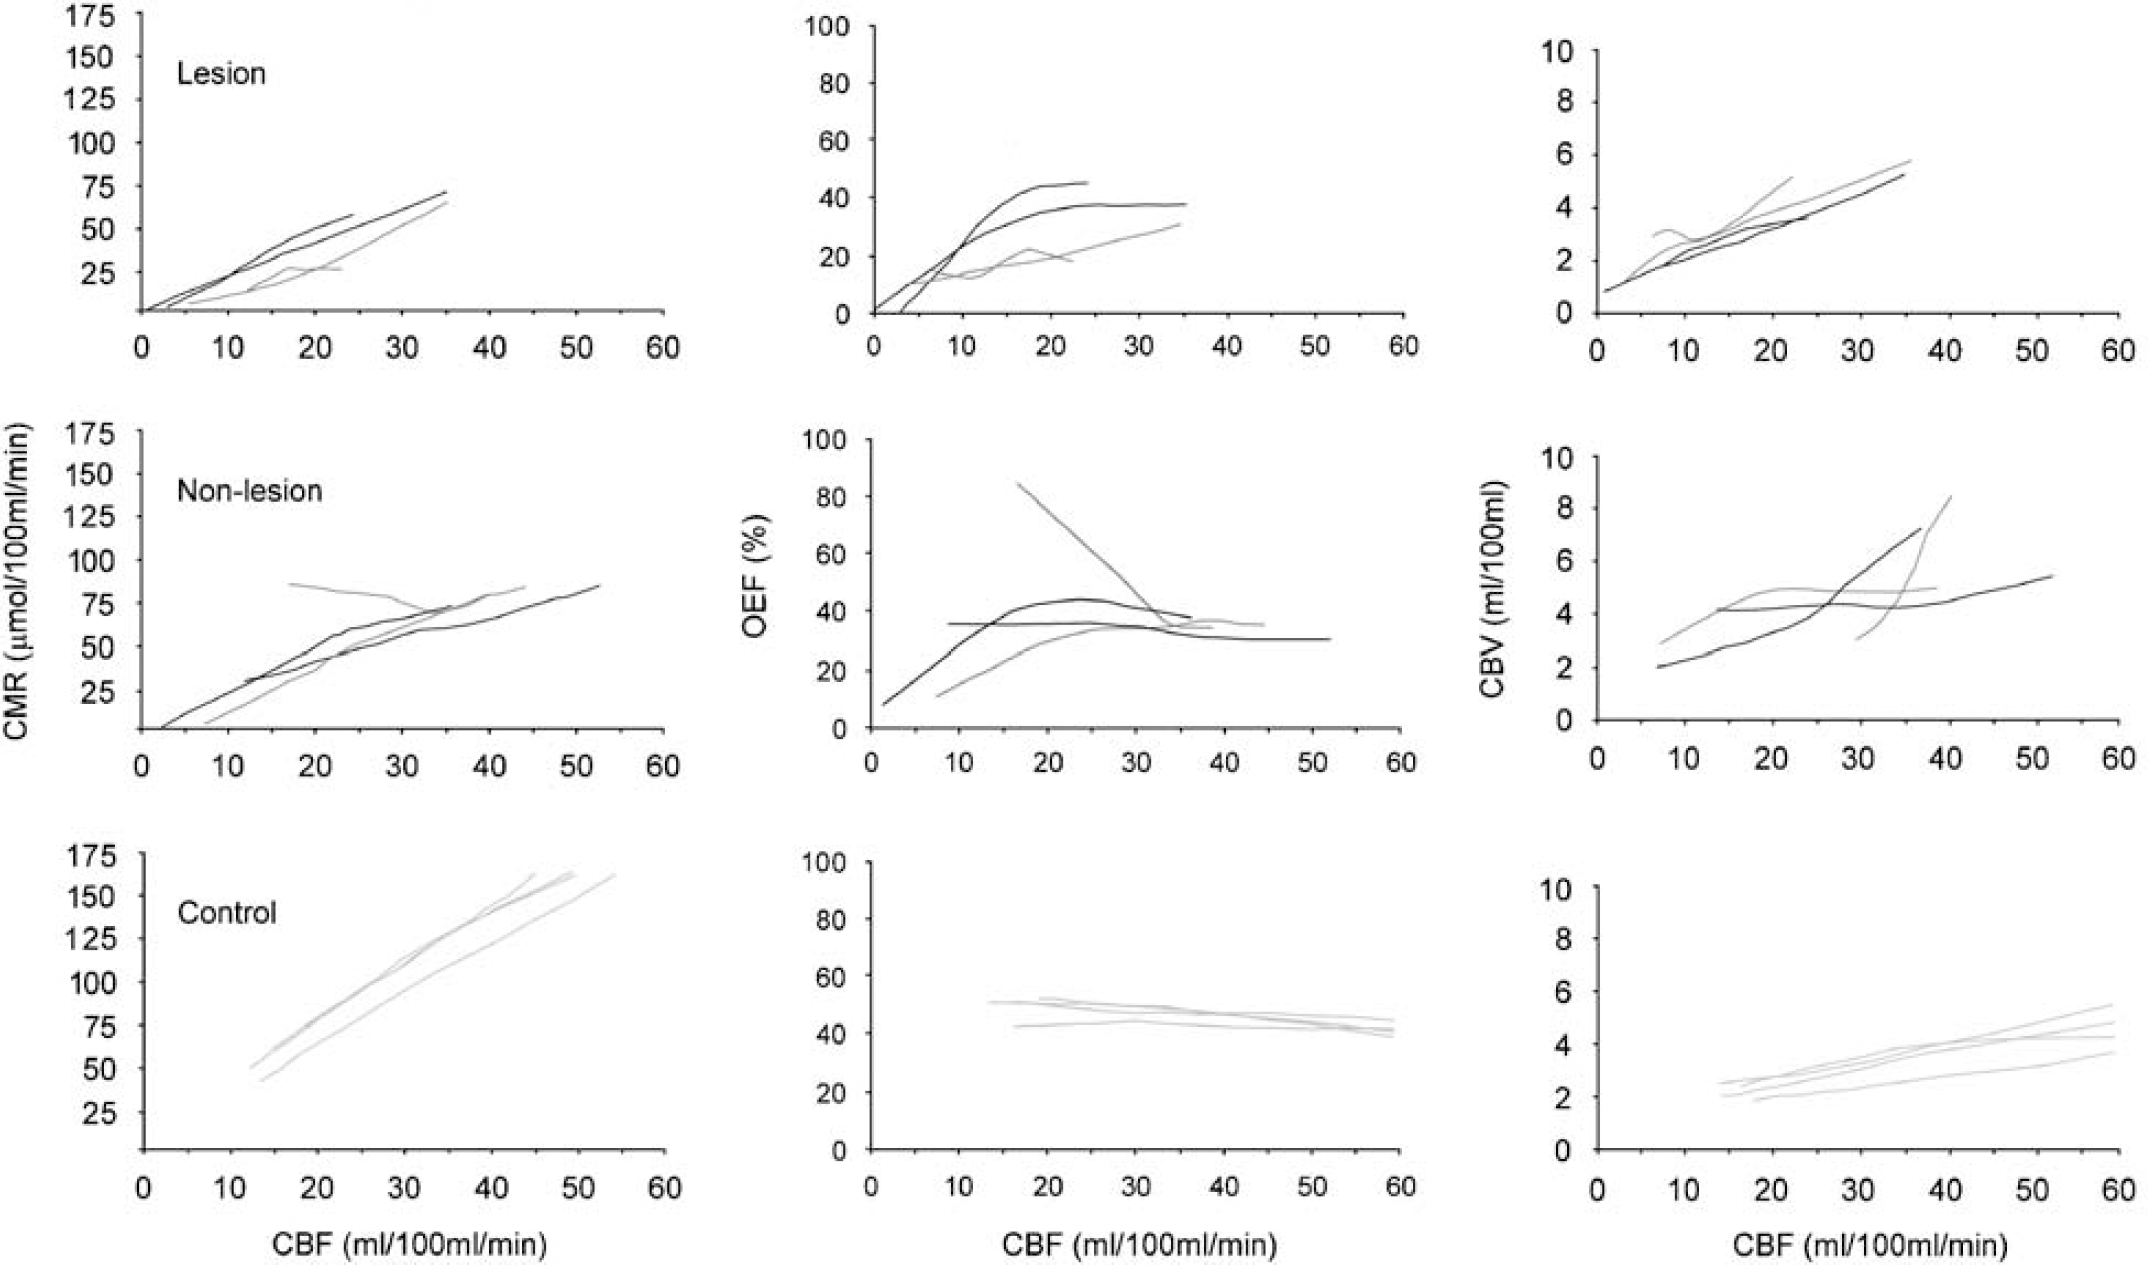
Within patient differences: relationships between physiologic variables. Example shows variable relationships between the physiologic variables even within ROIs in individual patients. The dark gray curves are from two different ROIs from patient 13, and the black curves are from two different ROIs from patient 9. The corresponding control ROIs are shown in light gray.
The relationships between CBF and CMRO2 for voxels in lesion, nonlesion and control ROIs are shown in Figure 3A. Linear regression analysis showed that the slope of the relationship was greater in controls (mean 3.15) than in nonlesion ROIs (mean 2.13, unpaired t-test P < 0.05), and lesion ROIs (mean 2.60), although the latter did not reach statistical significance. There was significantly less variability in the control group compared with nonlesion and lesion ROIs (P <0.01 using F-test for variance).
Relationships between CBF and OEF are shown in Figure 3B. In control tissue, OEF was relatively constant across a range of CBF values, although there was some variability at lower CBF values. In lesion and nonlesion tissue, there was far more variability between ROIs in this relationship. Generally OEF appeared to be more constant in nonlesion ROIs with some decrease in OEF at lower CBF values (although some ROIs displayed a marked increase in OEF as CBF decreased, suggestive of ischemia). In lesion tissue, the most obvious pattern was that OEF appeared to be maintained or increased until a CBF of approximately 10 to 20 mL/100 mL/min after which it declined in association with declining CBF suggestive of irreversible injury.
Relationships between CMRO2 and OEF are shown in Figure 3C. The OEF in control ROIs was relatively constant across a range of CMRO2 values, with some decrease at lower CMRO2 values. In lesion and nonlesion ROIs, there was far more variability although there appeared to be a CMRO2 ‘threshold’ of approximately 40 to 50 μmol/100 mL/min above which OEF is maintained, but below which OEF decreases in association with decreasing CMRO2.
Relationships between CBF and CBV are shown in Figure 3D. In control tissue, CBV increased with increasing CBF. Although lesion and nonlesion tissue showed a trend of increased CBV with increasing CBF, the slope of the CBV versus CBF relationship was significantly more variable compared with the control group (P < 0.0001 using F-test for variance). Some ROIs had a decreased CBV with increasing CBF, a relatively constant CBV or a variable pattern of CBV with CBF.
The different relationships found within individual subjects are shown in Figure 4. In comparison with control data, the two ROIs from each of patient 9 and 13 show a variety of derangements in physiology in both lesion and nonlesion tissue. For example, one nonlesion ROI from patient 13 shows an increase in OEF to sustain CMRO2 with a fall in CBF below 30 mL/100 mL/min, which is consistent with ischemia. However, another nonlesion ROI from the same subject shows that a proportion of the voxels within a nonlesion region show very low OEF, CBF, and CMRO2 values consistent with irreversible injury. The nonlesion ROIs from patient 9 both show coupling of CBF and CMRO2, although voxels from one of the regions show very low CBF and CMRO2 values. Indeed, the relationship between CBF and OEF for the two regions are markedly different. One shows a constant OEF across the range of CBF values, whereas the other shows a progressive fall in OEF below a threshold of ~20 mL/100 mL/min, consistent with tissue injury.
Discussion
We have investigated, at the voxel-based level, the acute metabolic characteristics of tissue that is ultimately identified as irreversibly damaged on late structural imaging, and compared these with the characteristics of ultimately undamaged tissue and control data. In healthy subjects we found the expected relationships among blood flow, volume, and metabolism, with very little variation either within or between subjects. Although irreversibly damaged tissue is characterized in the acute stage by a markedly reduced blood flow and metabolism, there is considerable variation at the voxel-based level, with substantial overlap in the physiologic distribution found in lesion, nonlesion, and control ROIs. In addition, there are derangements in the relationships between the physiologic variables in both ultimately structurally damaged and undamaged tissue. Such derangements display both between- and within-patient heterogeneity with different flow-metabolism relationships occurring within different regions of individual patients. Although evidence of metabolic dysfunction was common, only a small proportion of brain regions displayed evidence of ‘classical ischemia’ at this time point after injury.
Methodological Issues
Using 15O PET, with quantitative assessment of CBF, CMRO2, OEF, and CBV at both a global and regional level, it is possible to gain pathophysiologic insights into the consequences of TBI. However, PET provides only a ‘snapshot’ of the metabolic state of the traumatized brain. Although we imaged patients at an average of 43 h after injury, this ranged from 8 to 72 h after injury. Physiologic variables have been shown to vary with the time after injury (Martin et al, 1997), with the highest incidence of ischemia occurring within the first 24 h of injury (Coles et al, 2004; Martin et al, 1997). Any snapshot of the traumatized brain cannot account for such temporal variation (either within or between patients). Thus, it is possible that we may have obtained different results had we been able to image patients at earlier, or multiple, time points.
We have used a voxel-based data analysis approach that did not examine white and gray matter separately. White and gray matter have been shown to have different CBF and CMRO2 (Marchal et al, 1992), and may have differing susceptibility to injury (Marcoux et al, 1982). Although it is possible to produce results based on the segmentation of imaging data into probability maps for gray and white matter, such techniques are less reliable within and around regions of gross distortion and injury like brain contusions. Regions with a differing proportion of gray and white matter may be expected to display different patterns of pathophysiology, and this will have contributed to the differences that we have showed. In addition, voxel-based data are more susceptible to partial volume and statistical errors from sampling such a small region of the brain. Such reductions in the signal to noise ratio may result in a greater spread of physiologic variables. When considering the relationships between the physiologic variables, we attempted to minimize the effects of such errors by spatially smoothing the PET voxel data and plotting weighted summary curves, which give lesser weighting to outlying values.
In this retrospective study, we compared the acute PET images with lesions defined on magnetic resonance imaging obtained 3 to 18 months after injury. The extent and location of lesions in acute TBI is modified by early perilesional and generalized oedema, and by late atrophy and scarring. This clearly presents difficulties when correlating images obtained at different time points after injury. We have attempted to minimize the errors that could result from inaccurate comparisons between the images by using image coregistration (including algorithms for coregistration of grossly distorted images) and spatial smoothing. Although coregistration and spatial smoothing cannot provide a perfect solution, we believe that the methodology we used provides the best possible solution at this time. Finally, it is important to note that we defined irreversibly damaged tissue on late MR images by outlining regions of structural abnormality or pan-necrosis (corresponding to acute traumatic contusions), and constructing mirror regions of apparently structurally normal tissue. However, diffuse selective neuronal loss may occur after TBI in the absence of structural lesions (Garnett et al, 2000; Stein et al, 2004). Such selective neuronal loss may, therefore, have contributed to the differences in pathophysiology that we have observed, particularly in ‘nonlesion’ tissue.
Pathophysiology in Contusions and Structurally Normal Regions
In this study, within areas of eventual structural abnormality, the average CBF was significantly reduced compared with structurally normal regions, which had average CBF similar to that of control regions. This is in agreement with earlier studies (McLaughlin and Marion, 1996; Schroder et al, 1995; Steiner et al, 2003; von Oettingen et al, 2002). Although reported CBF in contusional and pericontusional regions includes a wide range of values, studies have generally found CBF to be significantly reduced within these regions. Similarly, the significantly reduced CMRO2 we found within both structurally damaged and nondamaged brain regions is in keeping with a number of earlier studies (Glenn et al, 2003; Hutchinson et al, 2002; Vespa et al, 2005), which have showed reductions in metabolism across the traumatized brain.
In health, earlier studies have showed that regional CBF and CMRO2 are tightly coupled, resulting in a relatively fixed OEF (Lebrun-Grandie et al, 1983; Leenders et al, 1990), despite regional variations in CBF and CMRO2. As these studies used relatively large ROIs it is possible that spatial averaging masked more localized variations. However, we found that, even at the voxel-based level, control subjects displayed close ‘flow-metabolism’ coupling (Figure 3A), with OEF varying relatively little with either CBF or CMRO2 (Figures 3B and 3C), and with very little variation either within or between control subjects. In contrast, there was a significantly wider distribution of OEF values in patients (Figure 2), with disruption of the CBF-CMRO2 relationship in both lesion and nonlesion regions (Figure 3A).
Ischemia is thought to be an important pathophysiological mechanism in TBI and this is supported by postmortem evidence indicating that ischemic injury is a common finding after TBI (Graham and Adams, 1971). Traditional views of cerebrovascular physiology dictate that with cerebral ischemia there is limitation of oxygen supply with decreased CBF despite initially maintained oxygen utilization. This results in an increased oxygen demand relative to supply (and thus an increased OEF). With subsequent decreases in CBF, reductions are seen in both oxygen utilization and extraction, as neuronal decompensation and death occur. On the basis of experimental and stroke studies, an OEF of > 75% is suggested as an ischemic threshold (Marchal et al, 1999; Sakoh et al, 2000). Only a small proportion of voxels across all brain regions had a markedly increased OEF, and our ROI level data show that OEF was significantly reduced within contusional regions. In lesion and nonlesion tissue overall, oxygen extraction rose with falling CBF until very low CBF after which it fell sharply. A number of earlier studies in TBI have also found low OEF values at the ROI or global level (Diringer et al, 2002), whereas voxel-based 15O PET studies have showed the presence of ischemia within the first 24 h after injury (Coles et al, 2004). An important confounding factor in interpreting these data are that pathophysiology will vary over time. Thus, it is quite possible that our data may simply reflect later neuronal decompensation, especially, as we imaged patients at an average of 43 h after injury. Our findings are in keeping with recent PET studies that have also failed to show evidence of ischemia in more than a small proportion of the brain (Vespa et al, 2005). Thus, although ischemic injury may occur more commonly in the acute period after injury, alternative pathophysiological mechanisms must also be considered.
There is evidence to suggest that a number of other pathophysiological mechanisms may occur after TBI and result in neuronal injury. Changes in CBF after TBI may be secondary to widespread metabolic suppression, dysfunction, or derangements in flow metabolism coupling (Bergsneider et al, 2000; Coles et al, 2004; Vespa et al, 2005; Wu et al, 2004), rather than a primary ischemic phenomenon. At the cellular level, this may reflect metabolic crisis (Vespa et al, 2005), arising from mitochondrial dysfunction. Indeed, there are data that show impaired function in mitochondria isolated from clinical and experimental brain injury (Robertson, 2004; Verweij et al, 2000). Mitochondrial dysfunction can also be inferred from transient reductions in tissue N-acetylaspartate levels in 1H MR spectroscopy (Marmarou et al, 2005; Signoretti et al, 2001), whereas increased lactate suggests deranged energy metabolism that is consistent with cellular hypoxia or mitochondrial dysfunction (Barker, 2005; Stengel et al, 2004). Postmortem studies show widespread microvascular occlusion and perivascular oedema in TBI (Bullock et al, 1991; Stein et al, 2004), associated with selective neuronal loss rather than pan-necrosis (Stein et al, 2004). The relevance of these findings to clinical head injury is explained by studies with 15O PET and tissue oximetry, which show increased vascular to tissue gradients for pO2 in the injured brain (Johnston et al, 2005; Menon et al, 2004). These were attributed to microvascular occlusion and were associated with an inability to increase OEF in the face of CBF reduction. More recent studies have used microdialysis and tissue oxygen monitoring to show that an increase in the inspired fraction of oxygen can result in reductions in extracellular fluid lactate and increase CMRO2 by potentially overcoming such diffusion barriers to oxygen delivery, or by compensating for mitochondrial dysfunction (Nortje et al, 2008). Such findings imply that a complex pattern of derangements in flow and metabolism across the injured brain may result after head injury. Such derangements will result in different patterns of injury, ranging from pan-necrosis to evidence of selective neuronal loss. In addition, multiple processes may be active within the same individual at different time points after injury, in different parts of the same brain at a single time point, or even coexist within the same region of tissue.
Changes in CBV and in the relationship of CBV and CBF can also yield important insights into pathophysiology after TBI. The results of earlier studies regarding CBV in TBI are conflicting. Most investigators have found CBV to be reduced in contused regions (Coles et al, 2004; Schroder et al, 1995; Steiner et al, 2003); however, at a global level (or in distant regions), CBV has been found to be comparable, increased (Coles et al, 2004; Schroder et al, 1995), or decreased (Marmarou et al, 2000) when compared with normal control subjects. In this study, we found that CBV was not significantly lower within lesion ROIs, and that CBV within nonlesion ROIs was significantly increased, compared with normal controls. In health, earlier ROI-based studies have showed coupling of CBF and CBV (Leenders et al, 1990). We also found CBF and CBV to be closely coupled in control subjects, with relatively little intersubject variation even at the voxel-based level. In TBI, alterations in this relationship can reflect important pathophysiological changes such as vascular engorgement or microvascular compression (due to vasoconstriction or to extrinsic compression, for instance, by oedema). We found substantial variability in the relationship between CBV and CBF within both lesion and nonlesion ROIs, which was even more apparent at the voxel-based level (Figures 3 and 4). Although there was an overall trend of decreasing CBV with decreasing CBF, there were some ROIs that showed increases in CBV or highly variable patterns even within a single ROI. This is in keeping with several earlier ROI-based studies of CBF and CBV in and around traumatic contusions, which have also found variable relationships between CBV and CBF (Bouma et al, 1998; Schroder et al, 1995). Our results may reflect variable failure of autoregulation across the injured brain, and variable pathophysiological processes. Indeed, further evidence of global dysautoregulation in TBI is provided by studies, which have investigated the effects of increases in cerebral perfusion pressure on CBF and CBV and have found every possible combination of changes (Steiner et al, 2003).
Conclusions
Earlier PET studies in healthy subjects have showed that oxygen supply and demand are closely coupled, as are blood flow and blood volume. In this study, we have confirmed the findings of such early PET studies, and shown that there is remarkable constancy of cerebral physiology even at the voxel level and across different subjects. In contrast, in TBI we have showed that pathophysiological changes are widespread, affecting apparently structurally normal tissue as well as lesion tissue, and that different patients (and different regions within the same patient) may display different patterns of pathophysiological change. It is clear that contused brain regions are characterized by markedly reduced CBF, CMRO2, and OEF. However, our data clearly show that there are also marked derangements in the physiology of regions that ultimately appear structurally normal. We believe that this is an important finding, as it necessarily results in one of two inferences. One is that the physiologic derangements that we define are not critical to tissue survival, and other mechanisms may determine tissue fate. Alternatively, these thresholds are critical, but the normal structural appearances at follow-up hide covert injury, such as selective neuronal loss (Garnett et al, 2000; Stein et al, 2004) or disruption of white matter tracts (Newcombe et al, 2007; Sidaros et al, 2008). Such subtle tissue injury may have important implications for functional outcome but is not shown by conventional structural imaging. Documentation of the extent and location of such change will require confirmation using additional imaging techniques, such as 11C-Flumazenil PET, diffusion tensor imaging, and magnetic resonance spectroscopy.