
Abstract
Although the close regional coupling of resting cerebral blood flow (CBF) with both cerebral metabolic rate of oxygen (CMRO2) and cerebral metabolic rate of glucose (CMRglc) within individuals is well documented, there are few data regarding the coupling between whole brain flow and metabolism among different subjects. To investigate the metabolic control of resting whole brain CBF, we performed multivariate analysis of hemispheric CMRO2, CMRglc, and other covariates as predictors of resting CBF among 23 normal humans. The univariate analysis showed that only CMRO2 was a significant predictor of CBF. The final multivariate model contained two additional terms in addition to CMRO2: arterial oxygen content and oxygen extraction fraction. Notably, arterial plasma glucose concentration and CMRglc were not included in the final model. Our data demonstrate that the metabolic factor controlling hemispheric CBF in the normal resting brain is CMRO2 and that CMRglc does not make a contribution. Our findings provide evidence for compartmentalization of brain metabolism into a basal component in which CBF is coupled to oxygen metabolism and an activation component in which CBF is controlled by another mechanism.
Keywords
Introduction
There is substantial interindividual variation in resting whole brain values of cerebral blood flow (CBF), cerebral metabolic rate of oxygen (CMRO2), and cerebral metabolic rate of glucose (CMRglc) in normal humans, with coefficients of variation of 13% to 23% (Scheinberg and Stead, 1949; Gottstein et al, 1963; Fiorelli et al, 1992; Madsen et al, 1993; Ito et al, 2004; Mosconi et al, 2007). Although the close regional coupling of resting CBF with both CMRO2and CMRglc within individuals is well documented, few data exist regarding the coupling between whole brain flow and metabolism among different subjects (Sokoloff, 1981; Lebrun-Grandie et al, 1983; Raichle et al, 2001; Coles et al, 2006). To investigate the metabolic control of resting whole brain CBF, we performed multivariate analysis of hemispheric CMRO2, CMRglc, and other covariates as predictors of resting CBF among 23 normal humans.
Materials and methods
Participants
Normal volunteers were recruited as controls for a study of cerebral metabolism in patients with Huntington and Parkinson diseases (Powers et al, 2007, 2008). They were recruited by public advertisement and from friends and spouses of patients. All underwent clinical neurologic evaluation by a neurologist.
Inclusion criteria were the following:
Disease free by subject's own history including no history of migraine, childhood febrile seizures, or head trauma with loss of consciousness
Taking no medication by subject's own history
No signs or symptoms of neurologic disease other than mild distal sensory loss in the legs consistent with age
No pathological lesions on magnetic resonance (MR) scan performed for this study (see below). Mild atrophy and punctate asymptomatic white matter abnormalities were not considered pathological
Exclusion criteria were the following:
Younger than 18 years
Major neurologic or psychiatric disease or clinically significant lesions on brain imaging that was performed before enrollment in the study
Regular treatment or exposure in the last 6 months to neuroleptics, metoclopramide, alphamethyldopa, clozapine, olanzapine, quetiapine, flunarizine, cinnarizine, reserpine, amphetamines, monoamine oxidase inhibitors (MAO), or other medications that might interfere with mitochondrial metabolism
Ever having taken dopaminergic medications
Anticholinergics, amantadine, CoQ10, selegiline, and vitamins E and C must be discontinued for 30 days before entry into the study
Diabetes mellitus treated by medications
Pregnancy
Image Acquisition
High-resolution T1-weighted MR images were acquired with a Siemens Magnetom SONATA 1.5T scanner (Siemens Medical Solutions USA, Inc., Malvern, PA, USA). A midsagittal scout spin-echo sequence was used to position the subject, then a 3D MPRAGE sequence was acquired (repetition time (TR)/echo time (TE)/inversion time (TI) = 1900/3.93/1100 milliseconds, flip angle (FA) = 8°, 7:07 minutes, 128 ± 256 ± 256 matrix 1.25 ± 1 ± 1mm3voxels).
Positron emission tomography (PET) images were obtained in the 2D acquisition mode, with a Siemens/CTI ECAT EXACT HR 47 PET scanner (Siemens Medical Solutions USA, Inc.), with participants lying supine in a quiet dark room. A single transmission scan using 68Ge/68Ga rotating rod sources was performed before radiotracer administration and used for subsequent attenuation correction of all emission data. Emission data were acquired in the 2D mode because of the problems that we and others have experienced with the scatter correction when trying to acquire 3D O15O images (Coles et al, 2006). Cerebral blood volume (CBV) data were acquired with a 5-min emission scan beginning 2 min after brief inhalation of 75 mCi of C15O (Martin et al, 1987). Cerebral metabolic rate of oxygen and oxygen extraction fraction (OEF) data were acquired with a 40-second emission scan after brief inhalation of 75 mCi of O15O (Mintun et al, 1984). Cerebral blood flow data were acquired with a 40-second emission scan after rapid injection of 50 mCi H215O in saline (Raichle et al, 1983). During these 15O studies, arterial blood was withdrawn at 5mL/min from the radial artery through narrow bore tubing to a lead shielded scintillation detector that measures positron emissions with 1 second temporal resolution. These arterial blood radioactivity measurements were corrected for delay and dispersion in the tubing using parameters empirically determined in a previous experimental study. This study used the same tubing and the same withdrawal pump with human blood of differing hematocrits. 15O radiolabeled blood was placed in one-half of a chamber separated from nonradioactive water by a rubber membrane. Liquid withdrawal was begun from the nonradioactive side through the tubing to the lead shielded scintillation detector. A timed square wave of radiolabeled blood was generated by quickly puncturing the rubber membrane. The delay and dispersion parameters necessary to convert the resultant time– radioactivity curves recorded by the detector back to the original square wave were empirically determined as a function of hematocrit. The time shift between arrival of radioactivity in the sampled arterial blood and in the brain was determined during the H215O scan by the sudden increase in total coincidence events in the field-of-view as recorded at 1 second interval by the scanner. Data for measurement of the CMRglc were obtained after slow intravenous injection of 10 mCi of 18F-fluorodeoxyglucose (18FDG) over 10 to 20 seconds. Dynamic PET acquisition began with injection and continued for 60 minutes according to the following scheme: 16 30-second frames, 8 1-minute frames, 16 2-minute frames, and 4 3-minute frames. During this period, blood samples were hand-drawn frequently from the arterial catheter and counted in a well counter. Arterial samples for plasma glucose determination were obtained just before, at the midpoint during and at the end of the scan and the mean was determined. Plasma glucose was determined by the glucose oxidase method in the Department of Laboratories, Barnes-Jewish Hospital. Arterial blood samples for the measurement of arterial partial pressure of oxygen, arterial partial pressure of carbon dioxide, arterial hemoglobin concentration, and arterial oxygen content were collected twice during the scan session, usually at the beginning before the C15O scan and again after the 18FDG scan (Instrumentation Laboratory, Lexington, MA, USA). Hematocrit was determined by microcentrifugation. The scanner was calibrated to the well counter for conversion of PET counts to quantitative radiotracer concentrations using a cylindrical phantom. All PET emission scans were reconstructed with filtered back projection using the individual attenuation measurements and scatter correction with a ramp filter cutoff at the Nyquist frequency, producing images with a resolution of 4.3mm full width at half maximum.
Image Analysis
The MR image was segmented by first plotting histograms of the voxel intensities of cortical gray matter and ventricular cerebrospinal fluid (CSF). The threshold intensity separating brain from CSF was chosen as the midpoint between gray matter and CSF peaks. Voxels below this intensity and voxels not connected in 3D to a seed point within each brain removed most nonbrain voxels. Manual editing was required to remove external tissue where there was insufficient CSF to separate the brain (near sinuses, temporal lobes, eyes, and brainstem), and a single erosion followed by conditional dilation completed the tissue segmentation. The MR image was then edited manually to generate a region of interest encompassing both cerebral hemispheres by removing the cerebellum and brainstem along a plane connecting the posterior commissure and the most inferior point of the interpeduncular fossa (Filipek et al, 1994).
The original segmented MR image plus the three 15O PET images were coregistered to a composite 40 to 60 minutes 18FDG PET image using Automated Image Registration software (AIR, Roger Woods, University of California, Los Angeles, CA, USA) (Woods et al, 1993) A binary tissue image was created from the original segmented MR image (voxels values of 1 representing brain and 0 representing nonbrain) and convolved to the 3D resolution of the PET images. This convolved tissue image defines the fractional tissue contribution for the measured PET activity in each voxel and was used to correct the radioactivity measurement in each PET image for partial volume effects due to nonbrain structures including CSF (Videen et al, 1999). Partial volume-corrected mean counts were generated for the bihemispheric regions of interest for each of the three 15O PET images and for the dynamic 18FDG PET images. Corrected mean counts were converted to quantitative CBF, OEF, or CMRO2 using previously described methods (Videen et al, 1987).
For 18FDG, a modified Marquardt parameter estimation routine was used to derive bihemispheric rate constants for each participant using the partial volume-corrected dynamic mean PET counts and arterial whole blood time-radioactivity curves. We used the standard two-tissue compartment 18FDG model (Herscovitch, 2002). Five parameters were estimated: four rate constants (
Statistical Analysis
Pearson bivariate correlation coefficients for CBF versus CMRO2 and CBF versus CMRglc were calculated using SPSS 16.0 for Windows (SPSS, Inc., Chicago, IL, USA). In addition, we performed an initial univariate analysis based on simple linear regression with candidate covariates as predictors and resting whole brain CBF (mL/100g per minute) as the outcome. More specifically, we consider the model CBF = β0 + β1PREDICTOR for the candidate predictor variables. When the results of the univariate analysis (Table 1) indicated that CMRO2, but not CMRglc was associated with resting whole brain CBF, we also performed a multiple regression analysis to determine if similar results were obtained after controlling for the presence of the other covariates. We constructed an initial linear model containing only CMRO2, and forward selection was used to determine if additional variables should be added to create a multiple regression model. Wald test statistics are often used when performing model selection, but the asymptotic χ2 distribution may not be appropriate here because of the small sample size. For this reason, we used the bootstrap approach described by Fox for assessing the significance of the observed Wald-like statistics in a nonparametric manner (Fox, 2002). For each hypothesis being tested, an empirical null distribution was created by repeatedly computing Wald-like statistics based on multiple regression models in which the response vector and design matrix are formed by taking bootstrap samples of the rows of the observed response vector and design matrix. Because the binary variable ‘male’ could lead to design matrices with less than full rank under bootstrap resampling, this variable was not considered in this portion of the analysis. The empirical distributions were based on 5,000 bootstrap samples, and at each stage the most significant variable was added to the model. Variables were added to the model if they were significant at the
Univariate analysis with cerebral blood flow as the outcome and the candidate predictor variables as covariates
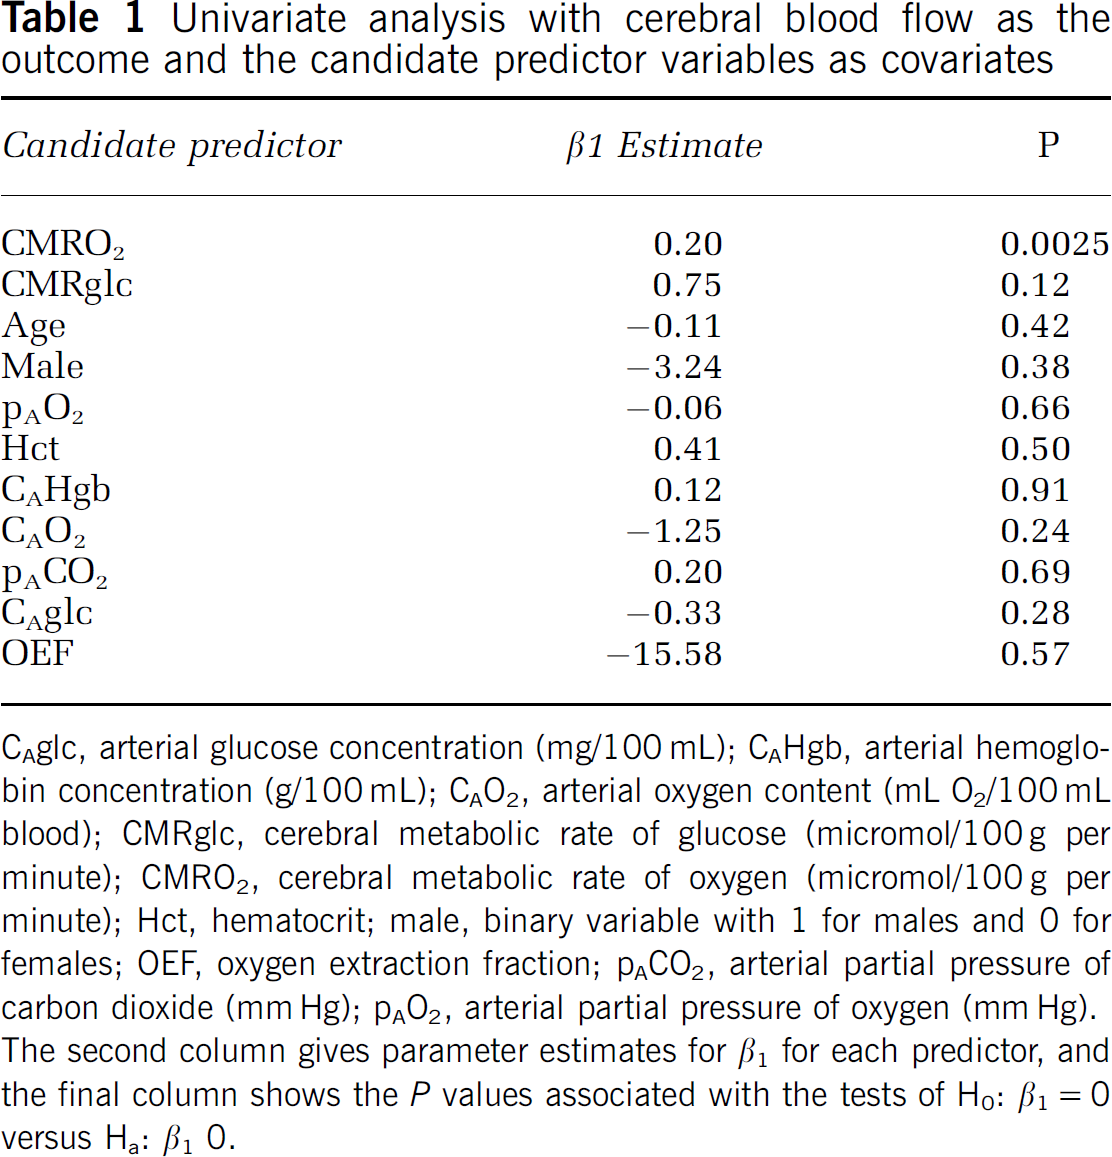
CAglc, arterial glucose concentration (mg/100 mL); CAHgb, arterial hemoglobin concentration (g/100 mL); CAO2, arterial oxygen content (mL O2/100 mL blood); CMRglc, cerebral metabolic rate of glucose (micromol/100g per minute); CMRO2, cerebral metabolic rate of oxygen (micromol/100g per minute); Hct, hematocrit; male, binary variable with 1 for males and 0 for females; OEF, oxygen extraction fraction; pACO2, arterial partial pressure of carbon dioxide (mm Hg); pAO2, arterial partial pressure of oxygen (mm Hg). The second column gives parameter estimates for β1 for each predictor, and the final column shows the
This protocol received prior approval by the Washington University Human Studies Committee (Institutional Review Board) and Radioactive Drug Research Committee. Informed consent was obtained from each subject.
Results
Thirty-three normal control subjects were initially enrolled in the combined study of Huntington disease and Parkinson disease. Ten did not successfully complete PET and MR studies: eight due to technical problems, one had an abnormal MR scan, and one withdrew after MR. The technical problems were caused by inability to place radial arterial catheter (3), malfunction of blood scintillation detector (2), radiochemical contamination of C15O (1), subcutaneous injection of 18FDG and poor parameter estimation fit (1). Data from the 23 who successfully completed PET and MR studies are presented here. The median age was 55 years (range 23 to 70 years). Thirteen were men. There was a statistically significant correlation between CBF and CMRO2 (
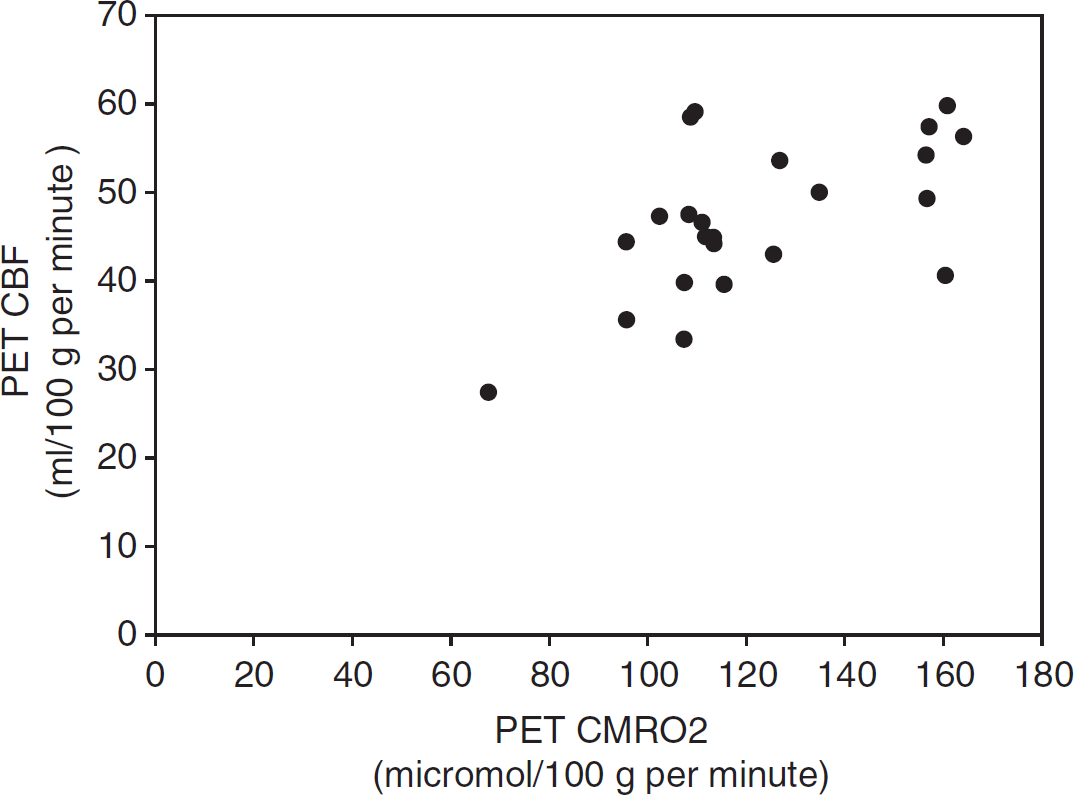
Bivariate plot of resting bihemispheric cerebral blood flow (CBF) and cerebral metabolic rate of oxygen (CMRO2) from 23 normal human volunteers (
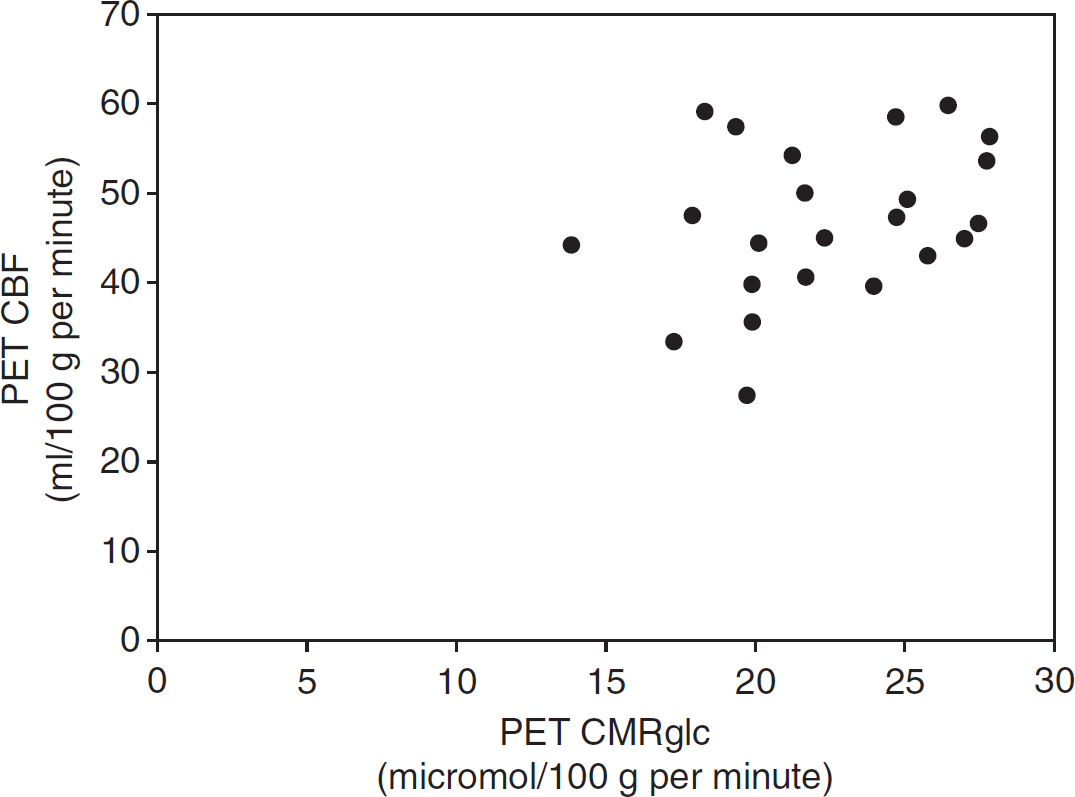
Bivariate plot of resting bihemispheric cerebral blood flow (CBF) and cerebral metabolic rate of glucose (CMRglc) from 23 normal human volunteers (
Parameter estimates from the final linear model after performing variable selection
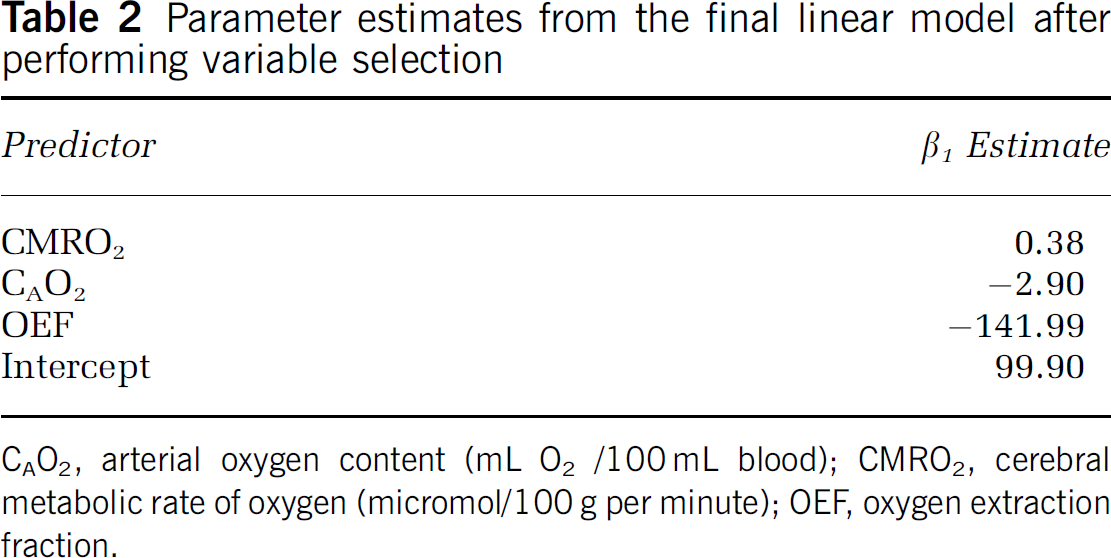
CAO2, arterial oxygen content (mL O2 /100 mL blood); CMRO2, cerebral metabolic rate of oxygen (micromol/100g per minute); OEF, oxygen extraction fraction.
Discussion
In measuring CMRglc with 18FDG, we calculated a value for the
We calculated the coefficient of variation for our CBF and CMRO2 data and compared it with a published compendium of normal data from 11 PET centers (Ito et al, 2004). For CBF, our coefficient of variation was 18%, within the published range of 5% to 23%. For CMRO2, our coefficient of variation was 21%, within the published range of 6% to 25%. For CMRglc, our coefficient of variation was 17%. This is similar to published values of 16% and 16.5% for whole brain CMRglc data obtained from parameter estimation (Fiorelli et al, 1992; Mosconi et al, 2007). The coefficients of variation for the two sets of Kety—Schmidt data we analyzed are the following: CBF 21% and 12%, CMRO2 13% and 13%, CMRglc 21% and 13% (Scheinberg and Stead, 1949; Gottstein et al, 1963). As the variability in our data is very similar to data reported by others, it is most likely due to a combination of biological and methodological factors that are not unique to our specific methodology or subjects.
Two previous studies have reported statistically significant interindividual correlations between CBF and CMRO2 for both whole brain and regional values (Lebrun-Grandie et al, 1983; Coles et al, 2006). We have not found any previous report of the lack of interindividual correlation between CBF and CMRglc. Our final multivariate model included two terms in addition to CMRO2: arterial oxygen content and OEF. Both influence oxygen delivery at the cellular level. Notably, arterial plasma glucose concentration and CMRglc were not included in the final model, indicating that neither glucose supply nor metabolism was a determinant of CBF. Our data demonstrate that the metabolic factor controlling hemispheric CBF in the normal resting brain is CMRO2 and that CMRglc does not make a contribution. This is different from the state of brain activation in which changes in CBF are more closely correlated to changes in CMRglc than CMRO2, although the mechanism for this coupling is unlikely to be the change in CMRglc itself (Fox et al, 1988; Madsen et al, 1995; Powers et al, 1996; Vlassenko et al, 2006). Our findings provide evidence for compartmentalization of brain metabolism into a basal component in which CBF is coupled to oxygen metabolism and an activation component in which CBF is controlled by another mechanism (Nemoto et al, 1994; Raichle et al, 2001; Lindauer et al, 2010).
Footnotes
Acknowledgements
The authors thank Lennis Lich, John Hood, Susanne Fritsch, and the Washington University Cyclotron Staff for their assistance.
The authors declare no conflict of interest.