
Abstract
In and around traumatic contusions, cerebral blood flow (CBF) is often near or below the threshold for ischemia. Increasing cerebral perfusion pressure (CPP) in patients with head injuries may improve CBF in these regions. However, the pericontusional response to this intervention has not been studied. Using positron emission tomography (PET), we have quantified the response to an increase in CPP in and around contusions in 18 contusions in 18 patients. Regional CBF and cerebral blood volume (CBV) were measured with PET at CPPs of 70 and 90 mmHg using norepinephrine to control CPP. Based upon computed tomography, regions of interest (ROIs) were placed as two concentric ellipsoids, each of 1-cm width, around the core of the contusions. Measurements were compared with a control ROI in tissue with normal anatomic appearance. Baseline CBF and CBV increased significantly with increasing distance from the core of the lesion. The increase in CPP led to small increases in CBF in all ROIs except the core. The largest absolute CBF increase was found in the control ROI. Relative CBF increases did not differ between ROIs so that ischemic areas remained ischemic. Pericontusional oedema on computed tomography was associated with lower absolute values of CBF and CBV but did not differ from nonoedematous tissue in the relative response to CPP elevation.
Keywords
Several investigators have studied cerebral blood flow (CBF) and cerebral blood volume (CBV) in and around contusions in patients after traumatic brain injury (Furuya et al., 2003; McLaughlin and Marion 1996; Schröder et al., 1995, 1998a, 1998b). These studies generally report a wide range of flows, but low CBF (< 20 mL·100g−1·min−1) was found in and around the majority of contusions. The low pericontusional values suggest that much of this tissue is viable but vulnerable to secondary injury and ischemia. Accordingly, it has been suggested that CBF to these regions at risk should be enhanced (McLaughlin and Marion, 1996). Theoretically, cerebral perfusion can be improved through an increase in arterial blood pressure or a reduction of intracranial pressure (ICP), achieved either by administration of hyperosmolar substances or by a reduction in PaCO2. To date, only the regional vascular response to hyperventilation has been studied (McLaughlin and Marion, 1996).
The pericontusional response to an increase in MABP, and hence global cerebral perfusion pressure (CPP) is difficult to predict. Proximal increases in vascular resistance (Golding et al., 2003) could lead to an incomplete transmission of the change in pressure to more distal parts of the vascular bed. Alternatively, the presence of external vascular compression (Schröder et al., 1995), internal obstruction through blood components (Dietrich et al., 1996; Hartl et al., 1997), or intravascular coagulation (Stein et al., 2002) could prevent an increase in CBF. Moreover, regional autoregulation will influence the response. The assessment of regional variations in autoregulation does not only demand accurate determination of CBF with high spatial resolution but also an adequate assessment of regional perfusion pressure. Whereas positron emission tomography (PET) with coregistration to computed tomography or magnetic resonance images has an acceptable spatial resolution, there is currently no method available that allows determination of regional perfusion pressure and the assumption that CPP and its changes are distributed uniformly throughout the injured brain lacks solid foundation. Therefore, a concomitant increase in local arterial pressure and local tissue pressure could result in false local autoregulation (Miller et al., 1975). Measurements of CBV are possibly helpful in identifying such a pattern. It has also been suggested that the CBF/CBV ratio could be used for estimation of regional perfusion pressure (Schumann et al., 1998), but it is not clear whether this ratio, which was investigated in primates without intracranial pathology is useful in the setting of acute head injury.
This study was designed to investigate the change in contusional and pericontusional CBF and CBV in response to an increase in CPP. Using PET, we have tested the hypothesis that because of failure of regional autoregulation, the increase in CBF and CBV will be larger in regions of interest (ROIs) close to the core of the contusion than in ROIs situated further away from the core. Furthermore, we tested the hypothesis that the presence of pericontusional oedema would reduce the increase in CBF and CBV through fixed external vascular compression.
METHODS
The local research ethics committee approved this study, and informed assent was obtained from the next of kin of all patients. All patients who were admitted to our Neurosciences Critical Care Unit with severe traumatic brain injury (admission Glasgow Coma Score (GCS) ≤ 8) or moderate traumatic brain injury (admission GCS ≤ 12) and secondary neurologic deterioration requiring intubation and mechanical ventilation were eligible for inclusion in this study. Exclusion criteria were hemodynamic instability and inspired oxygen levels greater than 50%.
Clinical management
During the PET scan, all patients were monitored and treated as on the critical care unit. All patients were intubated and mechanically ventilated, sedated with propofol (2 to 5 mg· kg−1·h−1) and fentanyl (1 to 2 μgk·g−1·h−1), and paralyzed with atracurium. Infusion rates of these drugs were not changed during scanning. Two PET scans were performed. The first scan (baseline) was carried out at a CPP of approximately 70 mmHg; the second scan (intervention) was at a CPP of approximately 90 mmHg. CPP was controlled with an infusion of norepinephrine that was adjusted to reach the desired CPP and then as necessary to keep CPP constant during scanning. PaCO2 was measured at regular intervals and kept stable by making adjustments to the ventilator as necessary. An AVL Omni blood gas analyzer (Roche Diagnostics GmbH, A-8020, Graz, Austria) was used for analysis of all blood samples. The total precision of this analyzer according to NCCLS document EP5-T is SD < 0.27 kPa (J. Riegebauer, AVL Graz, [
PET methods
The studies were undertaken on a General Electric Advance scanner (GE Medical Systems, Milwaukee, WI, U.S.A.). A 10-minute transmission scan using two rotating 68Ge/68Ga rods was performed in all patients and used to correct subsequent emission scans for photon attenuation. Emission data were acquired following a 60-second inhalation of 750 MBq of C15O and during a steady state infusion of 800 MBq of H215O. Images were reconstructed using the PROMIS 3D filtered back projection algorithm (Kinahan and Rogers, 1989) with corrections applied for attenuation, scatter, dead time, and randoms. The emission data were coregistered to spiral computed tomography (CT) images obtained immediately after PET scanning (slice thickness 5 mm). Parametric maps of CBF were calculated by inputting simultaneous PET and arterial tracer activity measurements into standard models using a capillary to large vessel haematocrit ratio of 0.85 and a partition coefficient for H215O of 0.95 (Baron et al., 1989; Herscovitch and Raichle, 1985). Images were analyzed using custom-designed software, incorporating elements of several software packages, including Statistical Parametric Mapping (SPM99, Wellcome Department of Cognitive Neurology, London, UK; http://www.fil.ion.bpmf.ac.uk/spm/), Matlab 5.2 (MathWorks Inc., Natick, MD, U.S.A.), Analyze 4.0 (AnalyzeDirect Inc., Lenexa, KS, U.S.A.), and registration by multiresolution optimization of mutual information (mpr, Department of Radiological Sciences, Guys Hospital, London, UK) (Studholme et al., 1996, 1997).
Regions of interest (ROIs) were drawn on the coregistered CT images as shown in Fig. 1. In a first step, the core of the contusion was identified on each slice using the thresholding function of the image analysis software (Analyze 4.0). Two ellipses were fitted around the core. The long and short axes of the ellipses were defined by the maximal extension of the core. The first ellipse was sized so that a tissue ring of 1-cm width resulted around the hyperdense core of the contusion. The second concentric ellipse defined a tissue ring of 2-cm width around the core. Hypodense regions within the larger ellipse were defined by using the thresholding function of Analyze. From these elements, five ROIs were generated: the core of the contusion, an inner ring of tissue of 1-cm width around the core, an outer concentric ring of 1-cm width around the inner ring, hypodense pericontusional tissue within the second larger ellipse, and normal-appearing pericontusional tissue within the larger ellipse. In addition CBF and CBV were measured in a large (volume 140 mL) control region consisting of gray and white matter without evidence of injury on CT in each patient. We used the spatially normalized (Talairach and Tournoux, 1988) parietal lobe in the noninjured hemisphere for this purpose. In two patients, there were two anatomically separated contusions, and in one patient, there were three. In these patients, only the contusion with the largest volume of the core was included in the analysis. Results for CBF and CBV are expressed in mL·100mL−1·min−1 and mL·100mL−1 rather than mL·100g−1min−1 or mL·100g−1 because it is not possible to make a safe assumption about the regional density of pericontusional brain tissue.
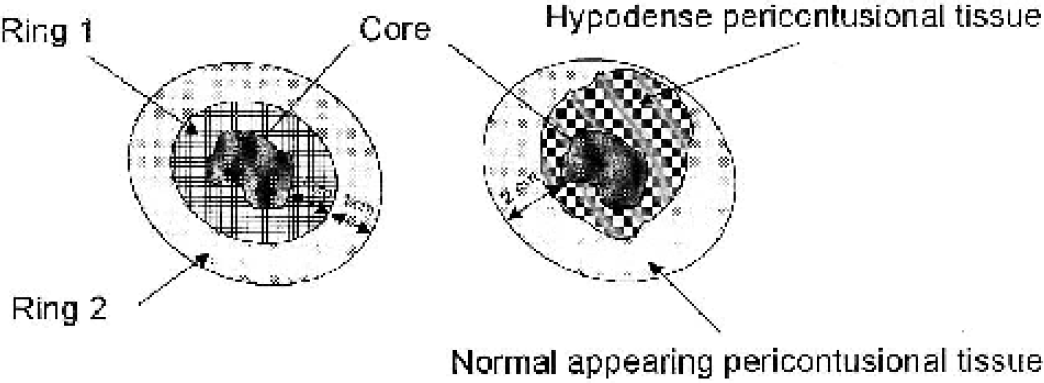
Schematic illustration of ROIs. (Left side) Three ROIs were defined: the core of the lesion, ring 1 (an inner ring of 1-cm width around the core), and ring 2 (an outer ring of 1-cm width around ring 1). (Right side) In a further step, within the larger ellipse and excluding the core, two ROIs were defined: areas with normal density on CT and hypodense (oedematous) areas. ROIs, regions of interest; CT, computed tomography.
Statistical methods
Data are reported as mean ± SD except when otherwise stated. SPSS 11.0 for Windows was used for all calculations (SPSS Inc., Chicago, IL, U.S.A.). Comparisons between baseline and measurements obtained at the higher CPP were made using paired t-tests. Two-way analysis of variance was used to compare measurements between ROIs. Tukey's honest significant difference test was used for post hoc comparisons.
RESULTS
Physiologic variables
In 18 patients, 18 contusions were analyzed. Because of cyclotron failure, there are no CBV data at the higher CPP level in one patient; therefore, analysis of CBV changes is based upon 17 patients. Patients (2 women, 16 men) were aged 18 to 64 (32 ± 13) years and examined 1 to 4 (2.7 ± 0.9) days after injury. Median admission GCS was 6.5 (range 3 to 10). The baseline and intervention scans were performed at a CPP of 69 ± 5 mmHg and 91 ± 4 mmHg, respectively. Baseline PaCO2 was 4.43 ± 0.27 kPa; at the higher CPP, PaCO2 was 4.51 ± 0.32 kPa. Although this difference (0.09 ± 0.13kPa) is statistically significant (P < 0.05), it is smaller than the precision of the blood gas analyzer. Temperature at baseline was 35.1 ± 0.7°C; at the higher CPP, it was 35.3 ± 0.7°C. Again, the difference is statistically significant (P < 0.05) but unlikely to be clinically relevant. The combination of a slight increase in PaCO2 and temperature may have led to a minor overestimation of increases in CBF and CBV.
Baseline CBF and CBV
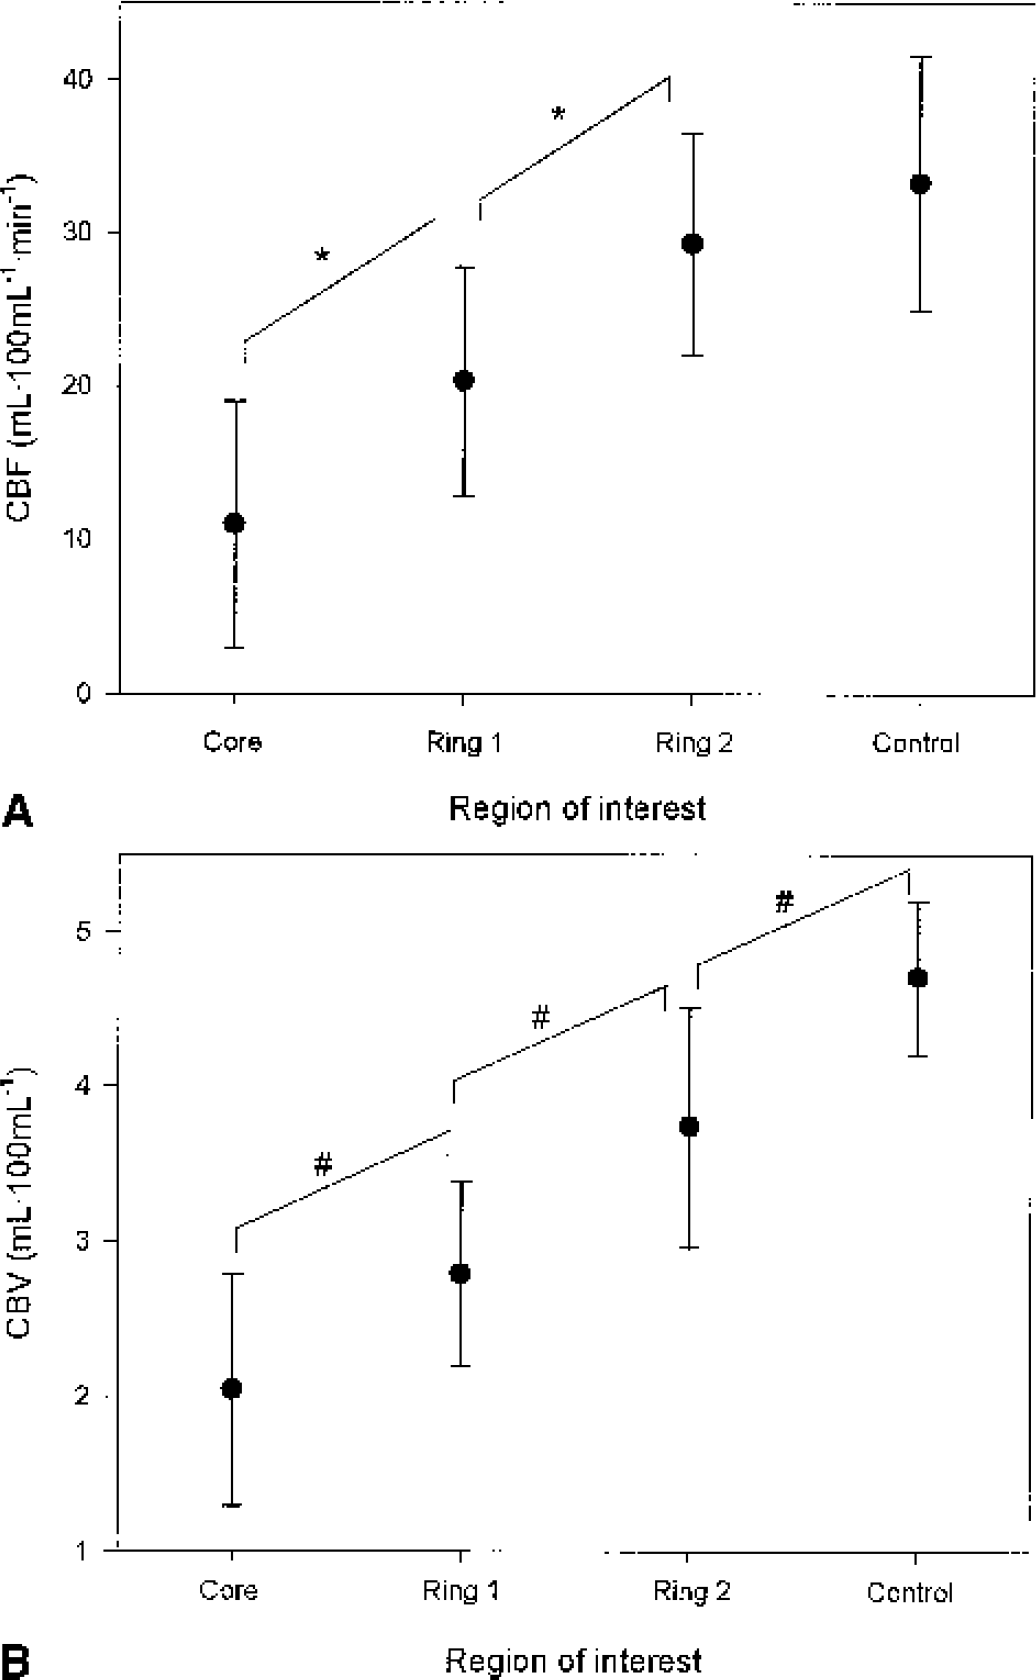
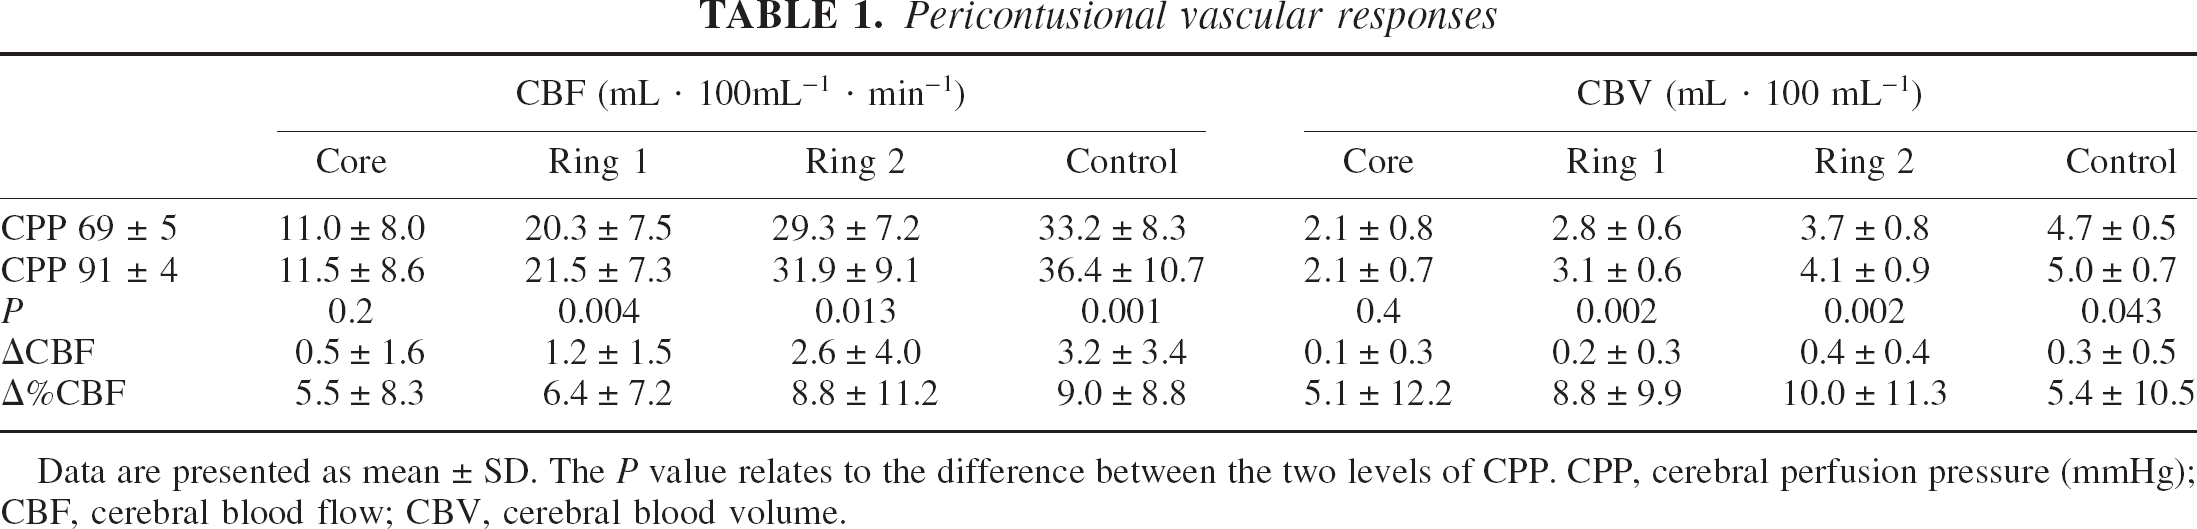
The volume of the cores ranged from 0.25 mL to 44.5 mL (13 ± 13 mL). There was a significant inverse relationship between core volume and baseline CBF and CBV within the core (r = −0.54, P = 0.02 and r = −0.49, P = 0.04, respectively). For the other ROIs, this correlation was not significant. On average, we found low contusional CBF and CBV but with considerable variability (range core: 3.2 to 31.2; inner ring: 8.4 to 35.6; outer ring: 15.7 to 39.5; control: 22.5 to 52.5 mL·100mL−1·min−1) (Fig. 2). Within the outer tissue ring, CBF was comparable with values measured in the normal appearing parietal lobe, whereas CBV in this ROI was still significantly lower than in the control ROI. CBF and CBV data are shown in Table 1.
Pericontusional vascular responses
Data are presented as mean ± SD. The P value relates to the difference between the two levels of CPP. CPP, cerebral perfusion pressure (mmHg); CBF, cerebral blood flow; CBV, cerebral blood volume.
Response to the increase in global CPP
Absolute changes in CBF and CBV are shown in Table 1. The comparisons between the different ROIs for CBF are presented in Fig. 3. The largest absolute increases of CBF were found in the normal-appearing control ROI (Fig. 3). Overall, the increase in CBF was small despite the substantial increase in CPP. The pattern for CBV is less clear: the only significant difference in the change in CBV was found between the core and the outer tissue ring (P = 0.02). Overall, we found a weak relationship between the change in CBF and that in CBV (r2 = 0.08, P = 0.02). However, this was not confirmed for the individual ROIs (Fig. 4).
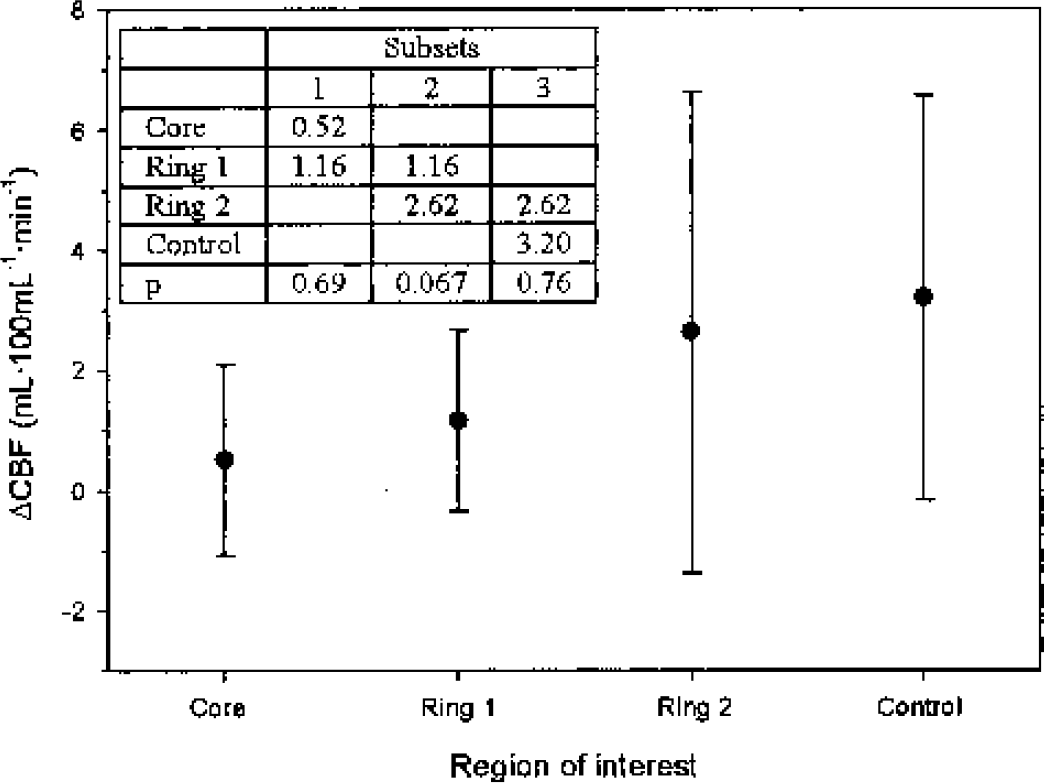
Absolute change in CBF induced by an increase in perfusion pressure. Data are shown as mean ± SD. Core: core of the contusion; Ring 1: an elliptic tissue ring 1-cm width placed around the core; Ring 2: an elliptic tissue ring 1-cm width, placed concentrically around Ring 1; Control: a large region of interest (140 mL) in tissue appearing as normal on conventional computed tomography scans in the uninjured hemisphere. Overall the observed regional changes in CBF were small despite a considerable (20 mmHg) increase in global cerebral perfusion pressure. The insert shows the change in CBF for the homogeneous subsets calculated by Tukey's test. CBF, cerebral blood flow.
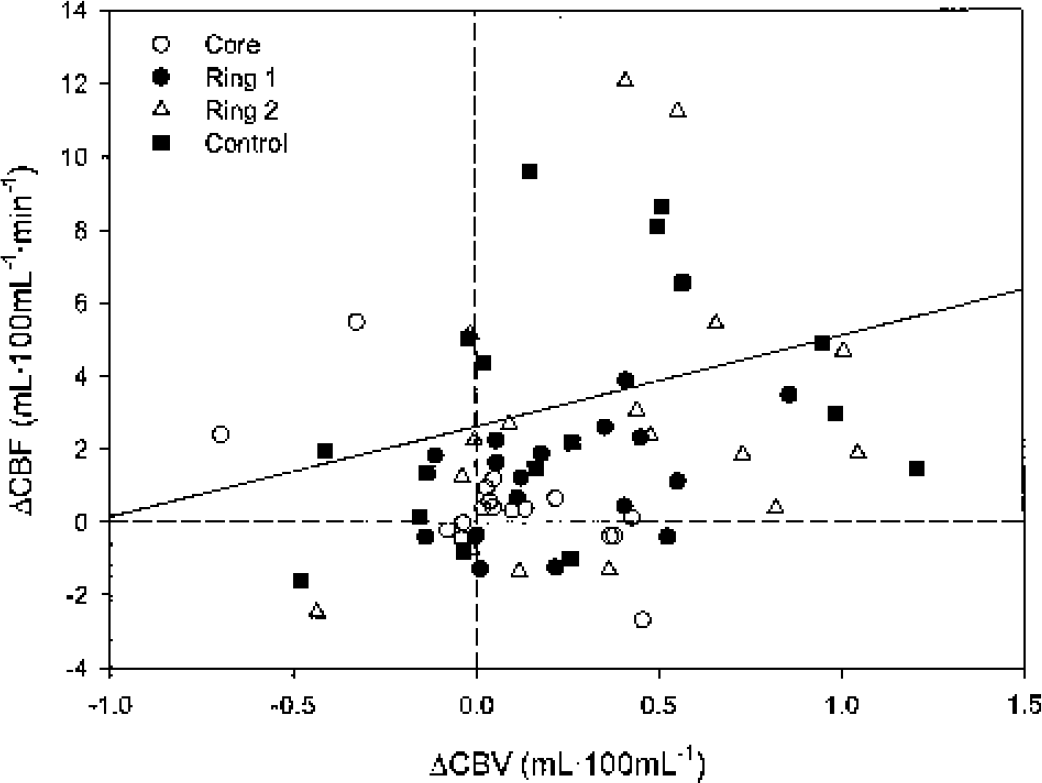
Change in CBF and CBV. Absolute changes in CBF are plotted against absolute changes in CBV. Core (open circles): core of the contusion; Ring 1 (filled circles): an elliptic tissue ring 1-cm width placed around the core; Ring 2 (open triangle): an elliptic tissue ring 1-cm width, placed concentrically around Ring 1; Control (filled square): a large region of interest (140 mL) in tissue appearing as normal on conventional computed tomography scans in the uninjured hemisphere. A wide range of responses in CBF and CBV was observed. Whereas there was a significant overall correlation (r2 = 0.08, P = 0.02), there was no typical pattern for any group of ROIs. CBF, cerebral blood flow; CBV, cerebral blood volume; ROIs, regions of interest.
Assessment of regional perfusion pressure and autoregulation
The CBF/CBV ratio was significantly lower (P < 0.001) in the core than in all other ROIs (CBF/CBV ratio 5.1 ± 2.5, 7.3 ± 2.2, 7.9 ± 1.9, and 7.1 ± 1.6 for core, inner ring, outer ring, and control ROI, respectively). However, the increase in CPP did not translate into significant increases in the CBF/CBV ratio in any ROI. In view of the limited but significant increases in CBF and CBV, in most ROIs this questions the usefulness of this ratio for determination of local perfusion pressure in pericontusional and even normal-appearing tissue after head injury. We are therefore not able to draw any reliable inference about regional perfusion pressure. As the change in CPP was comparable in all patients, we decided to estimate autoregulation based upon the observed percent change in CBF, accepting the limitation that we are not able to exclude the effects of false autoregulation. There were no significant differences in the relative changes in CBF between any of the ROIs (Table 1).
Effects of pericontusional oedema
Finally, we also examined whether hypodense, oedem-atous pericontusional tissue reacted differently to the increase in CPP than normodense, pericontusional tissue. CBF and CBV were significantly lower in the hypodense ROI at both CPP levels (Table 2). Cerebral blood flow and CBV increased significantly in both regions. However, the increase in CBF and CBV was not significantly different between the two regions (Table 2).
Oedematous and nonoedematous pericontusional tissue
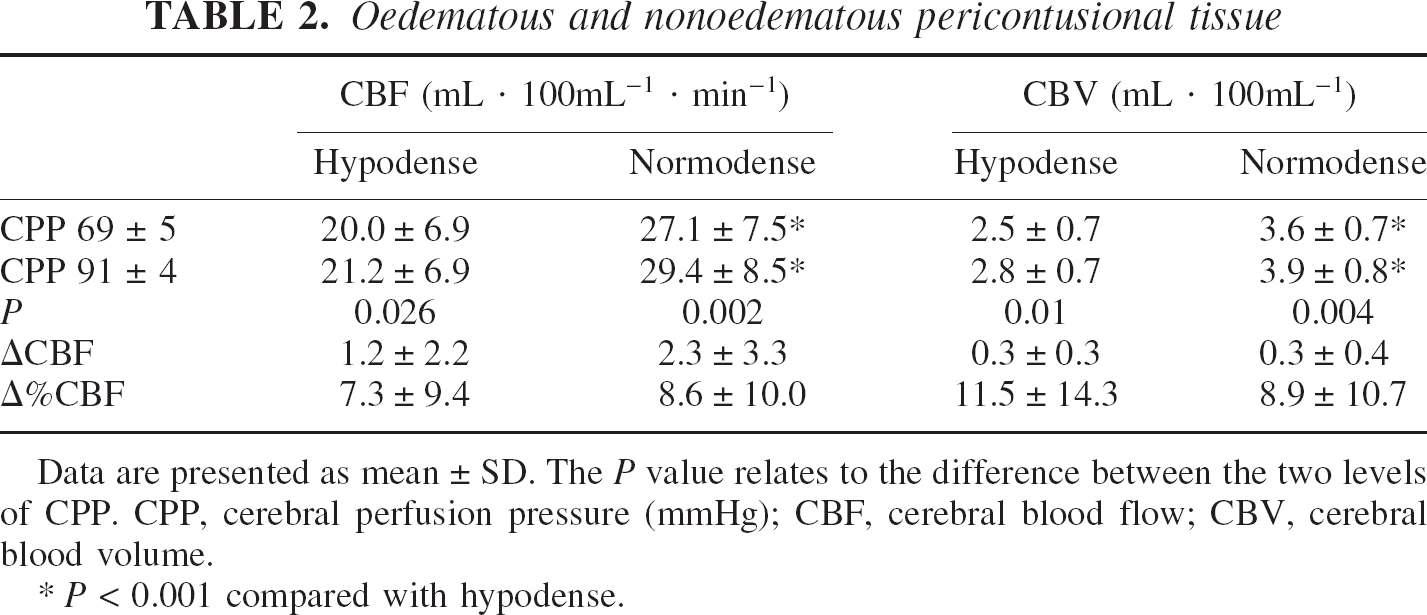
Data are presented as mean ± SD. The P value relates to the difference between the two levels of CPP. CPP, cerebral perfusion pressure (mmHg); CBF, cerebral blood flow; CBV, cerebral blood volume.
P < 0.001 compared with hypodense.
DISCUSSION
We found limited increases in regional CBF around contusions in response to a considerable increase in CPP of 20 mmHg. The largest increases were observed in tissue in a control ROI with normal CT appearance situated in a distinctly different area of the brain. Our data suggest that autoregulatory efficiency when compared with normal appearing tissue is not significantly different in pericontusional ROIs with or without oedema.
Methodologic limitations
Despite our attempts to control PaCO2 and temperature during PET scanning, there were small increases in both parameters between the first and second scan, possibly caused by a β-adrenergic effect of norepinephrine. However, both these factors would lead to an overestimation of the observed changes and are, in view of the small changes we found, not likely to have influenced the interpretation of our results.
In this study, partial volume error will lead to overestimation of CBF and CBV in the core and underestimation of these parameters in the pericontusional area. Relatively large regions were chosen to limit the influence of partial volume error. Based upon phantom data (Videen et al., 1999) and the resolution of our images (FWHM: 6 mm), this error is likely to be 10% to 15%. However, as the simulation quoted above was based upon a CBF of zero within an intracranial haematoma, the error is likely to be smaller. Furthermore, the main emphasis of this paper is the assessment of changes in CBF and CBV, and these will be less sensitive to partial volume error than the absolute values.
The comparison of pericontusional measurements with a control value will obviously depend upon the ratio of gray and white matter that is included in any ROI. The lack of gray-white contrast in pericontusional tissue makes any segmentation of these two tissue compartments based upon structural imaging impossible, but the location of lesions in most cases suggested a preponderance of white matter in the perilesional ROI. Consequently, we decided to use a control ROI with a relatively high white matter content. CBF values, for instance, for an occipital ROI would have been higher, albeit without changing the conclusions of our study.
Furthermore, PET has an inherently low signal-to-noise ratio. Therefore, the issue of repeatability of PET scans needs to be addressed. Application of the technique as described above results in an SD of 1.9 mL·100mL−1·min−1 and 0.1 mL·100mL−1 for repeated measurements of CBF and CBV, respectively, within large ROIs in patients with head injuries (unpublished data). Therefore, small changes in CBF or CBV are likely to be more affected by noise than large changes.
Interpretation of results
The addition of CBV data to CBF can help to explain some of the observations. The changes in CBV reflect venous and arterial blood volume and the changes we observed cover the entire spectrum of possible changes in all categories of ROI. Figure 4 shows the range of vascular responses. Some ROIs follow the expected pattern of autoregulation, that is, a decrease in CBV combined with relatively constant CBF in the case of intact autoregulation or an increase in CBV in conjunction with an increase in CBF in the case of failing autoregulation. However, a large number of data points do not fit into this pattern. Constant CBV combined with constant CBF despite the increase in CPP could also indicate that regional perfusion pressure does not change or could be interpreted as false autoregulation, a situation where local tissue pressure increases in parallel with intravascular pressure. It has been shown that the compliance of oedematous brain tissue is altered (Kuroiwa et al., 1994; Whittle et al., 1990). Therefore, comparable increases in intravascular pressure may result in similar vascular responses but result in varying changes in CBV because of different regional tissue pressures in oedematous and nonoedematous tissue. However, the same scenario (constant CBV and constant CBF) could also be found when blood volume is redistributed from the arterial into the venous compartment or vice versa or if the vascular bed is occluded. On the other hand, an increase in CBV in conjunction with constant CBF could represent distal obstruction on the level of the larger veins. We have also found the combination of an increase in CBV and a decrease in CBF, which could possibly be caused by steal. Finally, the combination of decreasing CBV with increasing CBF could be caused by an increase in perfusion pressure that shifts the ROI onto the plateau of the autoregulatory curve. Whereas it is possible to map changes in CBF and CBV, it is not possible to map autoregulation because of the uncertainties over regional perfusion pressure and regional tissue pressure.
Clinical implications
The concept that CBF will increase in pericontusional tissue where autoregulation is assumed to be disturbed, but not in normal-appearing tissue where autoregulation is intact, is not confirmed by our data. In contrast, our data are in agreement with preliminary data showing that disturbance of autoregulation is not restricted to areas with CT evidence of tissue destruction (Steiner et al., 2002) and is therefore possibly a diffuse “global” rather than a restricted “regional” consequence of traumatic brain injury. CT is not an appropriate tool to demonstrate the extent of vascular dysfunction after head injury. There is direct support for these findings from recent animal work showing abnormal autoregulation in histologically normal periischemic tissue with normal CBF (MacGregor et al., 2000) and indirect support from animal data showing proximal increases in vascular resistance after mild cortical impact injury (Golding et al., 2003).
The increase in CBF that we observed in pericontusional tissue was modest, despite a substantial increase in CPP. Maintaining CPP at 90 mmHg over an extended period of time will not be possible in many patients and is potentially dangerous (Contant et al., 2001). Taken together, this suggests that aggressive CPP augmentation in patients with traumatic contusions may be of limited benefit. Our data do not allow for drawing any conclusions as to the survival of tissue with CPP elevation. Values for irreversible ischemia and penumbra have not been established for patients with head injuries. Applying thresholds for irreversible ischemia and penumbra measured in unsedated stroke patients in the context of head injury is problematic. Based upon previous work in stroke patients, CBF below the threshold of reversible ischemic damage (8.4 mL·100mL−1·min−1) (Marchal et al., 1999) was found in 50% of our patients in the core, but in no other ROIs. CBF within the CBF range of the penumbra (> 8.4 but ≤ 17 mL·100mL−1·min−1) (Furlan et al., 1996) defined again in stroke patients was found in seven patients in the core, in seven patients in the inner ring, and in one patient in the outer ring. In no core did the increase in CBF shift the tissue from irreversible ischemia to penumbra or from penumbra to adequate perfusion, as defined above. Three patients in whom CBF in the inner ring had been in the penumbral range were shifted from the penumbra to adequate perfusion. The single patient with CBF in the penumbral range in the outer ring was shifted to adequate perfusion. However, the clinical value of these changes is unclear, and any interpretation varies with the thresholds that are used. Other authors have used 18 or 20 mL·100mg−1·min−1 as a threshold for a critical reduction in CBF (Bouma et al., 1992; Furuya et al., 2003). Measurements of the cerebral metabolic rate for oxygen or possibly PET studies using 11C-flumazenil as a marker of neuronal viability may clarify the issue of tissue viability.
Footnotes
Acknowledgment
M. Czosnyka is on unpaid leave from the Warsaw University of Technology, Poland.