
Abstract
The purpose of this study is to investigate errors in quantitative analysis for estimating dopamine D2 receptor occupancy of antipsychotics with agonist radioligand [11C]MNPA by numerical simulation, with particular attention to the validity of a quantitative approach based on the use of a reference region. Synthetic data were validated using clinical data combined with a bootstrap approach. Time–activity curves (TACs) of [11C]MNPA were simulated, and the reliability of binding potential (BPND) and occupancy estimated by nonlinear least square (NLS) fitting and a simplified reference tissue model (SRTM) were investigated for various noise levels and scan durations. In the human positron emission tomography (PET) study with and without antipsychotic, risperidone, the uncertainty of BPND and occupancy estimated by SRTM was investigated using resampled TACs based on bootstrap approach with weighted residual errors of fitting. For both NLS and SRTM, it was possible to have <3% of bias in occupancy estimates of [11C]MNPA by 60 mins. However, shortened scan duration degrades the quantification of very small binding potentials, especially in case of SRTM. Observations were replicated on the clinical data. Results showed that dopamine D2 receptor occupancy by antipsychotics can be estimated precisely in region of interest analysis by SRTM with a longer than 60-min [11C]MNPA PET scan duration.
Introduction
The dopamine D2 receptor exists in both high- and low-affinity states, and the state of high affinity for endogenous dopamine is defined as the functionally active form of the receptor. To determine the binding to the high-affinity state of dopamine D2 receptors, agonist ligands have been developed (Jones et al, 1984; Neumeyer et al, 1973). It has been reported that [11C]-(R)-2-CH3O-
The dopamine D2 receptor is a main therapeutic target in schizophrenia, and most antipsychotics have an antagonistic action toward dopamine D2 receptors. Occupancy of dopamine D2 receptors evoked by competition from antipsychotic medication can be estimated from the reduction in the observed binding potential (BPND) (Farde et al, 1988; Farde et al, 1990). Several quantitative methods have been proposed for estimating BPND, and a simplified reference tissue model (SRTM) (Lammertsma and Hume, 1996) has often been used. The SRTM uses as input the time activity of a reference brain region with negligible specific binding and therefore avoids arterial blood sampling. As an occupancy study requires two PET scans, elimination of arterial blood sampling by SRTM method has practical appeal.
Otsuka et al (2009) showed that the SRTM method can be applied to human [11C]MNPA for quantitative BPND estimation; however, a precise quantitative evaluation of the SRTM method for occupancy studies with [11C]MNPA has not yet been performed. However, error analysis is important to ascertain whether the variability in occupancy with antipsychotics measured [11C]MNPA is truly biological or generated by the PET measurement system. In this regard, Yokoi
In this study, we simulated and evaluated errors in the quantitative analysis for the estimation of dopamine D2 receptor occupancy when measured with [11C]MNPA with particular attention to the use of SRTM. The effect of scan duration on the error of estimates was also evaluated, because shorter scan duration reduces patient's burden. Tissue kinetics where simulated using a compartmental model and, to assess model validity, we compared the results of the simulations with the errors obtained from clinical data by use of a resampling technique.
Materials and methods
Kinetics of [11C]MNPA
The kinetics of [11C]MNPA in the brain is based on the two-tissue three-compartment model as follows:
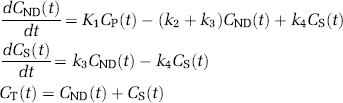
where
Estimation of receptor occupancy
Nonlinear least squares fitting for BPND:
where (
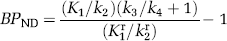
Simplified reference tissue model for BPND:
The SRTM yields the binding potential value by eliminating the arterial input function,
where
Receptor occupancy:
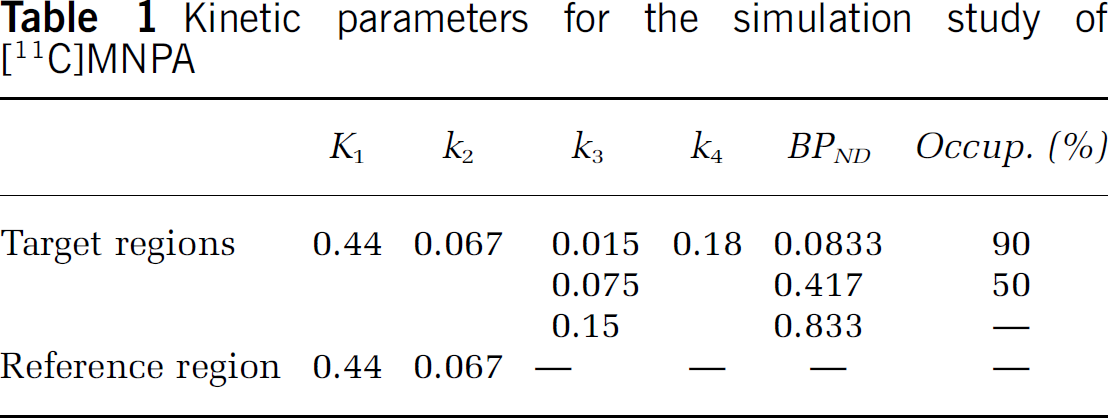
Receptor occupancy is calculated from BPND of two scans, with and without antipsychotics, as follows:

where BPcontrol represents the BPND value derived from a scan without drug and BPdrug represents that from a scan with drug (Farde et al, 1988).
Simulation study
To evaluate the dependency of the noise level and scan duration for the estimated BPND and occupancy, we performed the following simulations. Both NLS and SRTM procedures were performed using in-house software written in the C program with downhill simplex algorithm (Nelder and Mead, 1965) without weighting and without constraints for the range of estimated parameters.
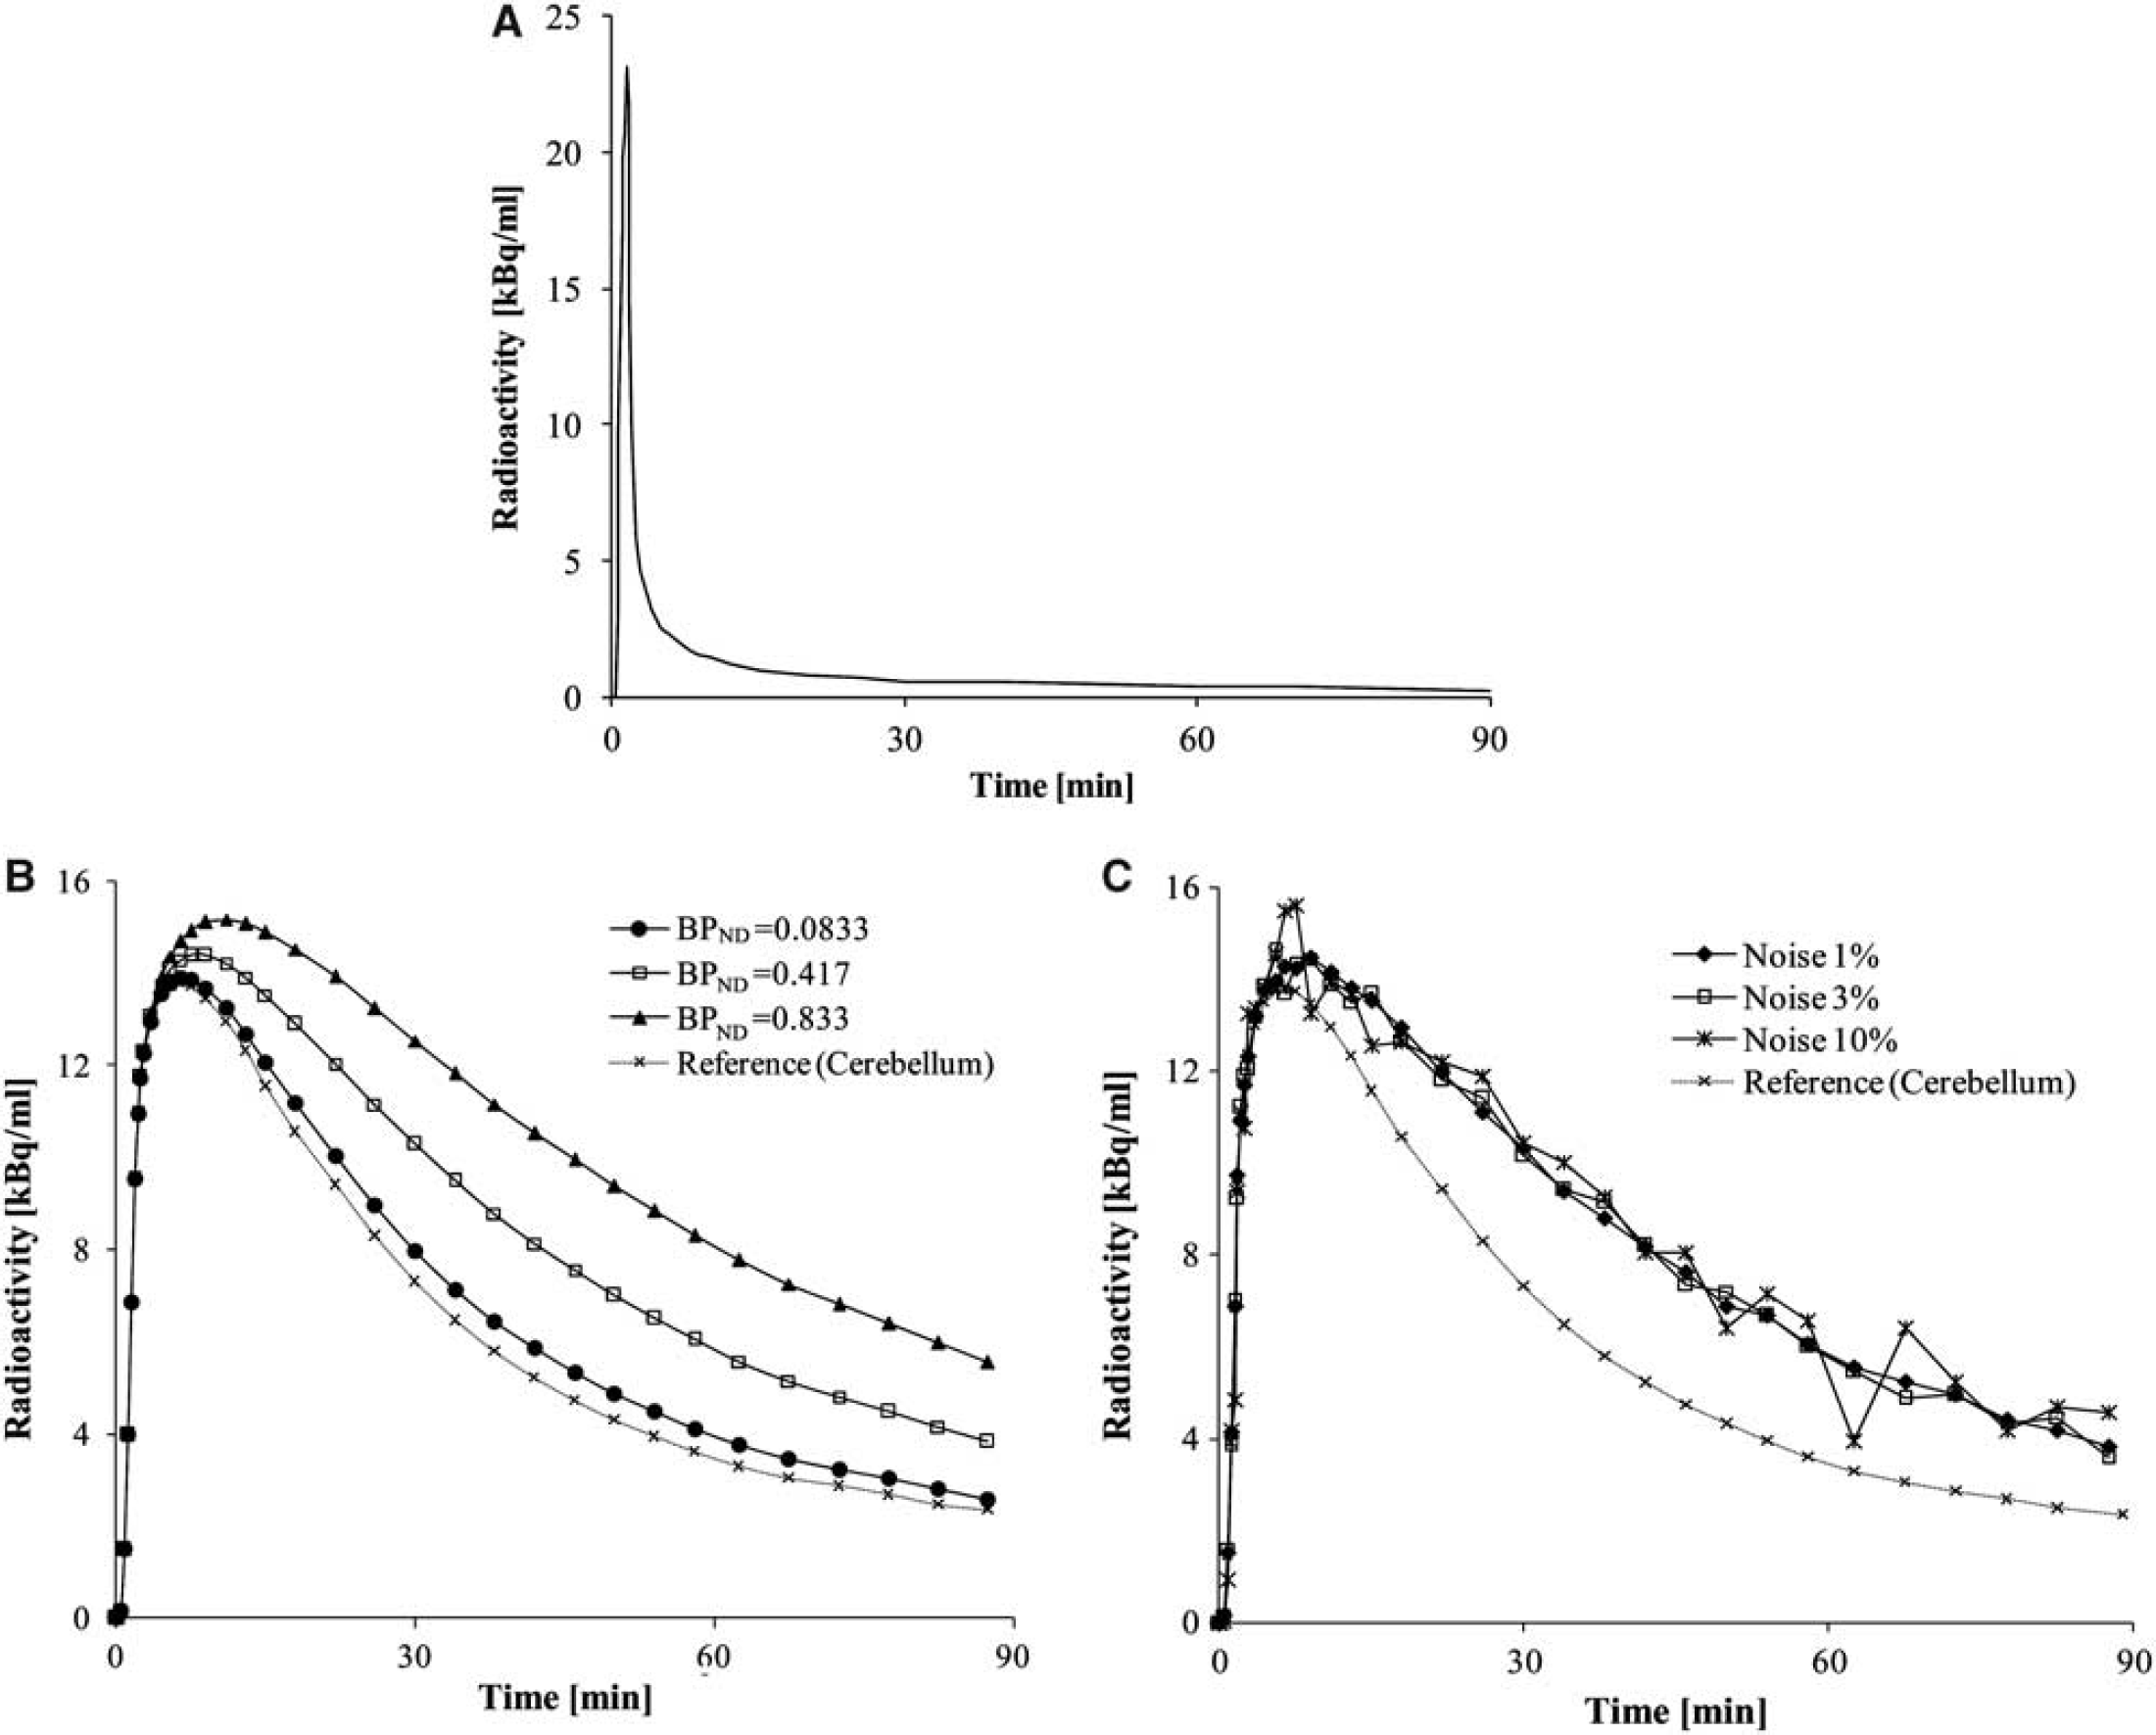
Time-activity curves for [11C]MNPA:
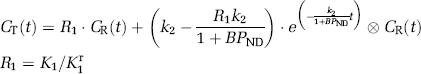
A dynamic tracer concentration for [11C]MNPA was derived from the kinetic parameters listed in Table 1 with a dynamic frame (20 secs × 9, 1 min × 5, 2 mins × 4, 4 mins × 11, 5 mins × 6, total 90 mins) and a measured arterial input function (10 secs × 12, 30 secs × 2, 60 secs × 7, 120 secs × 1, 180 secs × 1, 300 secs × 3, 600 secs × 6, total 90 mins) of a single subject obtained by Otsuka et al (2009). These
Kinetic parameters for the simulation study of [11C]MNPA
(
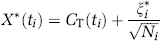
Noise was generated with random generator based on Gaussian distribution and added to the decay-corrected target TACs. The noise ratio for each time frame was determined (Ikoma et al, 2008) according to the collected total count given by
where
Noise level dependency:
Target TACs of [11C]MNPA with several noise levels were generated to investigate the bias and variation of parameter estimates caused by the statistical noise for NLS and SRTM. The bias and variation were calculated as %bias of estimated BPND against the true BPND value and coefficient of variance (COV) by the mean and s.d. of the estimates excluding the outliers, respectively.
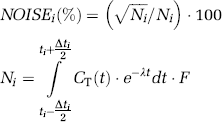
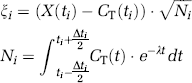
In this simulation study, the noise level for dynamic data was expressed as the mean of percentage noise described in Equation (5) from 1 to 90 mins, and it was chosen so that the mean of percentage noise would be 1%, 3%, 5%, 7%, and 10%, with 500 noisy data sets being generated for each. An example of noise-added simulated TAC with BPND = 0.417 is shown in Figure 1C.
In these noise-added TACs, each kinetic parameter including BPND was estimated by NLS and SRTM with a noise-free reference TAC. For both NLS and SRTM, initial parameters varied by ± 25% from the true value (Ichise et al, 2003; Ikoma et al, 2008), and parameter estimates were considered invalid outliers if estimated parameters were negative or more than three times the true value (Ichise et al, 2003; Ikoma et al, 2008). Occupancy was also calculated from Equation (4) by using estimated BPND with assumed
Scan duration:
The effect of scan duration on BPND and occupancy estimates was investigated for both NLS and SRTM methods. In the 90-min simulated TACs of 3% noise level corresponding to the noise level of human ROI analysis, the duration of the scan used for the parameter estimation was progressively reduced from 90 to 32 mins (32, 44, 60, 75, and 90 mins) for [11C]MNPA.
Human study
Subjects and positron emission tomography procedure:
[11C]MNPA PET studies were performed before and after antipsychotic drug administration of risperidone (0.5 and 2.0 mg) on separate days for each two healthy male volunteers (20 to 21 y.o.). Scan start time after antipsychotic administration was 4h. The study was approved by the ethics and radiation safety committees of the National Institute of Radiological Sciences, Chiba, Japan. Written informed consent was obtained from each subject.
The PET acquisitions were performed on the ECAT EXACT HR+ (CTI-Siemens, Knoxville, TN, USA). A 10-min transmission scan with 3-rod source of 68Ge–68Ga was performed. Dynamic PET scans of [11C]MNPA were performed for 90 mins in three-dimensional mode with a bolus injection of 208.0 to 234.0 MBq. Frame intervals were the same as this simulation study. The specific radioactivity was 245.1 to 313.8 GBq/μmol at the time of injection. Arterial blood sampling was not performed. All emission data were reconstructed by filtered-back projection using a Hanning filter with a cut-off frequency of 0.4.
Data analysis:
The summed PET images for all frames were coregistered to individual MR images, and ROIs were drawn manually over the putamen, caudate, and cerebellum. Especially,
Human data were used to check model validity for the simulation studies. Given that an occupancy is measured only once (two scans for subject) and that repetitive measurements are not usually available, the reliability of parameter estimates can be evaluated by a bootstrap approach with weighted residual errors of fitting as published earlier (Rosso et al, 2009; Turkheimer et al, 1998). For each ROI in each individual subject data, 500 replication TACs were generated using bootstrap approach, and then parameters were estimated by SRTM and the COV of these 500 estimates was calculated to produce an accurate estimate of the statistical variability of the parameters. The weighted residual, ξ, using model-predicted tissue TAC,
Then the residuals, {ξi} (
{ξ*i}. As an example with
In keeping with the simulation study, the relationship between the scan duration and COV of estimates and between the scan duration and bias was investigated by shortening the interval of fitting of the bootstrap replication TACs from 90 to 32 mins. The bias of BPND and occupancy was defined as the difference between the mean of these calculated for each truncated fitting interval and that of the 90 mins. Parameter estimates based on bootstrap approach were considered invalid outliers if estimates from
Results
Simulation study
Noise level dependency:
In the NLS method, the bias of BPND was small especially at a low noise level. However, COV of BPND became larger as the noise level increased (Figure 2A). In the SRTM method, the bias of BPND was observed even though TACs were free from noise and both the bias and COV of BPND became larger as the noise increased, which is typical in the case of small BPND (Figure 2B). For both NLS and SRTM methods, these bias and COV values of occupancy were smaller compared with BPND. The tendency that COV with 90% occupancy was smaller compared with that with 50% occupancy was a common observation for NLS and SRTM.
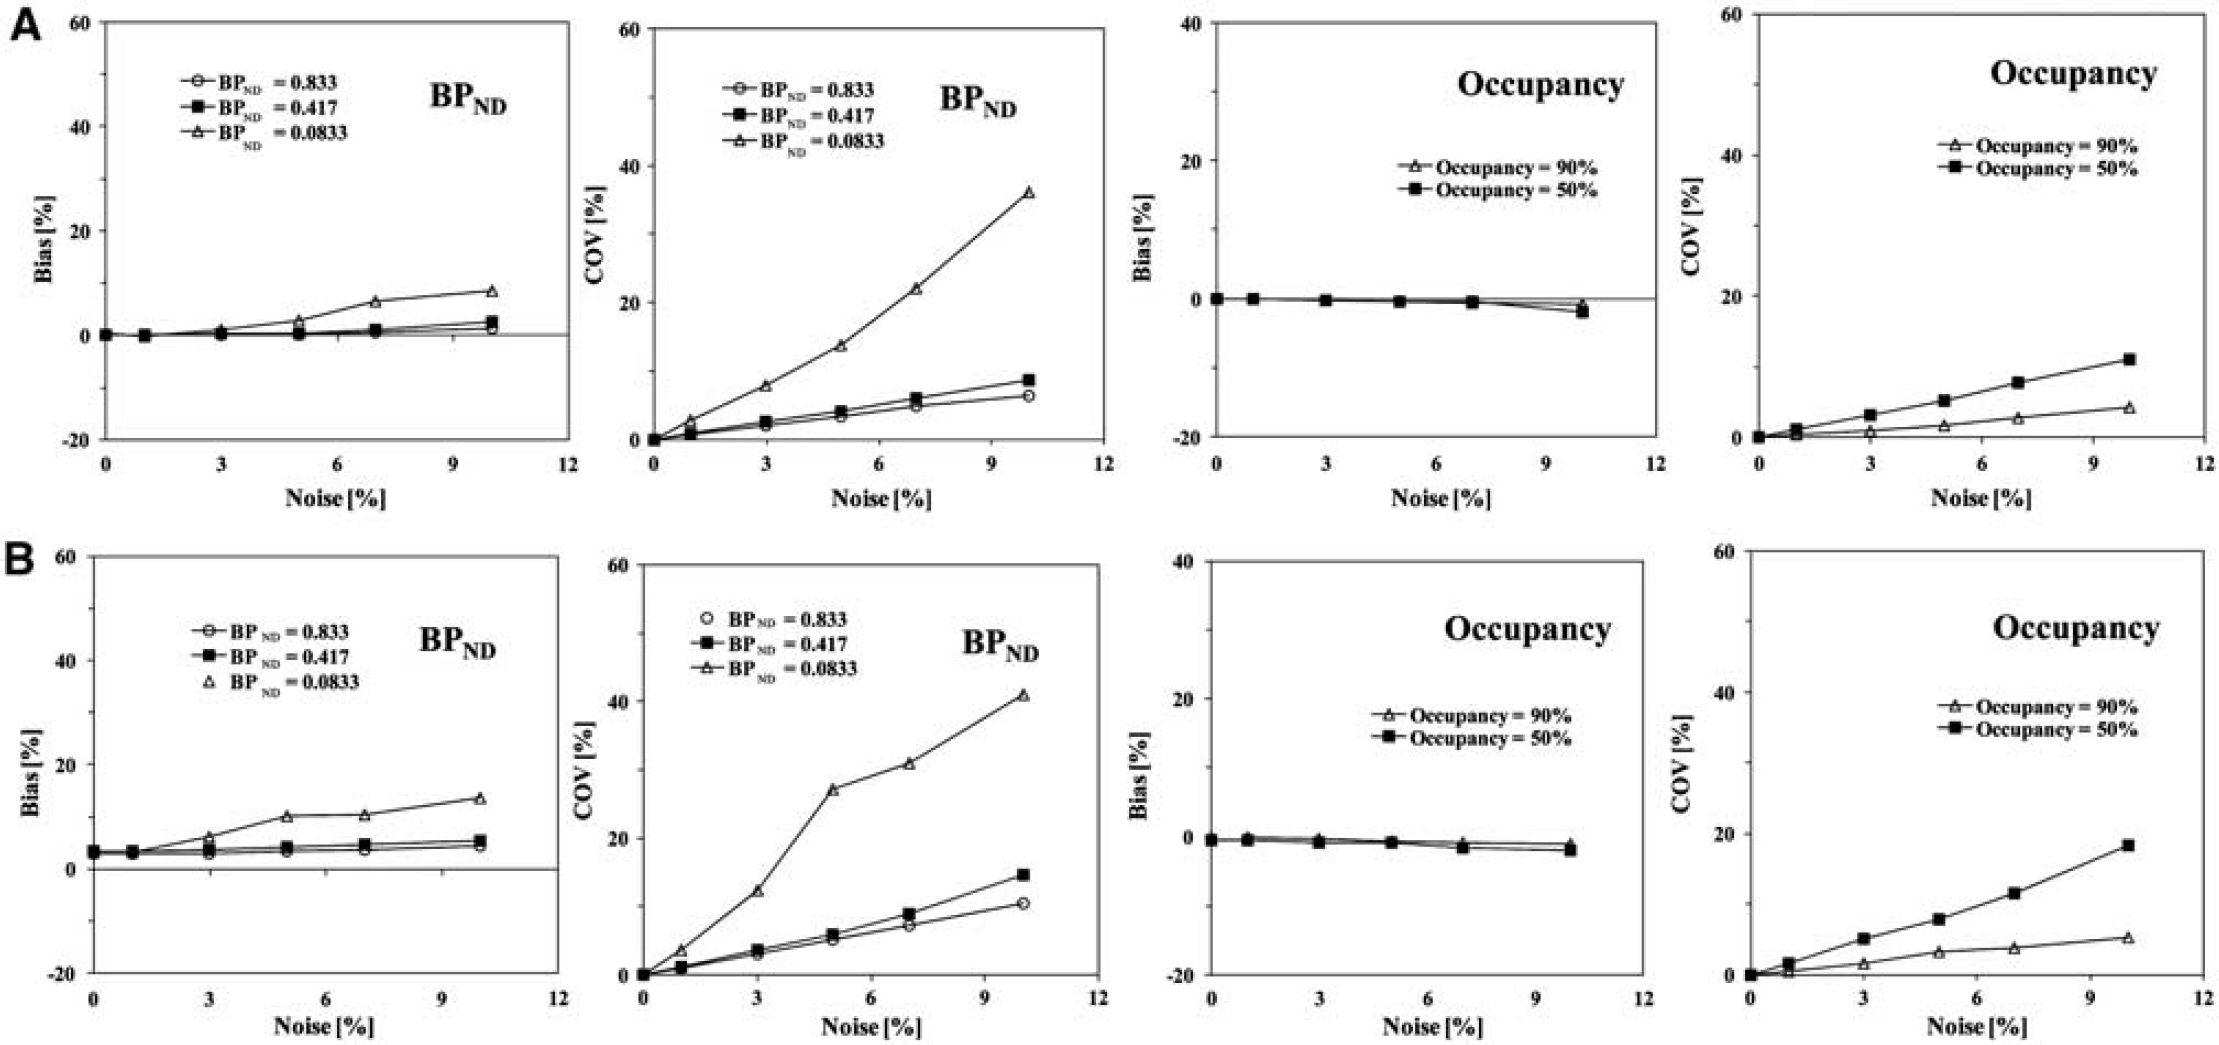
Noise level dependency. (
Scan duration:
The relationship between the reliability of BPND and occupancy estimates and the scan duration was investigated as shown in Figure 3. The bias of BPND and occupancy estimated by NLS was small despite short scan durations (Figure 3A); however, more than 10% outliers was caused with BPND = 0.0833 at 32, 44, 60, 75, and 90 mins (Table 2). As scanning time became shorter, BPND for all three conditions was overestimated by SRTM (Figure 3B) and its bias magnitude was larger than that of NLS. More than 10% outliers was seen with BPND= 0.0833 at 32 and 44 mins, BPND = 0.417 at 32 mins and 0.833 at 32 mins. Bias was under 3% at a 3% noise level with occupancy estimates by SRTM method with scan duration longer than 60 mins (Figure 3B).
Scan duration dependency on the percentages of outliers of BPND at 3% noise level estimated by NLS and SRTM
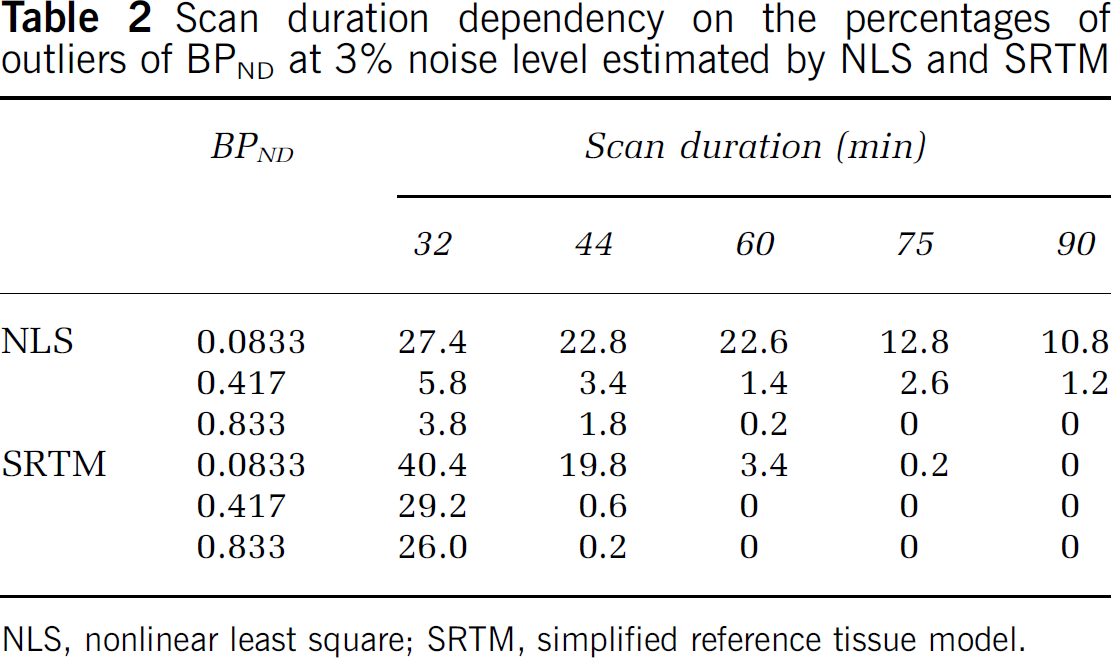
NLS, nonlinear least square; SRTM, simplified reference tissue model.
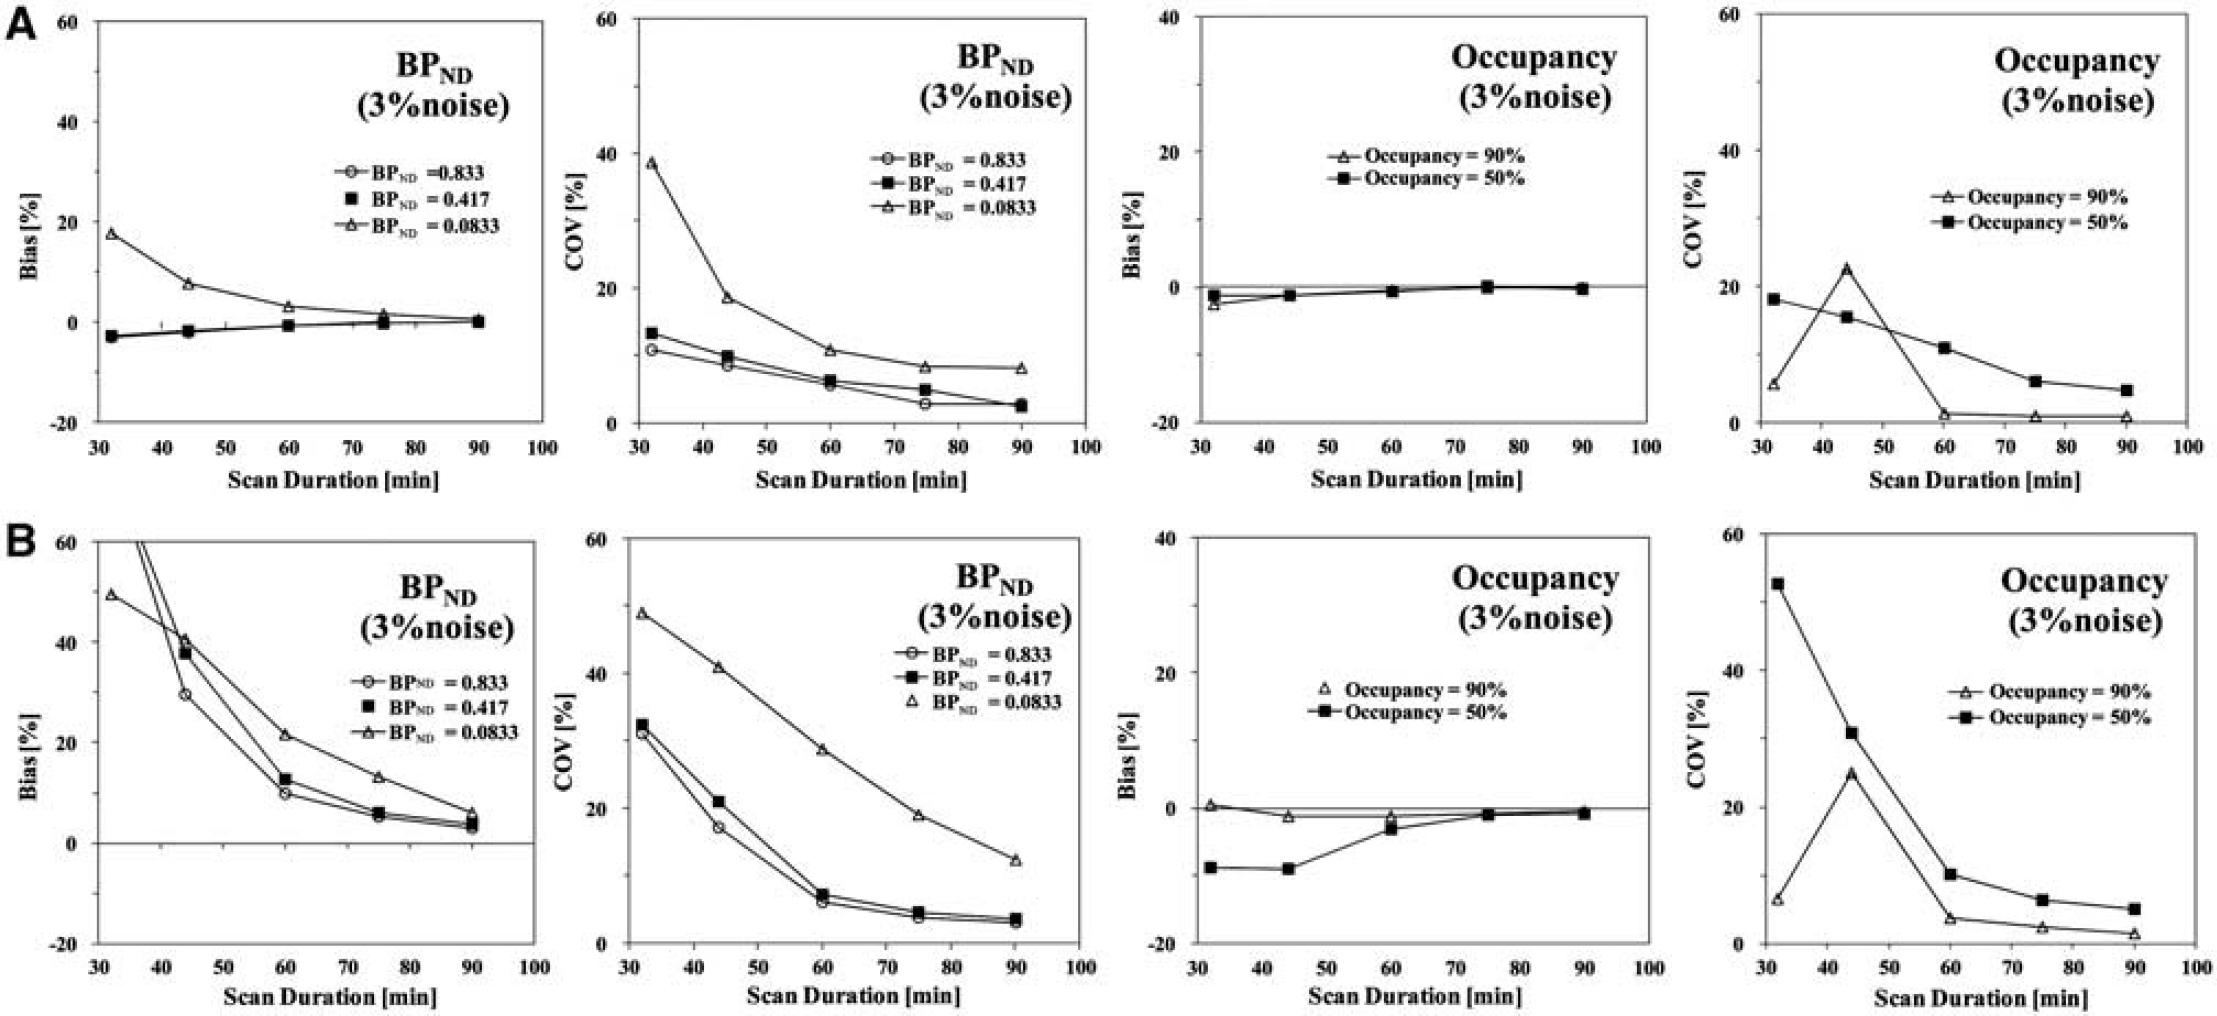
Scan duration dependency of bias and COV of BPND and occupancy at a 3% noise level estimated by (
Human study
Time–activity curves:
As shown in Figure 4, the shape of the TACs was similar between before and after antipsychotic administration in the cerebellum, whereas the accumulation of radioactivity in the postantipsychotic scan decreased at late times in other regions. In Figure 4A and B, estimated BPND in putamen of a subject before and after administration of Risperidone 2 mg were 0.968 and 0.437, then its occupancy resulted in 54.8%. For the other subject shown in Figure 4C and D, estimated BPND in putamen of a subject before and after administration of Risperidone 0.5 mg were 0.866 and 0.496, then its occupancy resulted in 42.7%.
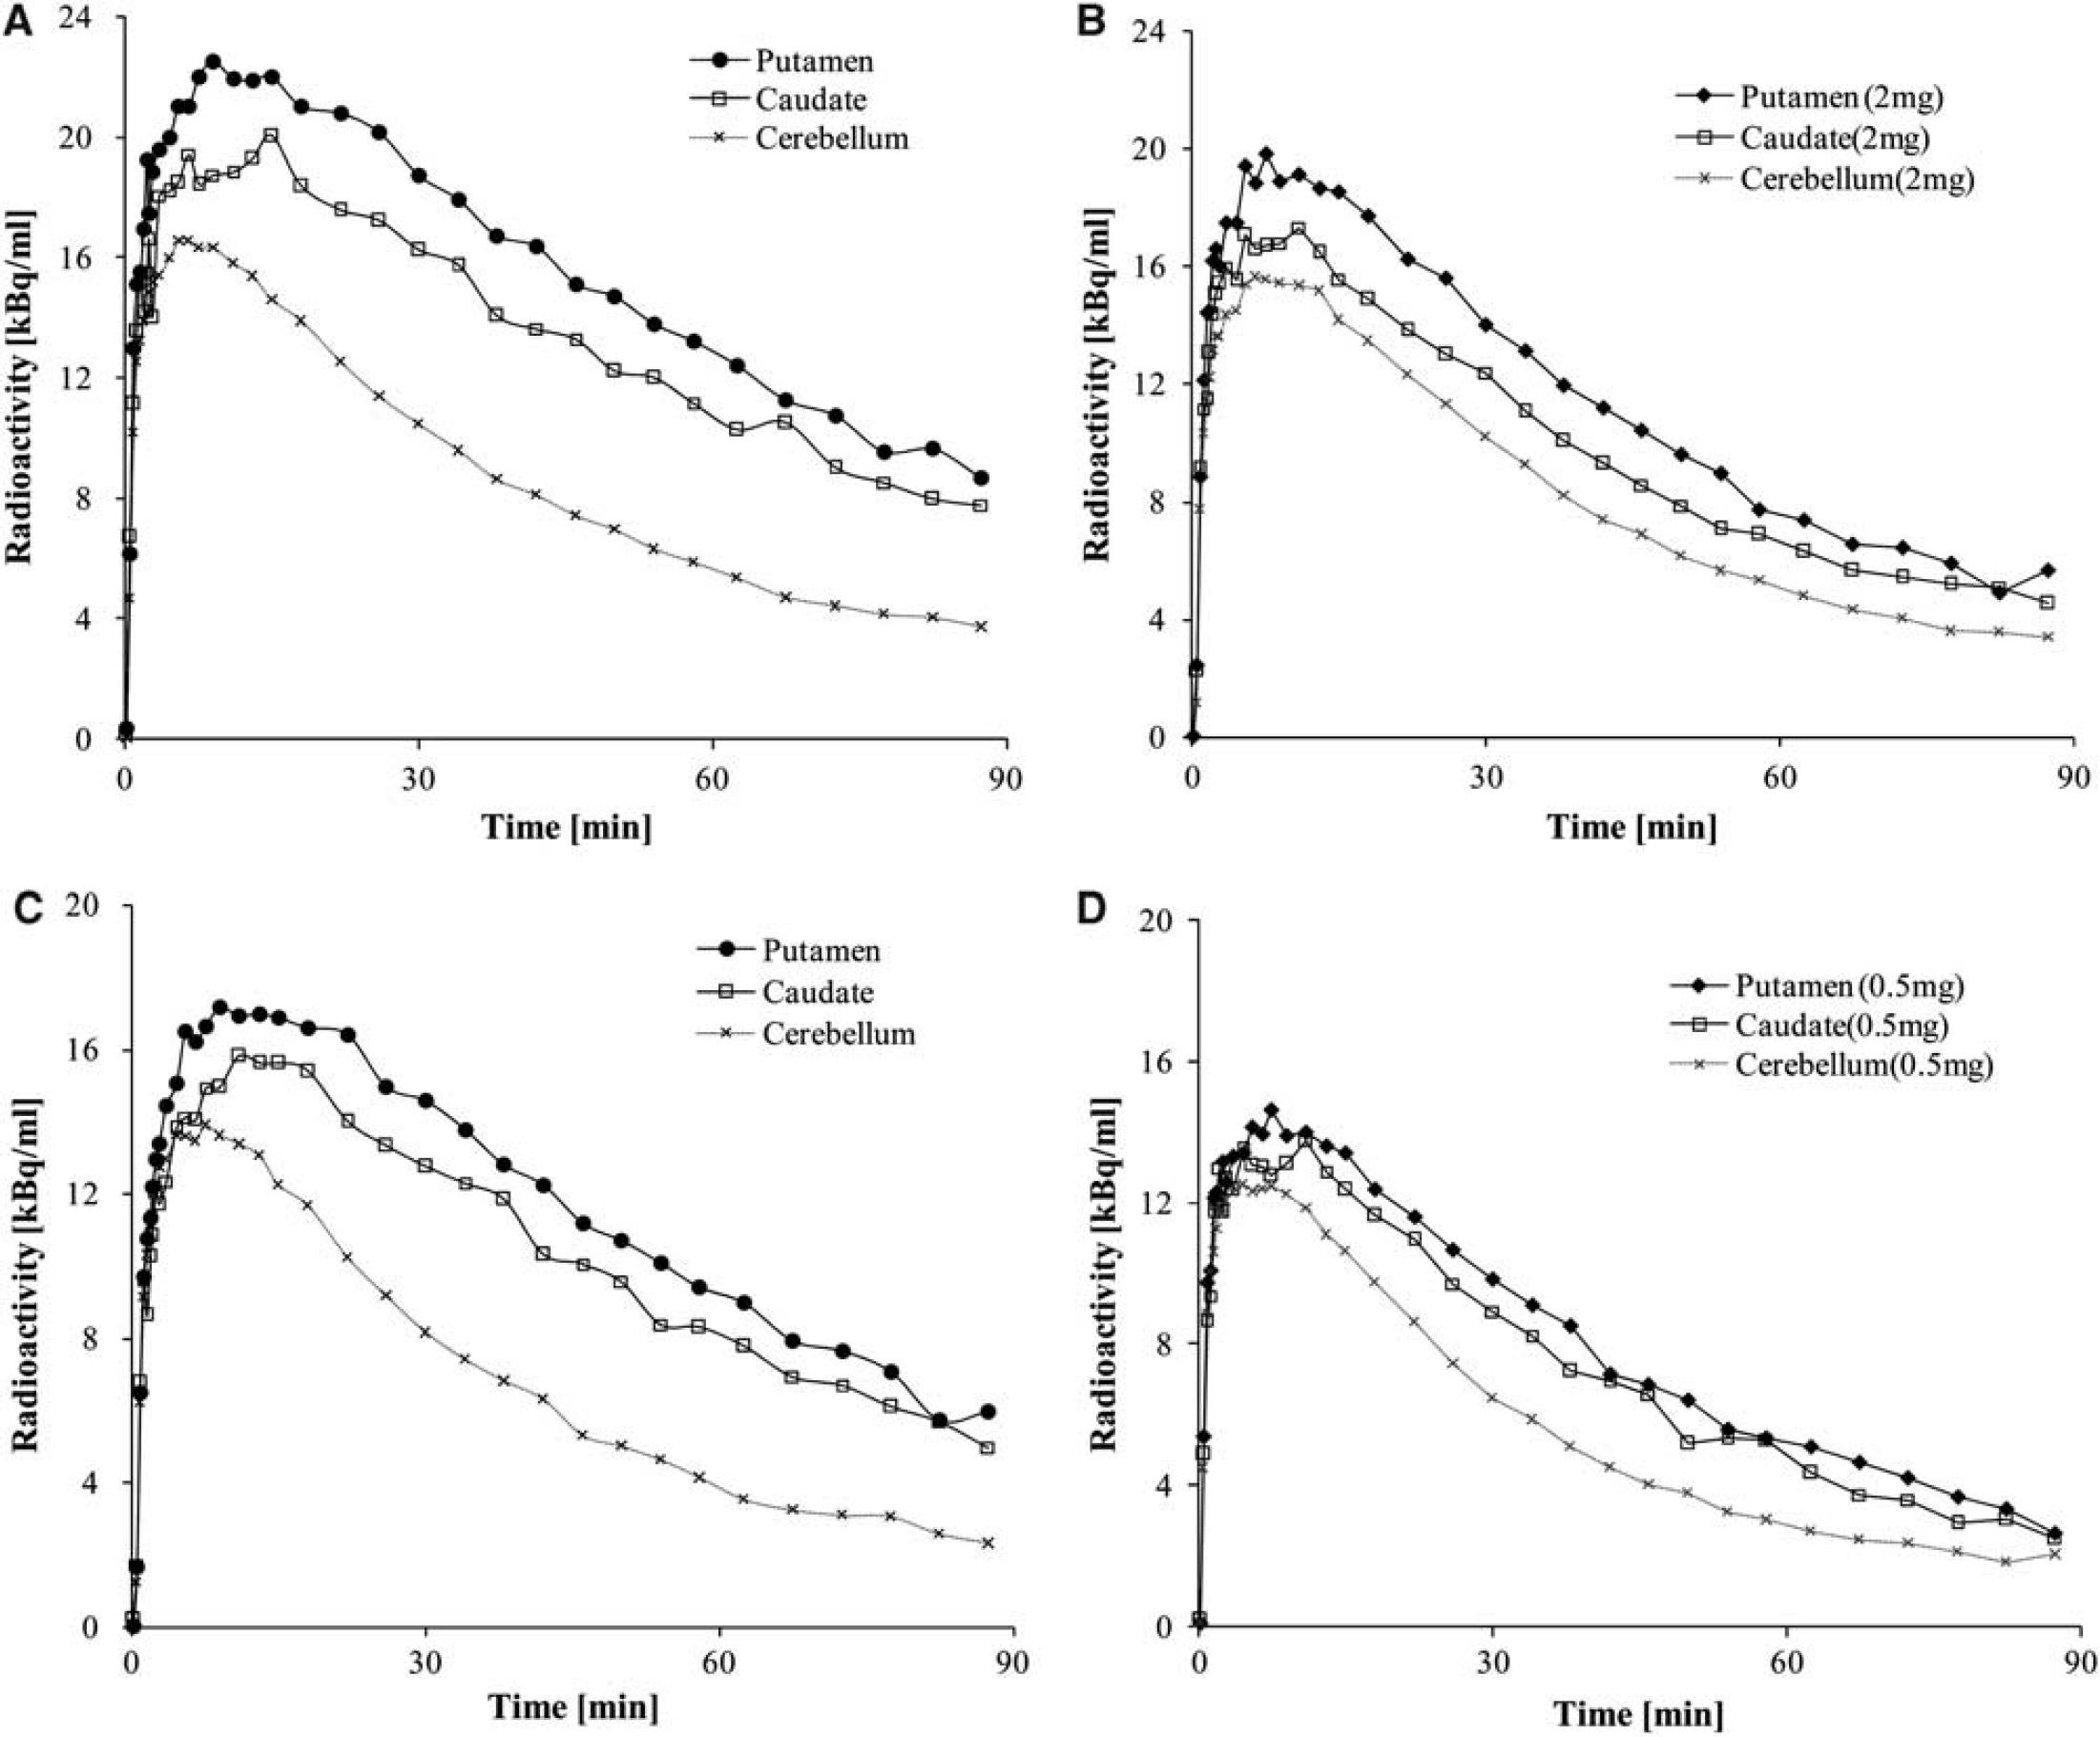
TACs for a single subject with baseline (
Scan duration:
On the basis of the bootstrap approach, the relationship between the reliability of BPND and occupancy estimates and the scan duration was investigated as shown in Figure 5.
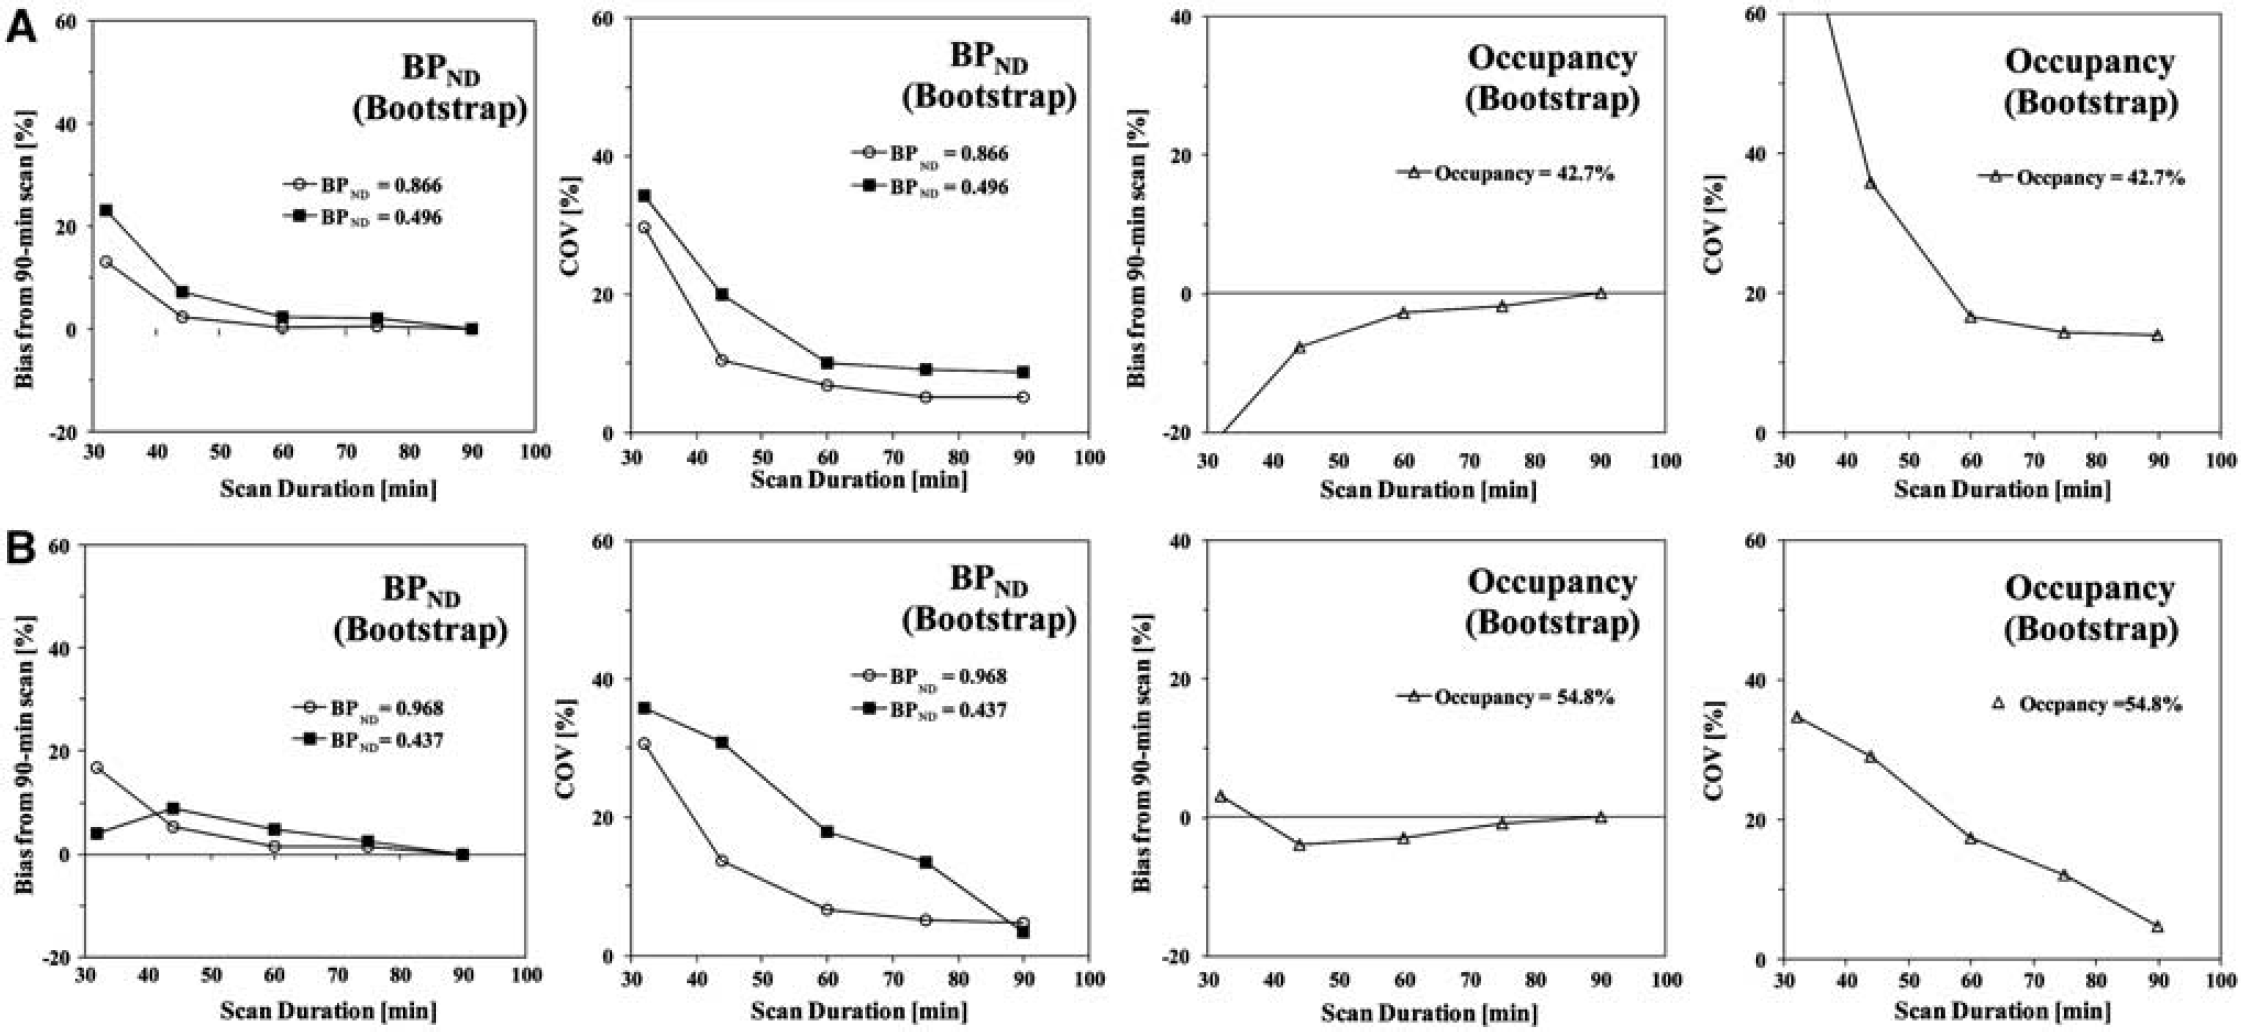
Scan duration dependency of bias and COV of BPND and occupancy in the putamen estimated by SRTM method for a single subject with 0.5 mg administration (
As scanning time became shorter, BPND in both before and after antipsychotics administration for two volunteers was overestimated. However, the bias of occupancy was small despite short scan durations. The COVs of both BPND and occupancy also became larger with shorter scan durations. These observations are consistent with the simulation results especially in the case of occupancy shown in Figure 3B, even though a small difference of magnitude of bias in BPND was still observed.
Discussion
In this study, we evaluated the effect of noise and scan duration of dynamic PET [11C]MNPA studies on the BPND estimates obtained with NLS and SRTM for a range of BPND values, a range that is likely to be encountered in occupancy studies with antipsychotic medication. Error analysis was performed using artificial datasets. The validity of the simulations was assessed by using the bootstrap on a small cohort of human data to calculate ‘real variances’ that resulted in good agreement with those obtained from the artificial datasets.
Reliability of estimated parameters
In the case of NLS, the larger number of parameters introduced instability and, even though we introduced a fixed
The SRTM provided reliable estimates although variability increased for low BPND values even with favorable noise levels (Gunn et al, 1997; Ikoma et al, 2008). As shown in Figure 2B, both bias and COV with small BPND = 0.0833 were larger than those with BPND = 0.417 or 0.833. The small bias of BPND estimates in noise-free TACs (Figure 2B) may originate from the two-tissue model of the target tissue. In the SRTM method, even when the one-tissue model for target tissue is not appropriate, the apparent rate constant (=
In the simulation study, the reference TAC was assumed as noise free; however, noise may affect the reference TAC depending on the size of ROI (Ogden and Tarpey, 2006). For SRTM, the use of a 1% noise on the reference TAC increased %COV of the BPND estimates for the target regions (where noise was 3%) by 20% to 30%. However, the noise in the reference TAC did not change the profile of BPND %COV in the target TAC according to scan duration nor changed the biases in the estimated occupancies that remained similar.
Effects of scan duration
In the simulation study, a 60-min scan duration gave unbiased and reliable BPND and occupancy estimates by NLS with [11C]MNPA both at baseline and with drug load (Figure 3A). Conversely, the results of SRTM method showed that at least 60-min scan duration would be required for the quantification of occupancy; bias was under 3% at a 3% noise level with scan duration longer than 60 mins (Figure 3B). Shorter scan duration caused larger bias of BPND estimated by SRTM. Note that the sampling rate of the reference input function is inherently lower than the one of the plasma input function and this may introduce errors with SRTM although in this instance, kinetics in tissue are not particularly fast.
The use of the bootstrap approach on clinical data validated most of the observations obtained from simulations for the SRTM method, such as the overestimation of BPND and underestimation of occupancy at shorter scan durations. It is important to remark that the variability considered here is the one associated with the measurement error only. Further variability of biological origin (between subjects and/or associated with age, gender, etc. (Inoue et al, 2001; Kaasinen et al, 2001)) should be taken into account and possibly controlled at the design stage.
We can therefore conclude that, for both NLS and SRTM methods, reliable and unbiased occupancy estimates of [11C]MNPA could be obtained by 60 mins, with COV of 50% occupancy remaining at 11.0% and 10.1%, respectively (Figure 3). In the case of lower occupancy than 50%, COV at 60-min scan duration may be >11% but no bias should be expected.
Conclusion
The effects of bias, variance, and scan duration in PET quantitative analysis of dopamine D2 receptor occupancy using [11C]MNPA were evaluated in a simulation study and validated using a bootstrap approach on clinical data. The results suggest that a reference approach with SRTM applied to ROI data with a scan duration of at least 60-mins PET scan duration represent a valid bioassay for the task.
Footnotes
Acknowledgements
This study was supported in part by Grants-in-Aid for Young Scientists (B) (No. 19700395) and by a consignment expense for the Molecular Imaging Program on ‘Research Base for PET Diagnosis’ from the Ministry of Education, Culture, Sports, Science and Technology (MEXT), Japanese Government and by the Royal Society, International Project Grant no. JP0871550, UK. We thank Dr Hiroshi Watabe for his valuable advice.
The authors declare no conflict of interest.