
Abstract
The very high-affinity position emission tomography (PET) radioligand [11C]FLB 457 was developed in order to study extrastriatal tissues, where the density of dopamine D2/D3 receptors is one to two orders of magnitude lower than in the striatum. The present study investigated the validity of using the cerebellum as a reference region. Ten healthy volunteers underwent a 90-min dynamic PET study after the bolus injection of [11C]FLB 457. The total volume of distribution (VDt) was estimated for the thalamus, hippocampus, frontal cortex, and cerebellum using a two-tissue compartmental model with a metabolite-corrected arterial plasma input function. VDt was sensitive to co-injected stable FLB 457 in all regions, including the cerebellum. Ex vivo saturation studies were also conducted in 17 rats where the dose of stable ligand was varied over five orders of magnitude. Specific binding was estimated to account for more than half of the rat cerebellar uptake of [11C]FLB 457, questioning the latter as an estimate of nonspecific binding in human PET studies. To check whether the cerebellum is a reference region, the binding potential (BP) was calculated either from the VDt ratio or using the simplified reference tissue model (SRTM). A non-negligible density of D2/D3 receptors in the cerebellum was shown to lead to underestimation of BP as well as erroneous estimation of differential occupancies. Binging potential estimates from the SRTM were found to be sensitive to changes in cerebral blood flow, providing further evidence for caution in the use of the cerebellum as a reference region in measures of [11C]FLB 457 binding.
Introduction
The very high-affinity radioligand [11C]FLB 457 (Ki~0.02nmol/L for [3H]raclopride binding) was developed for positron emission tomography (PET) in order to study extrastriatal tissues (Halldin et al, 1995), where the density of dopamine D2/D3 receptors is one to two orders of magnitude lower than in the striatum. Most human PET studies with [11C]FLB 457 have been quantified using the simplified reference tissue model (SRTM), assuming that the D2/D3 receptor density in the cerebellum is negligible compared with that in extrastriatal tissues. However, autoradiographic studies in post mortem human brain using the iodoanalogue of FLB 457 [125I]epidepride have measured D2/D3 receptor density in cerebellum to be comparable to that in frontal cortex and only an order of magnitude lower than that in temporal cortex and most parts of the thalamus (Hall et al, 1996). Using the multi-injection approach with plasma input functions to quantify dynamic PET images, Delforge et al (1999) estimated that specific binding of [76Br]FLB 457 in baboon cerebellum represented 75% of the total radioactivity concentration at equilibrium.
Since its introduction as a radioligand, the recommended specific activity (SA) of [11C]FLB 457 has been revised to increasingly higher values (Halldin et al, 1995; Sudo et al, 2001; Olsson et al, 2004). The limit on the body weight adjusted coinjected mass of 0.5 μg in 4-kg monkeys (Halldin et al, 1995) was lowered to 0.6 mg (1.6 nmol) in man (Sudo et al, 2001), corresponding to a SA of 185MBq/nmol for an injected dose of 296 MBq. A co-injected mass of 1.5 mg in humans was later estimated to lead to an occupancy of about 20%, based on results of Scatchard analyses (Olsson et al, 2004). The human studies used to validate the quantification of [11C]FLB 457 data were performed at a low SA of 40 to 77 MBq/nmol (Olsson et al, 1999), and likewise the test–retest studies in humans were carried out at a SA of 60 ±14 and 65 ± 12MBq/nmol (Vilkman et al, 2000). In these two studies, large between-subject variations were observed when PET/[11C]FLB 457 data were analyzed using compartmental analyses with a plasma input function, but more reproducible results were achieved with various approaches using the cerebellum as a reference region.
The evidence often quoted for the lack of specific binding in the cerebellum dates from the first human studies with [11C]FLB 457 which were also performed at the low SA of 22 to 44MBq/nmol (Farde et al, 1997). In this exploratory study, no reduction of [11C]FLB 457 binding was reported in two healthy volunteers examined before and after oral administration of 4 mg of the D2 receptor antagonist haloperidol. A plasma input function was not measured and without it, it is impossible to assess the change in specific binding in the cerebellum between baseline and predosed conditions. The co-injection of significant quantities of stable FLB 457 would have already occupied an appreciable proportion of the D2/D3 receptors under baseline condition, thereby reducing the detectable differences between the paired cerebellar time courses. Suhara et al (1999) later observed a significant SA and time interaction between the normalized average cerebellar time–activity curves (TAC) of high (range 71 to 279MBq/nmol) and low SA (range 1 to 15 MBq/nmol) groups. Again, the corresponding change in specific binding in the cerebellum could not be estimated because of the lack of a plasma input function. The faster clearance in the low SA group would partly be masked in a comparison between the area under the curves (AUC) with the high SA group, the higher peak compensating for the lower tail of the curve. Nevertheless, the AUC over 63 min of the normalized cerebellar TACs presented in Olsson et al (2004) was > 10% lower in the low SA group compared with the higher SA group, and this difference was highly significant. However, this underestimates the saturable binding in the cerebellum for three reasons: (1) the proportion of the total cerebellar uptake which is nonspecific would, by definition, not be reduced by the co-injected stable FLB 457, (2) full occupancy of the D2/D3 receptors was not attained at the low SA group, and (3) a significant proportion of D2/D3 receptors were occupied for some subjects in the high SA group.
In addition to assuming that the reference region is devoid of specific binding, the SRTM postulates that the kinetics of radioligand uptake in both the reference and target regions are adequately described by a single tissue compartment (Lammertsma and Hume, 1996). If the assumption on the model configuration is violated, independently from the presence of specific binding in the reference region, the binding potential (BP) estimates from the SRTM become biased, the magnitude of which depends on the specific tissue kinetics (Wu and Carson, 2002). Tissue kinetics vary with cerebral blood flow (CBF), more so for highly extracted radioligands. K1 estimates for [11C]FLB 457 are relatively large, corresponding to a first-pass extraction fraction of more than 50% for a CBF value of 0.50 ml/min/ml (Ito et al, 2001). [11C]FLB 457 uptake in extrastriatal tissue, including the cerebellum, have been shown to be best fitted by a two-tissue compartment model (Vilkman et al, 2000; Ito et al, 1999). The sensitivity of the SRTM to changes in CBF is also an important point to consider before using this reference region modeling approach to quantify [11C]FLB 457 kinetic data acquired under altered CBF.
The present study investigated the amount of coinjected stable ligand as a possible source of variation in human PET studies with a single injection of [11C]FLB 457. Saturation studies in rats were also conducted in order to estimate the in vivo affinity of [11C]FLB 457 in extrastriatal regions including the cerebellum. Given that the cerebellar uptake, like the other extrastriatal regions, was observed to be sensitive to small amounts of stable ligand in humans, and that saturable binding contributed to more than half of the total uptake in the rat cerebellum, the validity of using the cerebellum as a reference region with this very high-affinity radioligand was re-examined. First, the effects of specific binding in the reference region on the estimates of the in vivo affinity from Scatchard analyses were quantified. Second, the apparent BP and occupancy (relative reduction in BP) were estimated using equations derived to account for the presence of specific binding in the reference region and compared with values estimated without specific binding. The possibility that artifacts from the incorrect quantification of [11C]FLB 457 studies using a cerebellar reference region could lead to apparent differential occupancies was also investigated. Finally, the extent to which violating the model configuration in the SRTM renders BP estimates sensitive to changes in CBF was reevaluated using simulations.
Materials and Methods
Human Positron Enission Tomography (PET) Studies
The study was approved by the Hammersmith, Queen Charlotte's & Chelsea and Acton Hospitals Research Ethics Committee and by the Administration of Radioactive Substances Advisory Committee (ARSAC). All subjects gave informed written consent before participating in the study.
Radiochemistry
[11C]FLB 457 ([O-methyl-11C]-(S)-(–)-5-bromo-N-((1-ethyl-2-pyrrolidinyl)methyl)-2,3-dimethoxybenzamide) was synby O-methylation of the desmethyl precursor using [11C]methyl triflate as the labelled methylating agent, according to the method of Lundkvist et al (1998). The radiochemical purity was greater than 95% and the specific activity at the time of injection ranged from 25 to 101 MBq/nmol, corresponding to a mass of co-injected FLB 457 between 1.21 and 3.86 μg (individual values are presented in Table 1).
Subject characteristics and injectate specifications
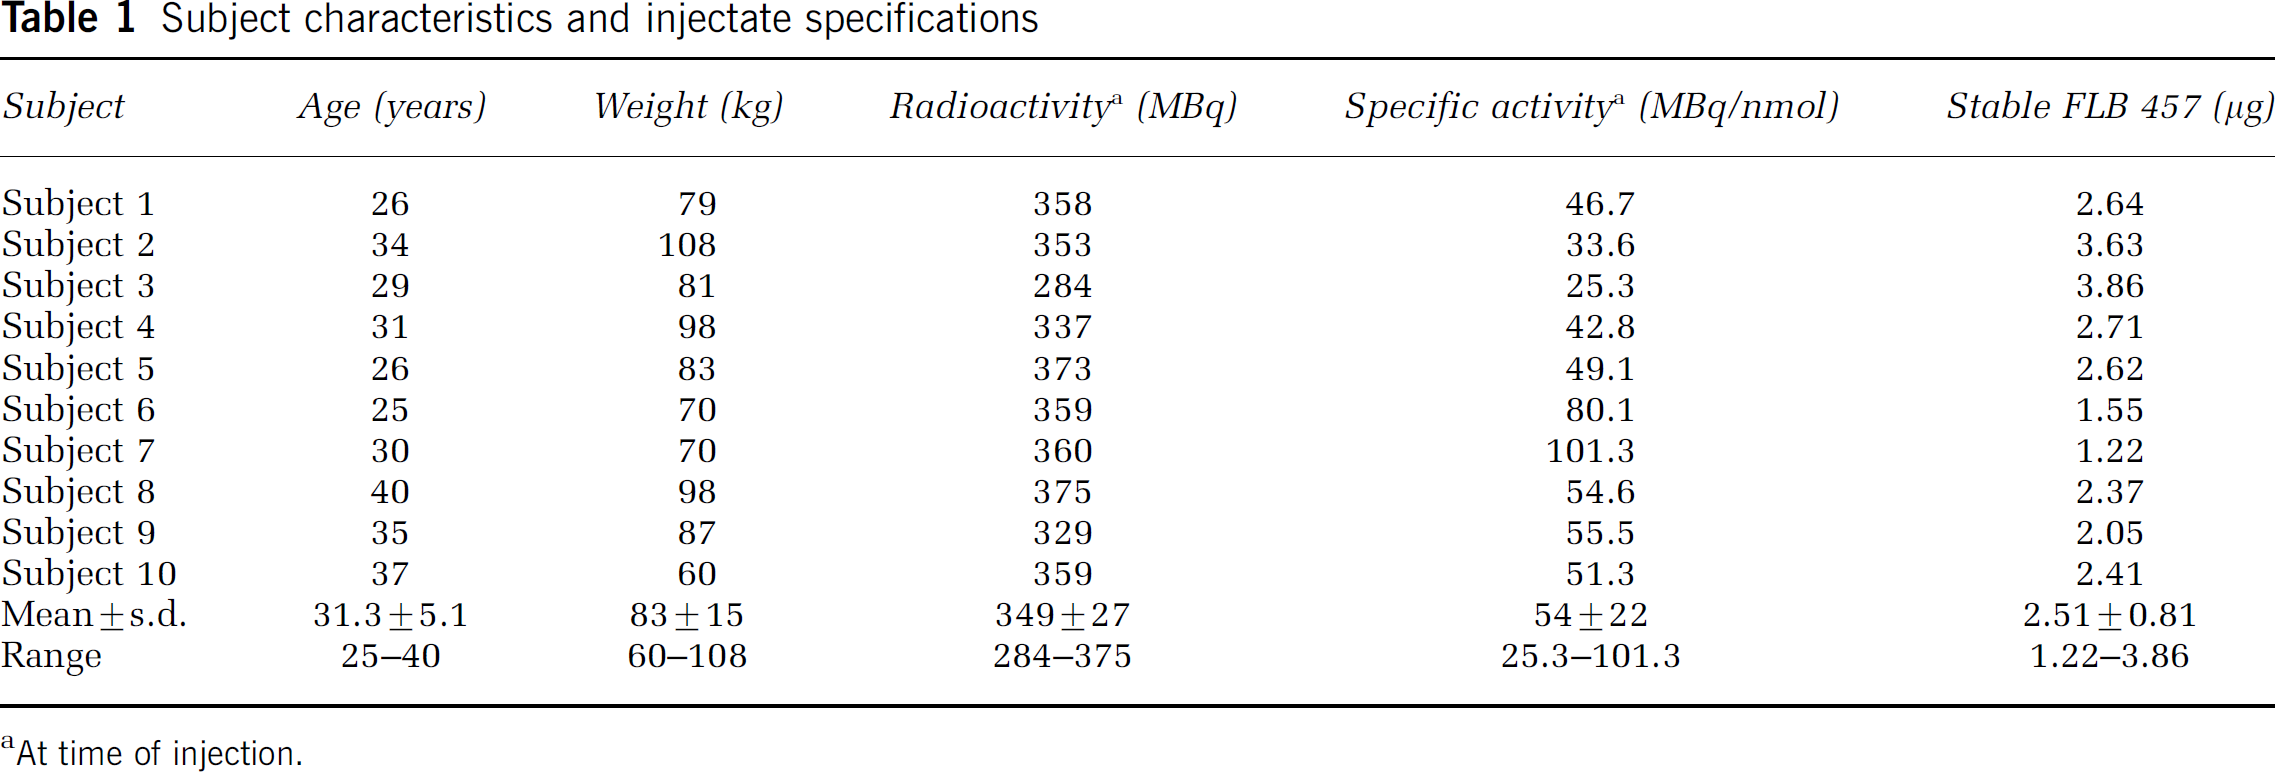
At time of injection.
Data Acquisition
Ten healthy male volunteers (aged 25 to 40 years, weighing 60 to 108 kg) underwent a dynamic PET study in the CTI ECAT EXACT3D tomograph (Spinks et al, 2000) after the bolus injection (over 45 s) of 284 to 375 MBq of [11C]FLB 457 (individual values are presented in Table 1). The antecubital vein and the radial artery were cannulated for radiotracer injection and blood sampling, respectively. Before radiotracer injection, a 5-min transmission scan was acquired using a 137Cs rotating point source. The emission scan was started 30 s before radiotracer injection and the 3D data acquisition in list mode lasted 90 min. The events were subsequently rebinned into the following sequence of 26 frames: variable background (30 to 45 s), 1 × 15s, 1 × 5s, 1 × 10s, 1 × 30s, 4 × 60s, 17 × 300s. Projection data of each frame were corrected for attenuation (Xu et al, 1994) and scatter (Watson et al, 1996) and reconstructed using the reprojection algorithm (Kinahan and Rogers, 1989) with the ramp and Colsher filters set to Nyquist frequency. The spatial resolution of the reconstructed images was 4.8 mm transaxially (1 cm off-axis) and 5.6 mm axially (on axis) (Spinks et al, 2000). The dynamic images were corrected post-reconstruction for head movement by realigning each frame, previously denoised using a wavelet transform (Türkheimer et al, 1999), to frame 16 (a 5-min frame acquired 35 min after the radiotracer injection) using a co-registration algorithm based on mutual information theory (Studholme et al, 1997). A 3D T1-weighted magnetic resonance (MR) image was also acquired for each subject using a 1.0-T Picker HPQ system with TR = 21 ms, TE = 6 ms, flip angle = 35°, FOV = 25 cm and a single acquisition. The 114 contiguous sagittal slices were displayed as a 256 × 256 matrix with 0.98 × 0.98 mm2 pixel size and 1.6-mm thickness.
For the duration of the study, arterial blood was withdrawn at a rate of 5 ml/min for the first 10 min and 2.5 ml/min thereafter, and counted on-line using an inhouse built BGO/photomultiplier assembly (Ranicar et al, 1991) cross-calibrated to a NaI well counter. In addition, discrete blood samples were taken at increasing time intervals throughout the study (at 5, 10, 15, 20, 30, 40, 60, and 90 min). Blood and plasma fractions at each time point were counted in a NaI well counter cross-calibrated to the tomograph. The ratio of the plasma-over-whole blood radioactivity concentration was calculated and the time course was fitted to an exponential increase to a constant. The remaining plasma volume was analysed using a semi-automated reverse phase high-performance liquid chromatography (HPLC) system (Luthra et al, 1993). The time course of the fraction of radioactivity in plasma attributed to [11C]FLB 457 was fitted to a sigmoid decrease to a straight line,
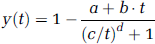
where a, b, c and d are the fitted parameters. The metabolite-corrected plasma input function was generated by successively multiplying the continuous blood radioactivity concentration by the fits to the plasma-to-whole blood ratio and to the [11C]FLB 457 fraction in plasma.
Regions of Interest (ROI) Definition
A probabilistic brain atlas (Hammers et al, 2003), defined in the Montreal Neurological Institute (MNI) space, was used to define the ROI. The MR image of the MNI single subject brain was normalized to each subject's MR image using SPM99 (Wellcome Department. of Cognitive Neurology, University College, London, UK (Ashburner and Friston, 1999)), and the atlas was warped to the subject's MR space by applying the normalization parameters. Using SPM99, the subject's MR image was then segmented into grey matter, white matter, and CSF components, the gray matter probability map was thresholded at 30% and the resulting mask was applied to the normalized atlas. The subject's MR image was also co-registered to the summated PET image (0 to 90 min) using an algorithm based on mutual information theory (Studholme et al, 1997). The segmented normalized atlas was finally resliced into the subject's PET space by applying the coregistration parameters. Time-activity curves (TAC) for the thalamus (thal), hippocampus (hipp), frontal cortex (frnt), and cerebellum (cer) were generated by overlaying the corresponding ROIs (left and right hemispheres combined) on the dynamic PET images. Quantification of [11C]FLB 457 binding in the striatum was not attempted because the study duration was shorter than the time required to reach equilibrium in this D2/D3 receptor-rich region (Olsson and Farde, 2001).
Compartmental Analyses
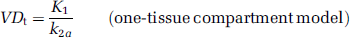
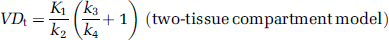
The tissue TACs were fitted to the one-tissue compartment two-rate constant model and to the two-tissue compartment four-rate constant model, both using the metabolite-corrected arterial plasma input function. For each model, blood volume was added as an extra parameter with blood delay fixed to the value estimated from the whole brain. The non-decay corrected data were weighted by L/T, where T is the count rate of true coincidences and L is the frame length, in the calculation of the residual, and physical decay was added to the model. The analytical solutions to the models were implemented in Matlab 6.0 (Mathworks, Natick, MA, USA) and the parameter space, defined by weighted least squares, was searched using the Simplex method. The rate constants were used to estimate the total volume of distribution (VDt) as,
The binding potential (BP) was calculated from VDt using
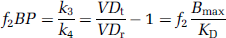
where VDr is VDt of the reference region (cerebellum) which is assumed to be devoid of specific binding (i.e., k3 = 0). The volume of distribution of the free and nonspecific compartments in the target region is assumed to be equal to VDr. The binding potential was also estimated from the fit of the tissue TACs to the SRTM (Lammertsma and Hume, 1996) using the cerebellar TAC as an indirect input function. This model further assumes that the kinetics of both the reference and target tissues are appropriately described by a one-tissue compartment model. The tissue kinetics are then defined by three parameters: The ratio of forward transport rate constants between the target (K1 and reference (K'1) regions Ri(= K1/K'1), the reverse transport rate constant in the target region k2 (from the two-tissue compartment model), and the binding potential f2BP (= k2/k2a-1, where k2a is the apparent k2 in the target region from the one-tissue compartment model). The fits to the three models (the one-tissue compartment model, the two-tissue compartment model and the SRTM) were compared using an F-test.
Simulations
A simulation study was performed in order to estimate the effects of changes in CBF on binding potential estimates of [11C]FLB 457 obtained using the SRTM. Two sets of simulations were performed: (1) CBF was varied only in the target region with the reference region parameters fixed (regional flow changes), and (2) CBF was varied in both the target and reference regions, assigning the same CBF value to both regions (global flow changes). CBF was not varied during one study, but differences in CBF between different studies were simulated by assigning different values to the parameters K1 and k2. Tissue TACs were generated for the four ROIs using the plasma input function of Subject 5 and the rate constants presented in Table 2 for the two-tissue compartment model. The K1/k2 ratio was not forced to be the same in the target and reference regions. The delay was fixed to zero and the blood volume term was neglected. cerebral blood flow was varied from 0.25 to 0.75 ml/min/ml (i.e., ± 50% around the reference value of 0.50 ml/min/ml (Gunn et al, 2000)) while holding the first-pass extraction fraction (E) and the volume of distribution of the free and nonspecific compartment (VDns) fixed (K1 = E x CBF, k2 = K1/VDns, k3 and k4 are flow independent). This assumes capillary recruitment or dilatation. The reference values for E and VDns were calculated for each tissue using the K1 and k2 values given in Table 2 and the reference CBF value of 0.50 ml/min/ml. For each set of simulations, the TACs were fitted to the SRTM and the sensitivity of the parameters BP and R1 to changes in CBF assessed.
Regional parameter estimates derived from the two-tissue compartmental model with a plasma input function (for subjects given < 3 μg of stable FLB 457, n = 8 a )
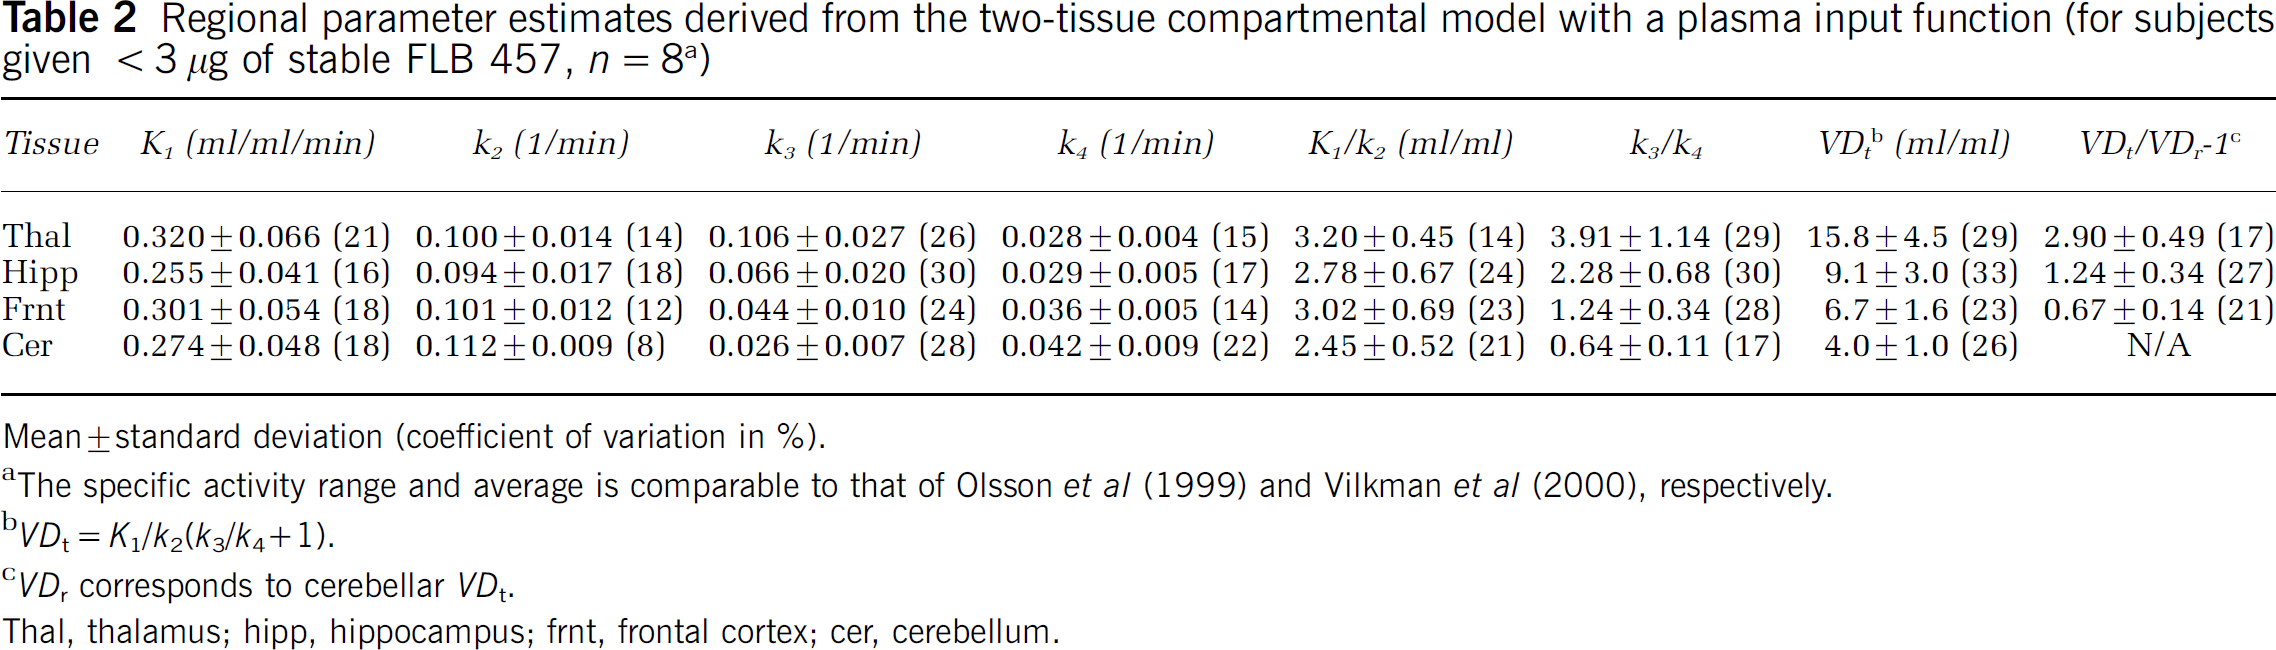
Mean+standard deviation (coefficient of variation in %.
The specific activity range and average is comparable to that of Olsson et al (1999) and Vilkman et al (2000), respectively.
VDt = K1/k2/k3/k4+1).
VDt corresponds to cerebellar VDt.
Thal, thalamus; hipp, hippocampus; frnt, frontal cortex; cer, cerebellum.
Rodent Ex Vivo Studies
All work was carried out by licensed investigators in accordance with the UK Home Office's Guidance on the Operation of the Animals (Scientific Procedures) Act 1986.
Data Acquisition
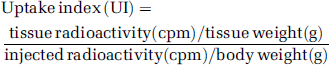
Awake but lightly restrained adult male Sprague-Dawley rats (n = 17, 270 to 310 g) were used for the characterization of the dose–response curve of stable FLB 457. [11C]FLB 457 was injected as a bolus via a previously catheterized tail vein and the dose of stable ligand varied by either adjusting the radioactivity injected (from 1 to 27 MBq) or pre-dosing the rats (intravenously 5 min before injection) with stable ligand (from 0.001 to 1 mg/kg). At 60 min post-injection, the rats were killed by intravenous injection of Euthatal. The brain was rapidly removed, and tissues dissected. Data for thalamus, hippocampus, prefrontal cortex, and cerebellum are reported here (the full details are presented in Ahmad et al, 2006). The radioactivity in the samples was measured in a Wallac gamma-counter and automatically corrected for radioactive decay. The radioactivity was normalized and expressed as an uptake index defined as
Data Analyses
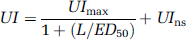
Assuming Michealis-Menten kinetics, the total tissue uptake (UI) at various doses of stable ligand (L in nmol/kg body weight) was fitted to the single-binding site model,
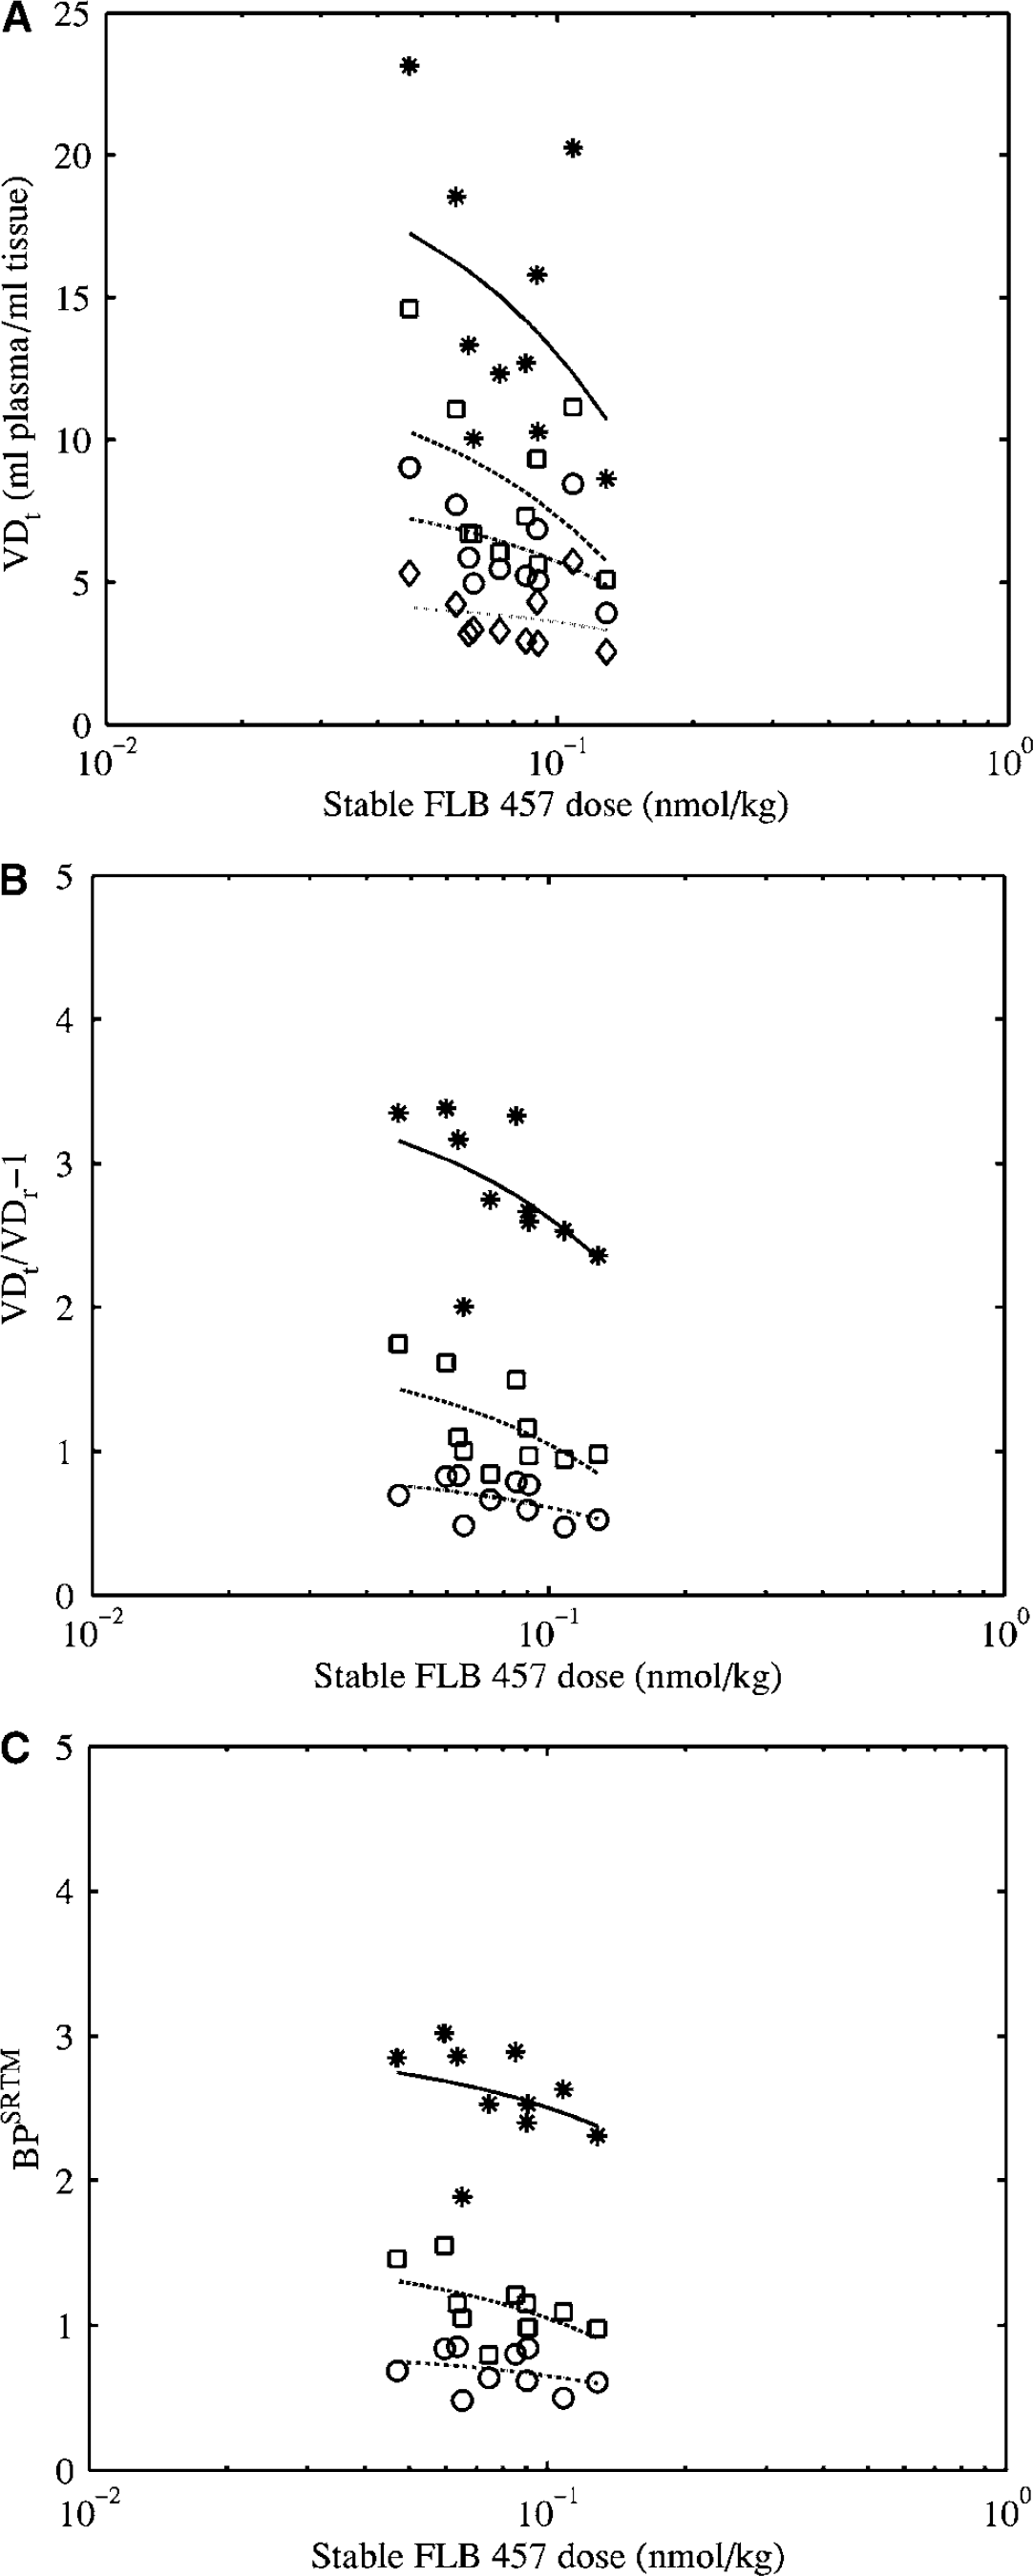
The dose–response curves were also analysed using a Scatchard approach after transforming the uptake index into concentrations (nmol/g tissue) using the equation B + F = UI x L, where B and F are the concentrations of bound and free ligand, respectively. From the plot of the bound over free concentration ratio versus the bound concentration (Farde et al, 1989; Olsson et al, 2004),
the in vivo apparent affinity (1/KD) was estimated from the slope and the maximum concentration of available receptors (Bmax) from the intercept and the slope. For each tissue, two Scatchard plots were constructed: (1) using UIns x L as estimate of F, and (2) using UI x L in the cerebellum as estimate of F.
Results
Comparison Between Kinetic Models
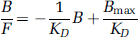
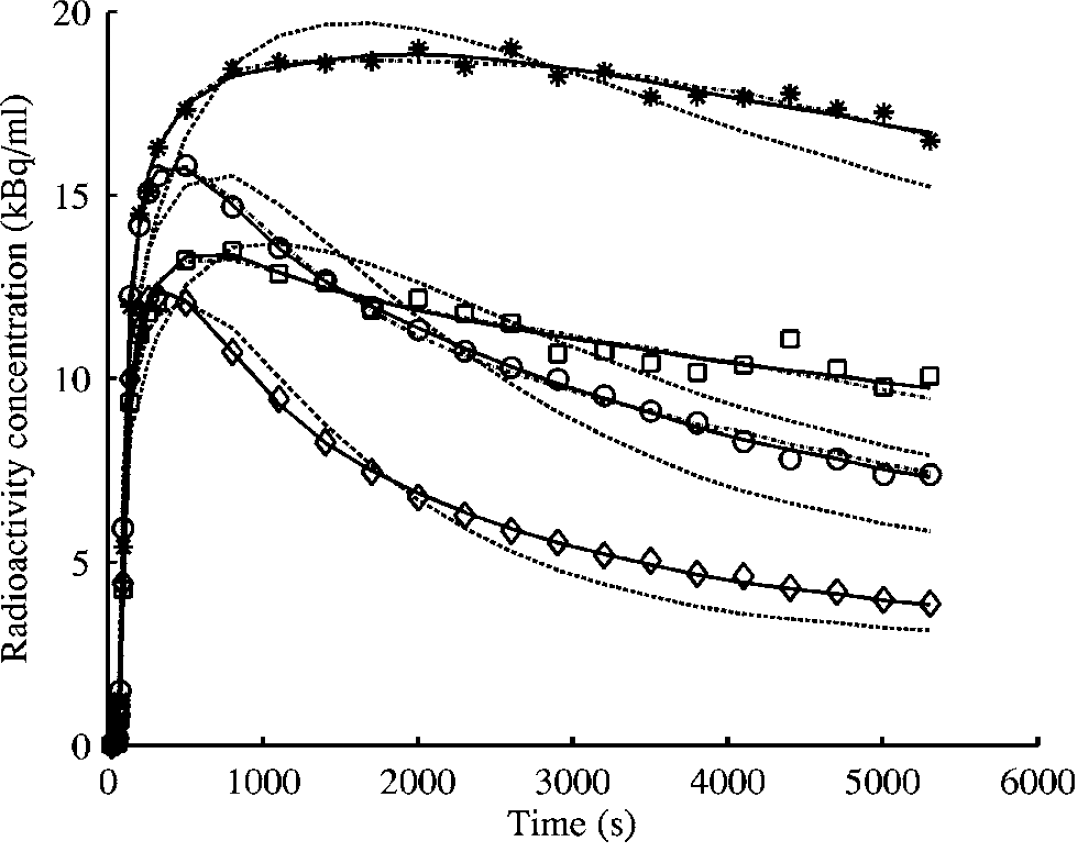
For all human tissues, including the cerebellum, a second tissue compartment was necessary to appropriately describe the kinetics of [11C]FLB 457 over 90 min (Figure 1). The average regional parameter estimates from the two-tissue compartment model are presented in Table 2 for those (8 out of 10) subjects who were administered less than 3 μg of stable FLB 457. Despite assuming that one tissue compartment is sufficient to describe the kinetics of both the target and reference regions, the SRTM provided as good fits to the thalamic and cortical regions as the two-tissue compartment model (Figure 1). A similar observation has also been reported previously by Wu and Carson (2002) with [18F]FCWAY. Binding Potential estimates from the SRTM agreed well with those calculated from the VDt ratio up to BP values of about 2.5, beyond which the SRTM underestimated BP (Figure 2).
Comparison between the fits of the one-tissue compartment two-rate constant model (dashed lines), two-tissue compartment four-rate constant model (solid lines), and the simplified reference tissue model (dot dashed lines) to the tissue time–activity curves (* thalamus, □ hippocampus, ○ frontal cortex, ◊ cerebellum) for Subject 5.
Comparison between the binding potential (BP) estimated from the total volume of distribution (VDt) ratio and from the simplified reference tissue model (SRTM) (* thalamus, □ hippocampus, ▻ frontal cortex, ◊ cerebellum). The dashed line represents the line of identity. Errorbars represent standard errors on least-square estimates.
Variability in Human Data
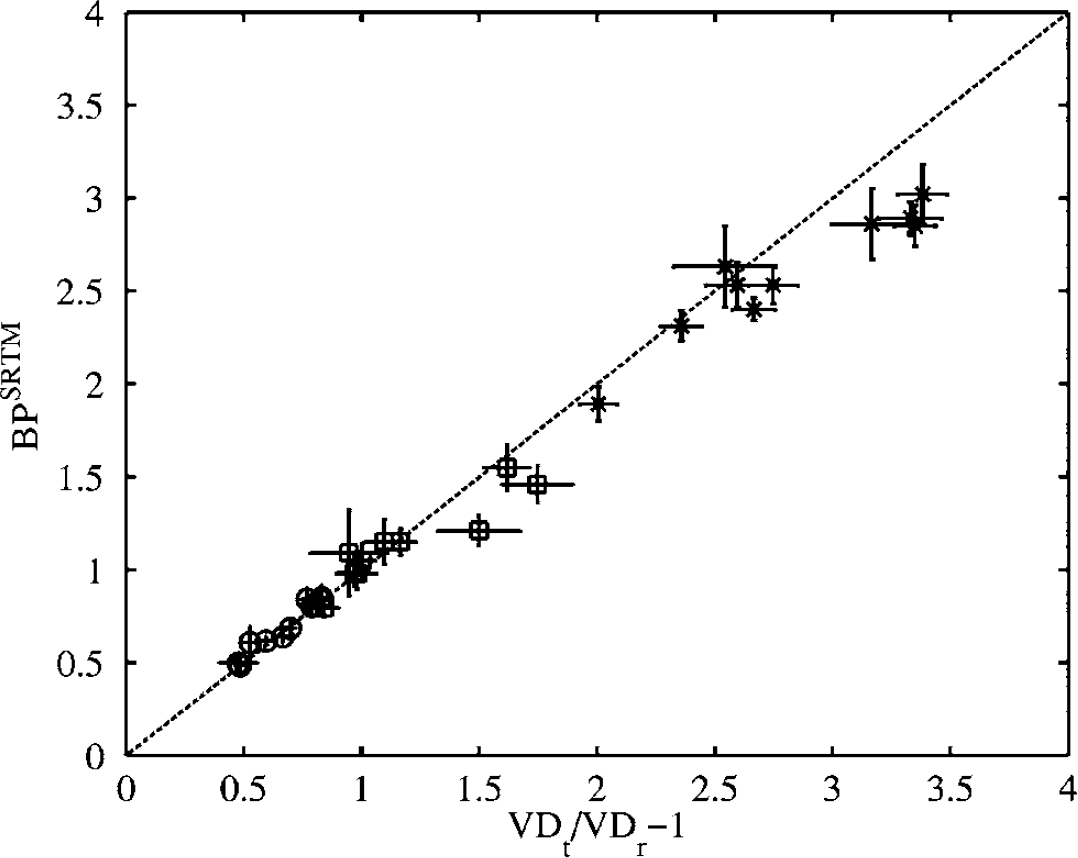
Using the two-tissue compartmental model with a plasma input function, large between-subject variations were observed in the total volume of distribution VDt, with coefficients of variation (COV) of 33% (thal), 37% (hipp), 27% (frnt) and 29% (cer), using data from all 10 subjects. Similar variations were obtained for the k3/k4 ratio. The use of the SRTM reduced the between-subject variations, with COV of 13% (thal), 20% (hipp) and 21% (frnt), in the binding potential BP for the same subjects. These results are comparable to those reported in previous studies: 26% to 32% versus 16% to 21% (Olsson et al, 1999) and 24% to 30% versus 11% to 22% (Vilkman et al, 2000). For the 10 subjects reported here, VDt in all extrastriatal tissues, including the cerebellum, decreased as the amount of co-injected stable ligand increased (Figure 3A). Dividing VDt in the target region by VDt in the cerebellum attenuated this effect (Figure 3B). When estimated using the SRTM, the dependence of BP on the amount of coinjected stable ligand was reduced even further (Figure 3C). This effect is unlikely to be because of an inherently good property of the SRTM, but to the underestimation of BP at high BP values (as shown in Figure 2).
Effect of stable FLB 457 on binding parameter estimates from human PET images: Variations in (
Estimation of In Vivo Affinity from Rat Data
From the fits of the dose–response curves to the single-binding site model (Figure 4), the ED50 in rat was estimated to be 1 to 2 nmol/kg body weight in all extrastriatal tissues sampled, including the cerebellum (Table 3a). The non-saturable tissue uptake was similar across tissues, as indicated by the overlap in the fitted curves at high doses of stable ligand. The binding potential, as indicated by the UImax/UIns ratio, ranged from 4.9 in the thalamus to 1.6 in the cerebellum. Approximately parallel lines were obtained on the Scatchard plots for the different tissues (Figure 5A) and the in vivo KD was estimated to be ~0.3pmol/g tissue. The Bmax estimates ranged from 1.3 pmol/g tissue in thalamus to 0.3 pmol/g tissue in cerebellum (Table 3b). Replacing the non-saturable tissue uptake with the cerebellar uptake lowered the slope and the intercept of the Scatchard plot (Figure 5B), resulting in an increase in the KD estimate by a factor of about five (Table 3b).
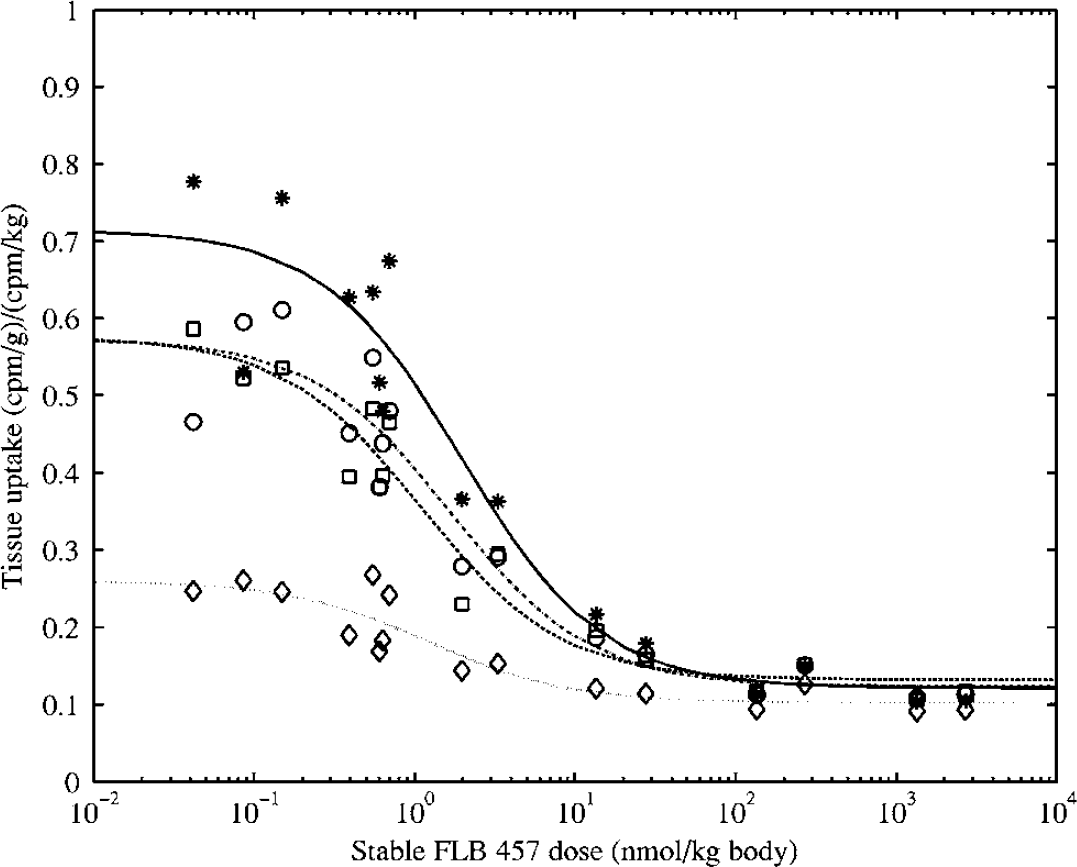
Dose-response curves in excised rat brain tissues: Variations in uptake index with body weight adjusted concentration of stable FLB 457 (in nmol/kg). Each data point represents a separate animal. Fit of the single-binding site model is displayed for each tissue (* and solid line for thalamus, □ and dashed line for hippocampus, ○ and dot dashed line for prefrontal cortex, ◊ and dotted line for cerebellum). Parameters of the fits are given in Table 3a.
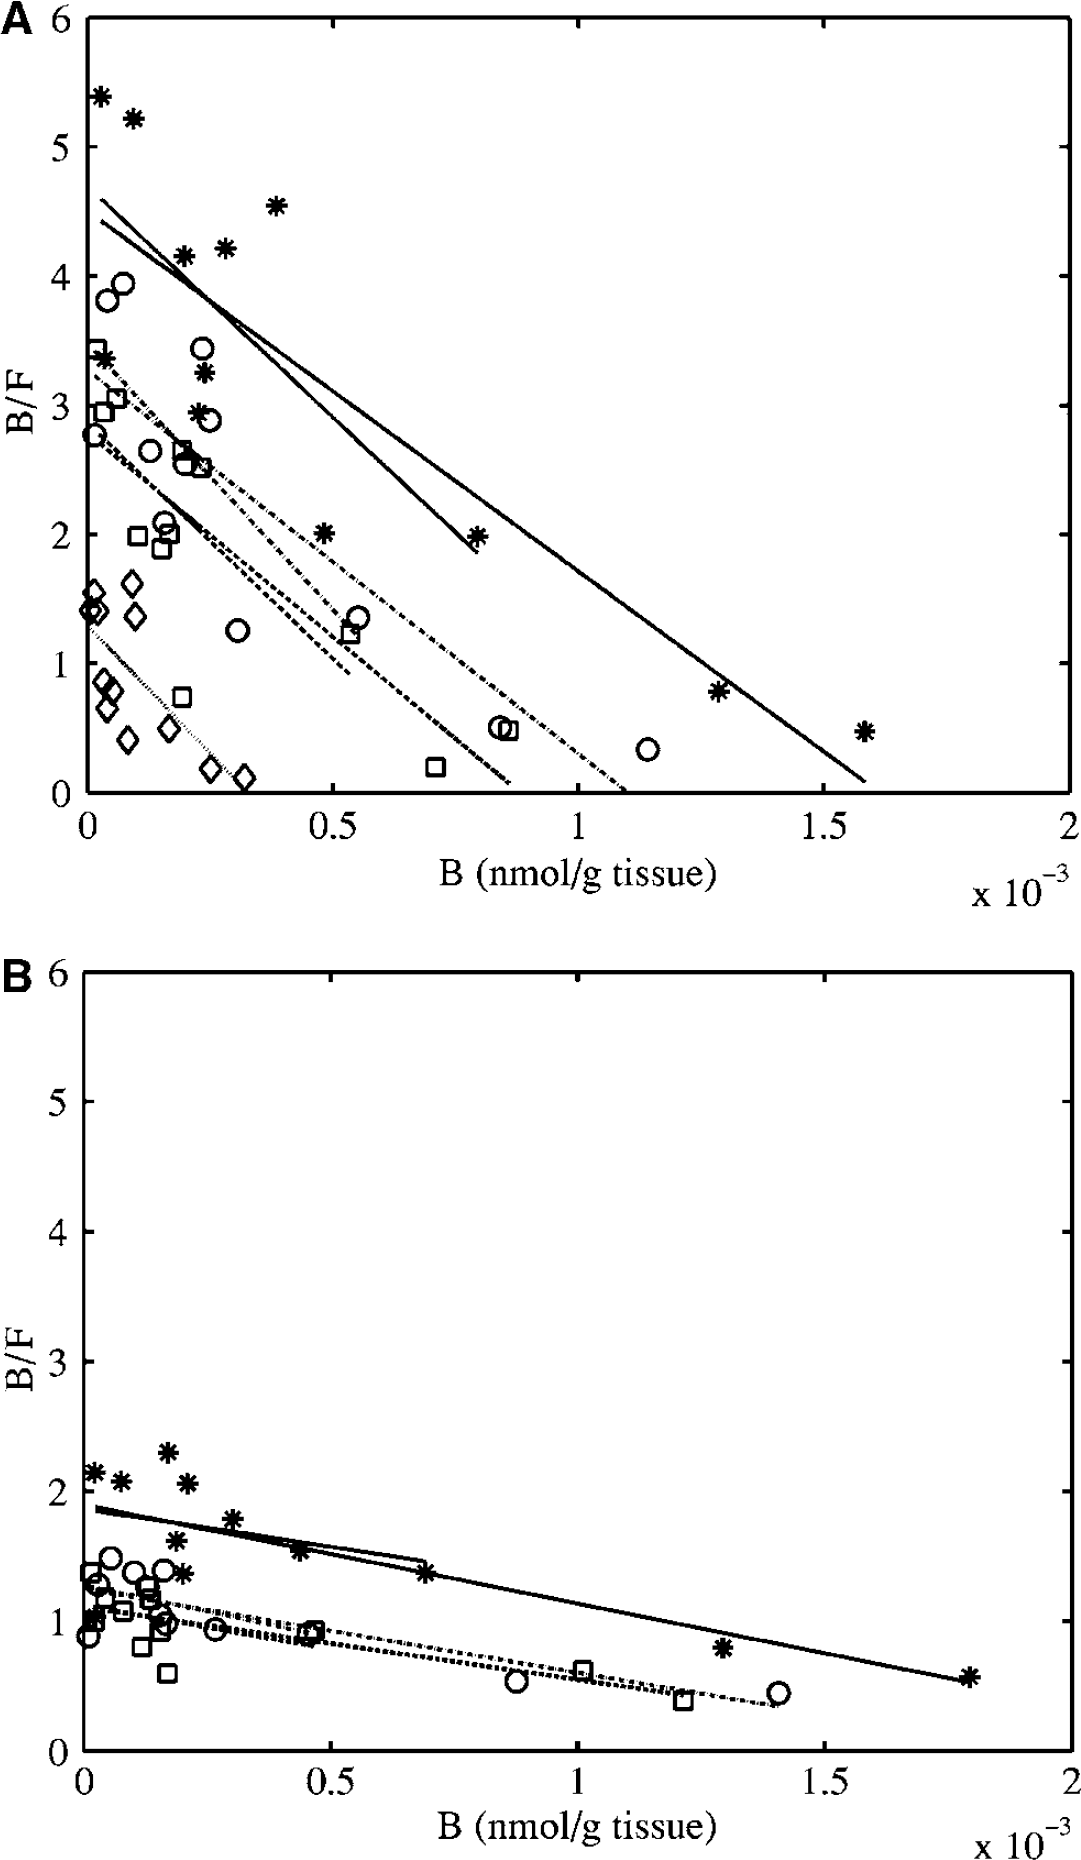
Scatchard plots constructed using either (
Parameters a from the fits of the single-binding site model (Equation (7)) to the dose response curves of stable FLB 457
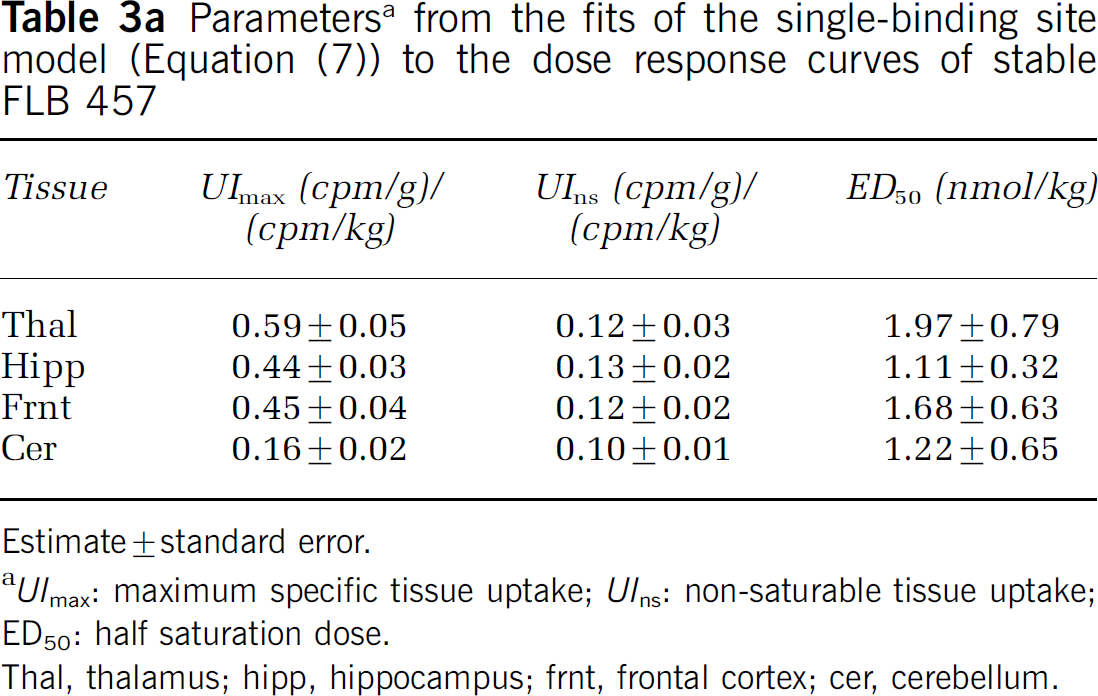
Estimate ± standard error.
UImax: maximum specific tissue uptake; UIns: non-saturable tissue uptake; ED50: half saturation dose.
Thal, thalamus; hipp, hippocampus; frnt, frontal cortex; cer, cerebellum.
Comparison of D2/3 receptor densities (Bmax) and apparent affinities of FLB 457 (1/KD) as estimated using the Scatchard plots of Figures 5A and 5B
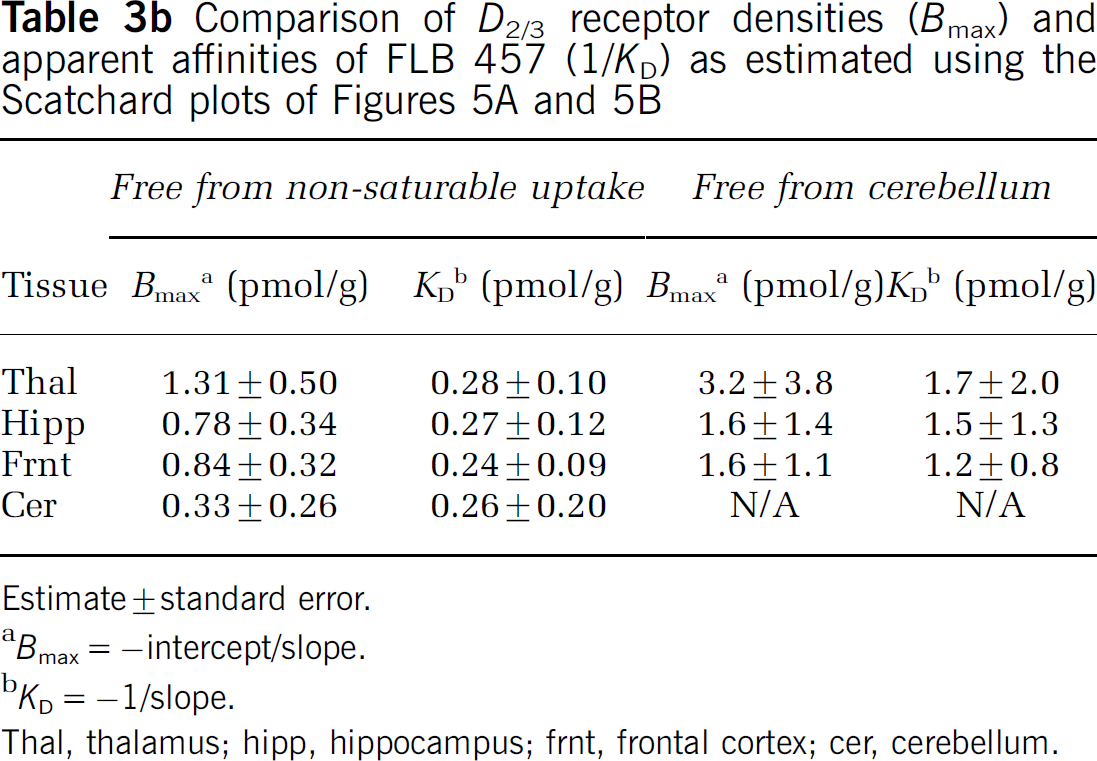
Estimate ± standard error.
Bmax = –intercept/slope.
KD = −1/slope.
Thal, thalamus; hipp, hippocampus; frnt, frontal cortex; cer, cerebellum.
Validity of the Cerebellar Reference Region
The presence of saturable binding in the cerebellum was thus detected in humans and confirmed in rats. In Appendix 1, the effect of specific binding in the reference region was carried through the calculation of BP from the VDt ratio:
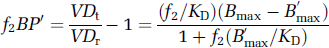
According to Equation (9), the apparent binding potential (BP') is reduced by the concentration of receptors in the reference region (B'max) relative to that in the target region (Bmax), and this difference is weighted by the in vivo affinity of the radioligand (f2/KD), where f2 is the free fraction in tissue and 1/ KD is the in vitro affinity (Logan et al, 1997). The magnitude of this effect for [11C]FLB 457 is compared with that for the moderate affinity radioligand [11C]raclopride in Table 4. The receptor densities in the different tissues were set to those measured in post mortem human brains by Kessler et al (1993) and Hall et al (1996), and the in vivo affinities were taken from PET measurements in non-human primates by Ginovart et al (1997), for raclopride, and Delforge et al (2001), for FLB 457. Based on these values, the striatal BP of [11C]raclopride is underestimated by less than 5%, confirming that the cerebellum is an appropriate reference region for the striatum, using this moderate affinity radioligand. The cortical BP is underestimated by more than half for both [11C]raclopride and [11C]FLB 457, indicating that the D2/D3 receptor density in the cerebellum is too high relative to that in cortical regions for use as a reference region, regardless of the affinity of the radioligand. Striatal and thalamic BPs are also underestimated by more than half with [11C]FLB 457, further invalidating the use of the cerebellum as a reference region for any region when using a high-affinity radioligand. Evidence for the underestimation of the binding potential in human studies is presented in Figure 6 where the BP calculated using the cerebellar VDt is systematically lower for all regions compared with the BP calculated from the k3/k4 ratio. This implies that BP estimates from the SRTM are even more greatly underestimated relative to the k3/k4 ratio.
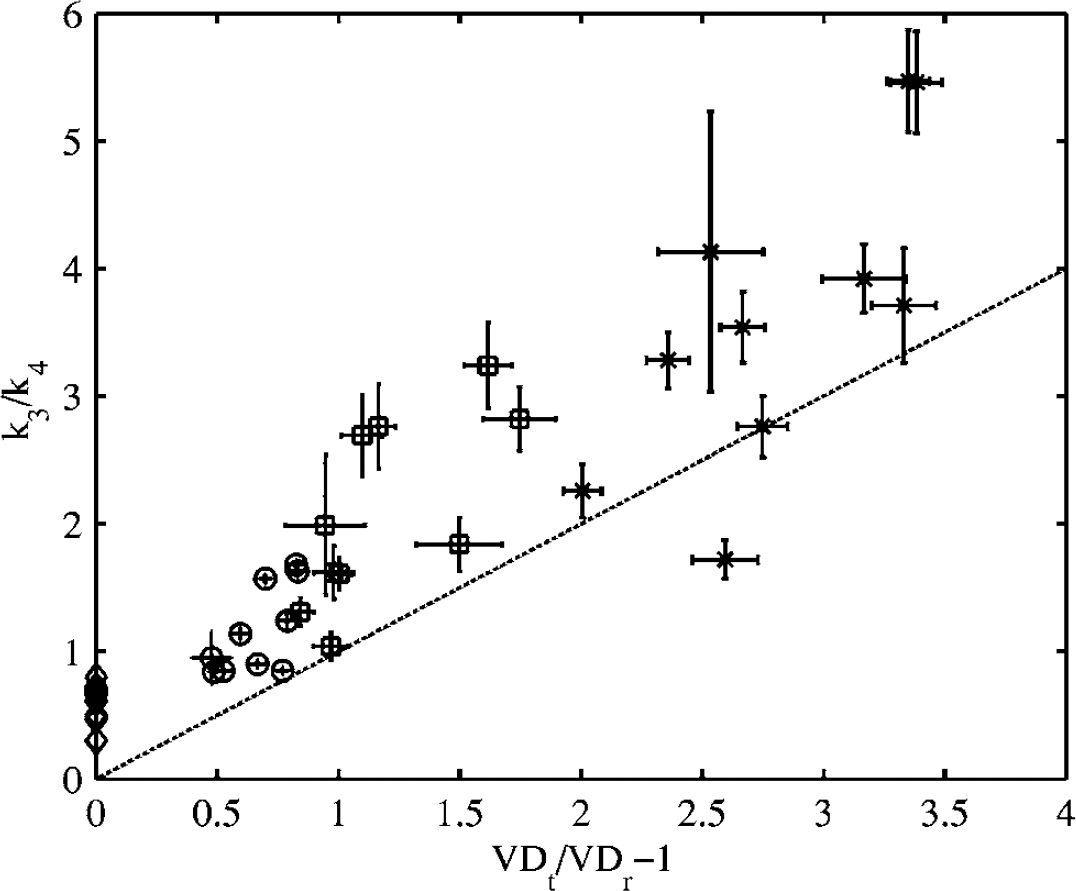
Comparison between the binding potential (BP) estimated from the total volume of distribution (VDt) ratio and from k3/k4 (* thalamus, □ hippocampus, ○ frontal cortex, ◊ cerebellum). The dashed line represents the line of identity. Errorbars represent standard errors on least-square estimates.
Comparison of binding potentials estimated using equation (A.5) (f2BP) and A.6.(f2BP0) for moderate (raclopride) and very high (FLB 457) affinity ligands
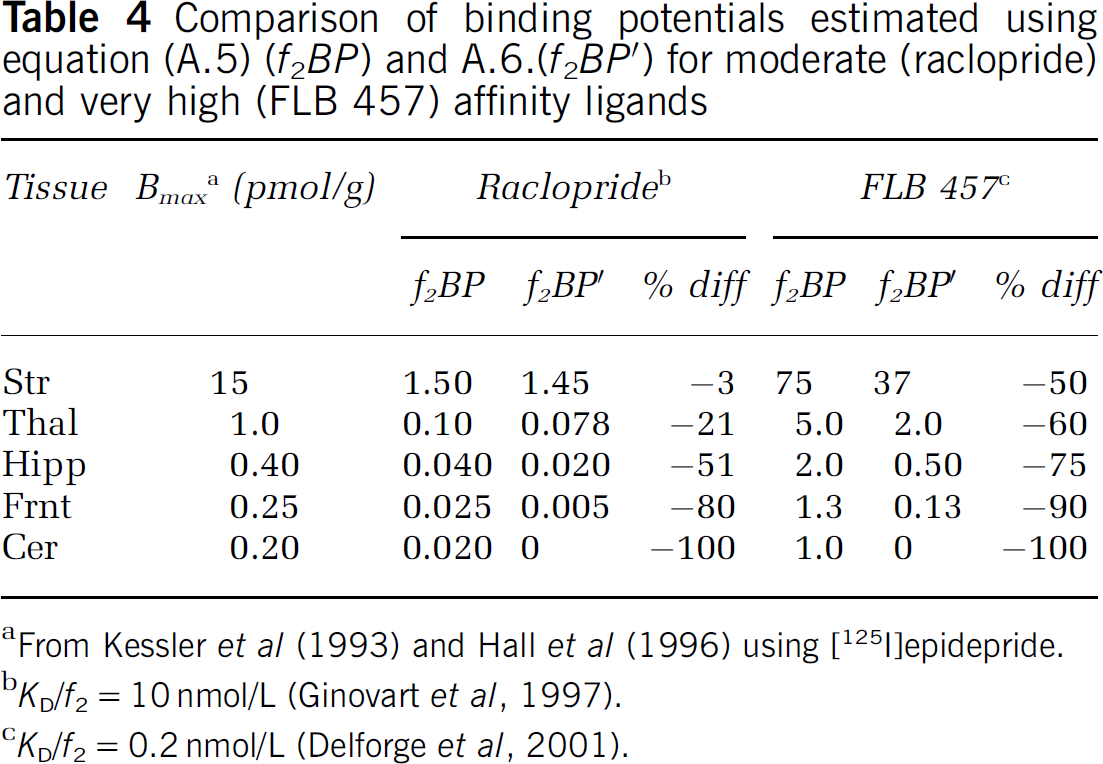
From Kessler et al (1993) and Hall et al (1996) using [125I]epidepride.
KD/f2=10 nmol/L (Ginovart et al, 1997).
KD/f2=0.2 nmol/L (Delforge et al, 2001).
Changes in binding potential (e.g., between baseline and blockade conditions) are often of more interest than absolute BP values. The effect of non-negligible specific binding in the reference region on the calculation of drug occupancy is derived in Appendix 2:
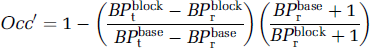
Equation (10) predicts that the apparent occupancy (Occ') underestimates the true occupancy according to the BP differences between target and reference regions, and the ratio of BP differences is further weighted by a factor determined by the level of blockade in the reference region. As the cerebellar BP is simulated to increase from 0.2 (Olsson et al, 1999) to 3 (Delforge et al, 1999), the occupancy is increasingly underestimated, but uniformly across regions of different receptor densities, as long as the occupancy is the same in the target and reference regions (Figure 7A). In the illustrated example, an occupancy of 80% is underestimated by 25% for a level of specific binding in the cerebellum set to that measured in the rat (BP = 1.5). However, if the occupancy is lower in the reference than in the target regions (10% lower in the illustrated example), low-density regions appear to have a higher occupancy than high-density regions (Figure 7B). In this case, the weighting factor (always greater than or equal to unity) brings the ratio of BP differences closer to the true value in the low-density regions compared with the high-density ones, creating apparent differential occupancies. Greater differences in occupancy between the target and reference regions can lead to apparent occupancy values exceeding 100%. In the latter case, using a tissue containing specific binding as a reference region yielded apparent occupancies which are physiologically implausible. In the extreme case when specific binding in the cerebellum is not altered (weighting factor equal to unity), the apparent occupancy in the low-binding regions will also be higher than in the high-binding regions, this time differentially overestimating the true occupancy.
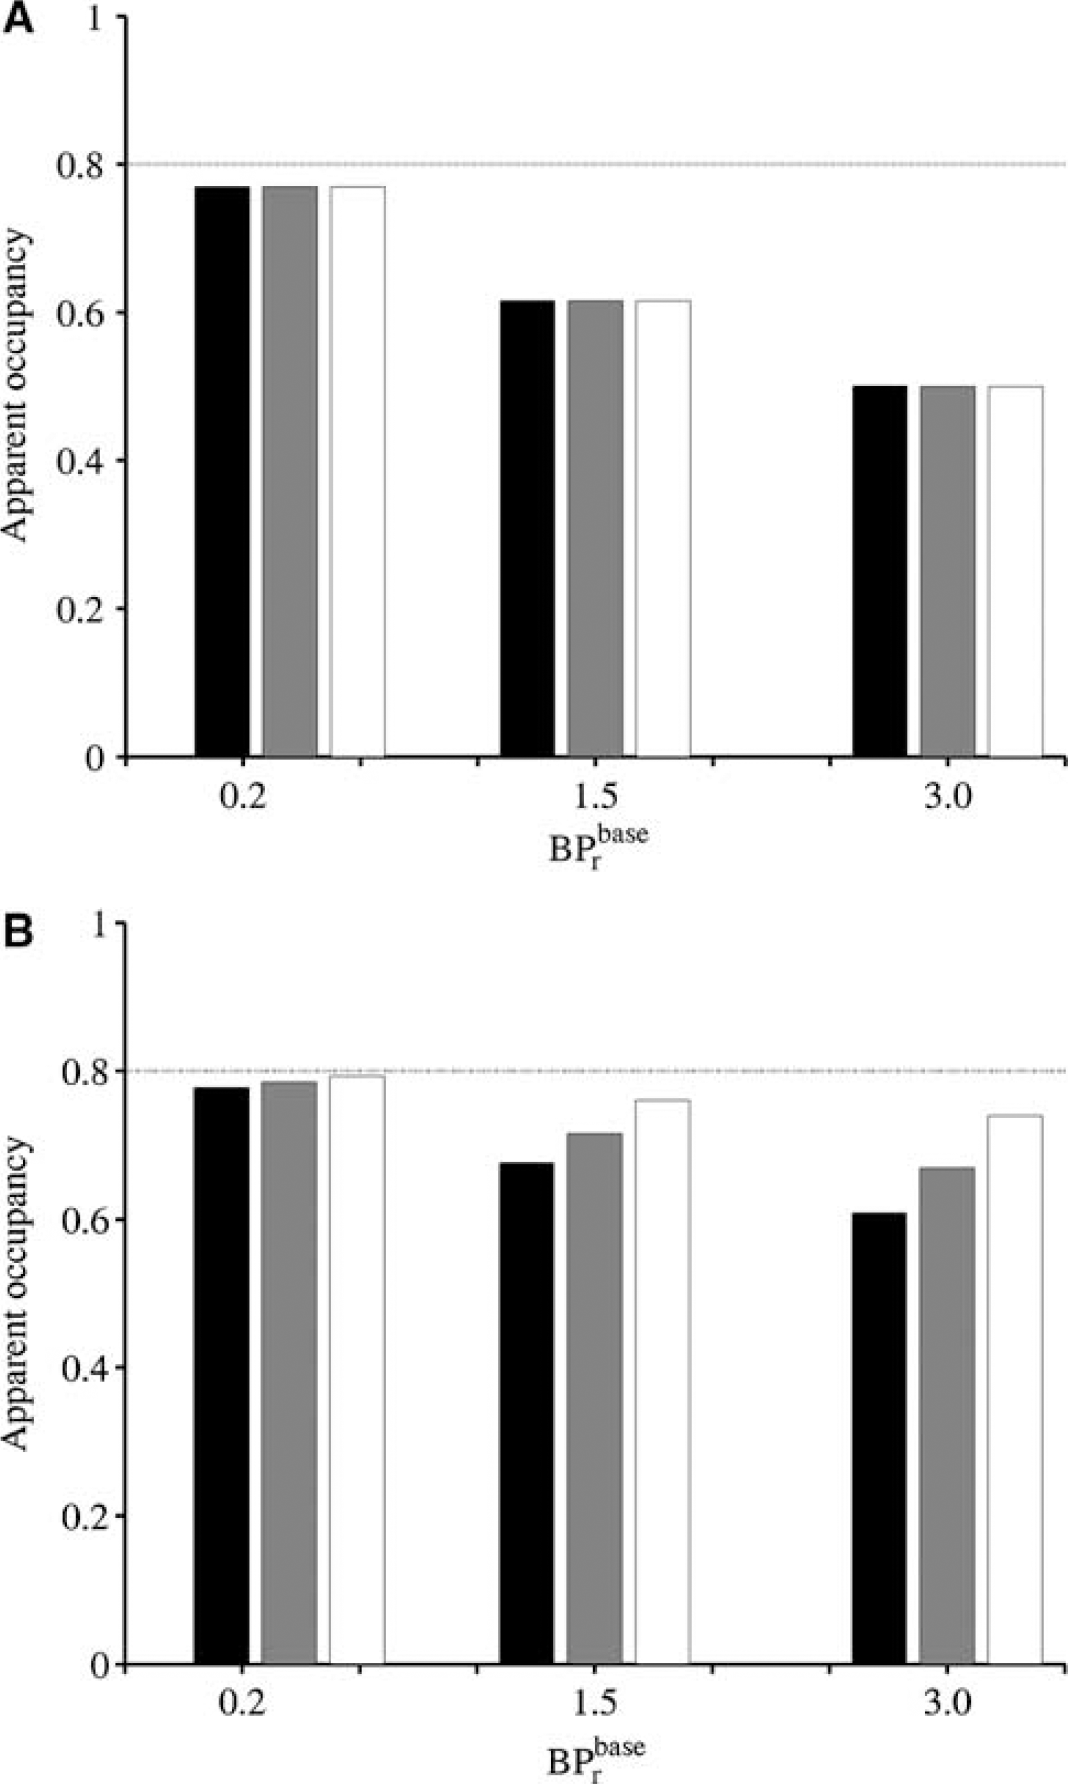
Decrease in the apparent occupancy (estimated using Equation A.10) with an increase in the binding potential in the reference region (cerebellum) at baseline (BPrbase) when (
Sensitivity of Simplified Reference Tissue Model to Cerebral Blood Flow
The simulation results revealed that BP estimates from the SRTM are very sensitive to regional changes in CBF (rCBF), with a 10% change in BP resulting from a change of less than 10% in rCBF in the target region (Figure 8A). In contrast, BP estimates from the SRTM are less sensitive to global changes in CBF (gCBF), with a 25% change in gCBF inducing a change of less than 10% in BP (Figure 8B). Binding potential estimates are more sensitive to increases in rCBF than to decreases in rCBF, and the direction of the change in BP caused by rCBF changes is opposite to that caused by gCBF changes. VDt and VDt ratio estimated from the two-tissue compartment model should not be affected by gCBF or rCBF changes, as long as CBF remains constant during the study (Logan et al, 1994).
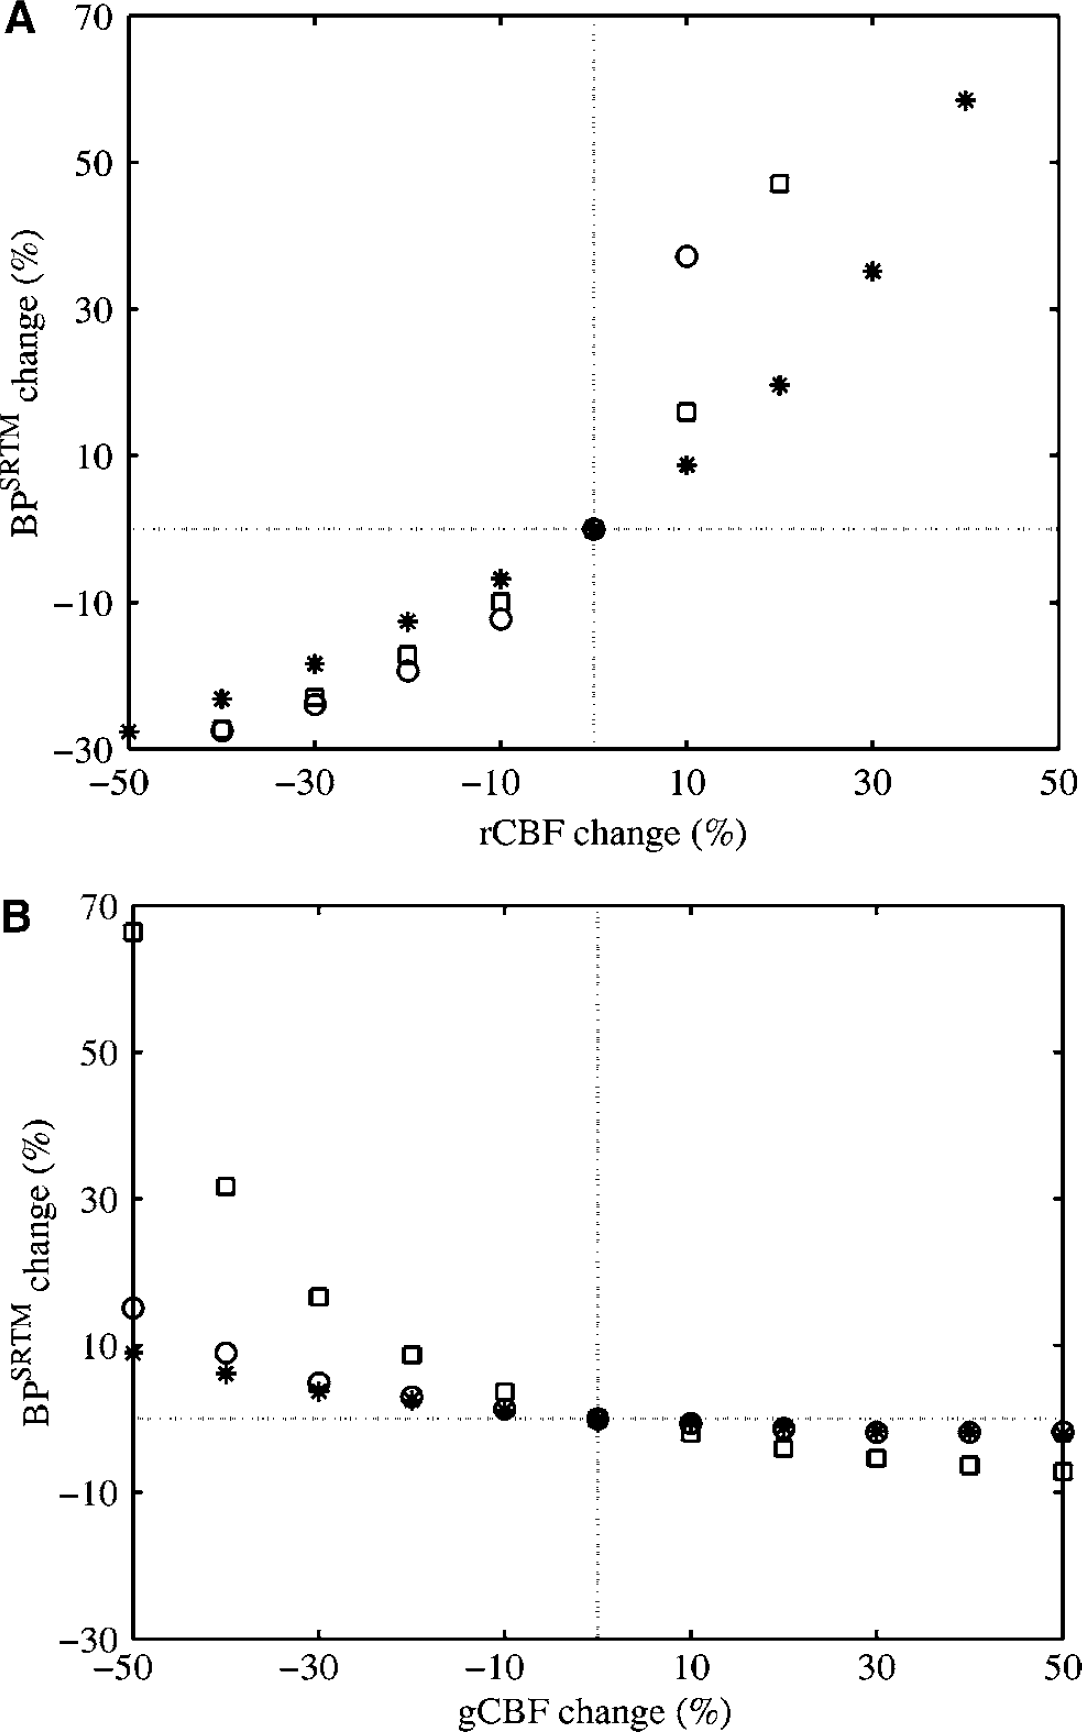
Apparent change in binding potential (BP) in different tissues (* thalamus, □ hippocampus, ○ frontal cortex) estimated from the simplified reference tissue model (SRTM) because of (
Discussion
Quantitative methods that do not require a plasma input function, thereby avoiding the need for an arterial cannulation, are preferred in clinical studies. The binding potential has been promoted as the parameter of choice to quantify [11C]FLB 457 kinetic PET data (Olsson et al, 1999; Vilkman et al, 2000; Ito et al, 2001). Good agreement between different methods of deriving BP has been shown (Olsson et al, 1999; Ito et al, 2001), and the simplest of these, the SRTM using a cerebellar reference region, has been widely used by several groups, in a growing number of pharmacological and clinical studies. However, consistency across quantification methods does not guarantee accuracy or robustness to confounding factors. In the work reported here, the quantification of dynamic [11C]FLB 457 PET studies was revisited, presenting additional evidence from rats and humans for specific binding in the cerebellum, and quantifying the substantial errors that can result when the cerebellum is used as a reference region in the measurement of in vivo affinity, binding potential and occupancy.
Tissue Kinetics
The rate constants and binding parameters estimated for the human PET studies presented here (Table 2) agree very well with previously reported values (Ito et al, 2001). Higher K1 values of ~ 0.4 ml/ml/min as well as higher K1/k2 and lower k3/k4 values were reported for shorter (63 min) human PET studies (Olsson et al, 1999). From the low (cerebellum) to the higher (thalamus) D2/D3 receptor density regions, increasing k3 values but similar k4 values were obtained in all three studies. In Vilkman et al (2000), as in Ito et al (2001) and this study (Figure 6), the mean k3/k4 ratio for the group of healthy volunteers was higher than the mean BP estimated from the VDt ratio, and the relative difference was greater for lower D2/D3 receptor density regions than for higher ones. These observations suggest that the cerebellar VDt is an overestimation of the volume of distribution of the free and nonspecific binding compartment. In healthy volunteers under baseline condition, the k3/k4 ratio estimates of [11C]FLB 457 appear to be relatively reliable given that they correlated with the BP estimates from the VDt ratio and that the standard errors on the k3/k4 ratio (ranging from 2% to 28%) were comparable with or larger than those on the BP estimates from the VDt ratio (ranging from 2% to 18%).
Here, the cerebellar kinetics of [11C]FLB 457, like those of all other extrastriatal tissues sampled, could not be adequately described by a single compartment (Figure 1). The second tissue compartment may represent specific binding, nonspecific binding which is kinetically distinguishable from the free ligand, tissue heterogeneity or a radiolabelled metabolite entering the brain. The latter is unlikely given that no radiolabelled metabolites of [11C]FLB 457 have been detected in rat striatum up to 70 min post-injection (Suhara et al, 1999). As care was taken to remove most of the white matter contribution from the ROIs, the second tissue compartment in the cerebellum is unlikely to result from tissue heterogeneity, as previously proposed (Vilkman et al, 2000). Using a single injection of [11C]FLB 457, it was not possible to estimate the volume of distribution of the nonspecifically bound compartment separately from that of the free compartment as a three-tissue compartment model was not statistically justifiable. In baboon brains, however, the nonspecifically bound ligand concentration in cerebellum was estimated to represent less than 2% of the radioactivity concentration at equilibrium (Delforge et al, 1999). It may be possible to assess the nonspecifically bound compartment when a large proportion of the D2/D3 receptors are occupied, in which case the two-tissue compartment model may become inadequate. Taken alongside the autoradiographic findings (Kessler et al, 1993; Hall et al, 1996), non-negligible specific binding in cerebellum would thus appear to be the most plausible explanation for the second tissue compartment in the cerebellum.
Effects of Co-Injected Stable FLB 457
At the dose of stable ligand co-injected to the human volunteers participating in this study (< 4 μg), a mass effect was observed for the binding parameters, whether VDt or BP. By normalizing VDt of the target region with that of the cerebellum, the between-subject variability was reduced and the mass effect observed in both regions cancelled out in part. These observations should not be misinterpreted as a favorable property of the SRTM but instead support the presence of saturable or specific binding in the reference region which cannot be detected by the SRTM. The specific activity achieved in this study (range 25 to 101 MBq/nmol) is comparable to that quoted in many clinical studies (Aalto et al, 2005; Talvik et al, 2001), but falls short of the 200 MBq/nmol recommended for single injection studies (Olsson et al, 2004). Below this level, the dose of co-injected stable ligand should be restricted to a very narrow range for group studies or matched for each individual in paired studies in order not to attenuate or amplify physiological or pharmacological effects under investigation (Montgomery et al, 2006). Some of the variability observed in previous test–retest studies in humans (Vilkman et al, 2000; Sudo et al, 2001) is likely to be removed if repeated at a higher SA, thereby enabling a better estimation of biological variability in extrastriatal D2/D3 receptor availability.
Effects of Specific Binding in the Cerebellum
Using a Scatchard approach with the peak equilibrium method to estimate the concentrations of bound and free ligand, Suhara et al (1999) estimated the in vivo KD of [11C]FLB 457 as 0.7 to 1.1 nmol/L in human extrastriatal tissues. These estimates were revised by Olsson et al (2004), to 0.27 to 0.43 nmol/L. Here, the same approach was applied to the dose–response curves for the rat uptake index using estimates of free ligand concentrations from either the non-saturable uptake estimate or the measured cerebellar uptake. The resulting KD values using the cerebellar uptake were overestimated by about a factor of five compared with those using the nonsaturable uptake. It is feasible that the in vivo affinity in humans could similarly have been underestimated. Furthermore, the linear fits to the Scatchard plots from the rat data were restricted to doses of stable ligand above the ED50 value in order to limit the underestimation of the affinity that results from the upward curvature at high doses when the contribution of nonspecific binding becomes significant (Kermode, 1989). On a Scatchard plot comprising only two or three data points, as is typically the case with human PET data, this curvature cannot be clearly identified and may contribute to a further underestimation of the in vivo affinity.
A higher in vivo affinity would not only increase the sensitivity of binding parameters to amounts of co-injected stable FLB 457, but also increase the true binding potential in all regions, and thus improve the detectability in low-binding regions. The dose–response curves measured in rats in the present study predict that 60% of the total cerebellar uptake corresponds to specific binding (Table 3a). Although caution should be exercised when generalizing these rat data to other species, as specific binding is dependent on factors such as dopamine receptor densities and subtype distribution, this value is nevertheless comparable to the value of 75% estimated by Delforge et al (1999) in baboon brain. The nonspecific binding contribution to total tissue uptake should, by definition, be estimated under full receptor occupancy, or inferred from multiple intermediate doses of stable radioligand. As these methods cannot easily be applied to humans, a direct measure of the magnitude of the specific binding of [11C]FLB 457 in human cerebellum is not available. Using the rate constants of the two-tissue compartmental model, the proportion of the cerebellar VDt which represents specific binding can, however, be estimated as (k3/k4)/(k3/k4 +1), assuming that the second tissue compartment represents specific binding. Consistent with their estimate from high and low SA groups (Olsson et al, 2004), the data from Olsson et al (1999) give a value of 11% for a 63-min PET study duration. Extending the PET study up to 90 min, the value is increased to 23% using the data from Ito et al (2001), to 29% according to the data from Vilkman et al (2000), and to 39% from the data in Table 2. Studies performed using other high-affinity D2/D3 receptor radioligands are in agreement. When 90% of the striatum was occupied by the D2 antagonist haloperidol, the cerebellar VDt of [18F]fallypride (in vitro KD = 0.03 nmol/L), was reduced by 40% in monkeys (Mukherjee et al, 2001). Amphetamine was also observed to decrease the cerebellar VDt of the radiolabelled D2 receptor agonist [11C]NPA in a dose-dependent manner in baboons (Narendran et al, 2004). Likewise, the cerebellar VDt of [11C]FLB 457 decreased with increasing doses of methylphenidate in healthy volunteers (Montgomery et al, 2006). Thus, neuroleptic drugs and endogeneous dopamine change the binding of high-affinity radioligands in the cerebellum to a measurable extent, despite the very low D2/D3 receptors density. Neglecting their contribution when using the cerebellum as a reference region will result not only in the underestimation of the binding potential of high-affinity radioligands in extrastriatal tissues but also in errors in the estimation of changes in binding potential.
Differential Occupancies
Conflicting findings have been reported on the in vivo measurement of limbic selectivity of D2/D3 receptor occupancy by atypical antipsychotics using PET or single photon emission tomography (SPET) with high-affinity radioligands (Farde et al, 1997; Talvik et al, 2001; Pilowsky et al, 1997; Bressan et al, 2002). Scanning durations shorter than the time required to reach equilibrium in all regions have been investigated as a potential methodological source of disagreement between [11C]FLB 457 and [123I]epidepride (Olsson and Farde, 2001; Erlandsson et al, 2003). Owing to the short half-life of the radioisotope, [11C]FLB 457 PET studies cannot be extended beyond 90 min, and paired studies with [11C]raclopride have been performed in order to compare striatal and extrastriatal occupancies. Here, the occupancy in extrastriatal regions was shown to be underestimated because of to the presence of significant amount of specific binding of [11C]FLB 457 in the cerebellum (Figure 7A). In contrast, estimates of striatal occupancies are not compromised by the small amount of specific binding of [11C]raclopride in the cerebellum (Table 4). A direct comparison between the two radioligands could thus hide a hypothesized preferential occupancy by atypical antipsychotics in extrastriatal regions compared with that in the striatum. On the other hand, the in vitro affinity of [123I]epidepride is similar to that of [11C]FLB 457 (de Paulis, 2003), and thus the effects of specific binding in the cerebellum on the estimation of the occupancy described here for [11C]FLB 457 also hold for [123I]epidepride. When measuring striatal and extrastriatal occupancies with the same high-affinity radioligand (as was done with [123I]epidepride), preferential occupancy by atypical antipsychotics could be amplified as the D2/D3 receptor occupancies would become more severely underestimated as the occupancy decreases (Olsson and Farde, 2001). Preferential occupancies could even be created to some extent if the occupancy was lower in the reference than in the striatal and extrastriatal regions.
Positron emission tomography studies with the high-affinity radioligand [18F]fallypride provide simultaneous measurements of striatal and extrastriatal D2/D3 receptor occupancy and thus can also be used to test the hypothesis of preferential occupancy by atypical antipsychotics. Kessler et al (2005) found that the atypical antipsychotic olanzapine did not occupy preferentially the limbic D2/D3 receptors at doses that led to striatal occupancies above 60%. Compared with haloperidol, the occupancy by olanzapine was significantly lower only in the substantia nigra. Despite using the same radioligand, the same quantification method (the SRTM using a cerebellar reference region) and a sufficiently long scan duration, Gründer et al (2006) arrived at the opposite conclusion, that is, that cortical D2/D3 receptors are preferentially occupied by clozapine for striatal occupancies below 60%. Differences in the pharmacology of the two drugs could account for these discrepancies. However, they may also have arisen from the different occupancy levels achieved, given that differential occupancies are lost at higher doses, and that the use of a cerebellar reference region leads to more severe underestimation at lower occupancy levels.
Effects of Changes in Cerebral Blood Flow
Changes in CBF may be caused by neurological or psychiatric diseases or by pharmacological or physiological manipulations. Ito et al (2001) were also concerned about the sensitivity of the [11C]FLB 457 BP estimates from the SRTM to changes in CBF. When CBF was simulated to vary from 0.22 to 0.62 ml/ml/min, BP estimates were reported to be not greatly affected by K1 differences between the target and reference regions, unlike the ratio R1, which was underestimated, particularly when associated with large BP values. In Ito et al (2001), the cerebellar kinetics were modelled using a one-tissue compartmental model and constrained to have the same K1/k2 ratio as that in the target region, thereby fulfilling two assumptions of the SRTM. Here, without a priori assumptions, different results were obtained: R1 values were not biased by either global and regional changes in CBF (data not shown) as opposed to BP values which were found to be very sensitive to the same changes (Figures 8A and 8B). Using the less extracted radioligand [carbonyl-11C]-WAY-100635, rCBF-induced BP changes have also been predicted (Gunn et al, 2000), in the same direction, but of a smaller magnitude than those presented here. Logan et al (1994) have shown that radioligands with large permeability (e.g., [11C]cocaine, having K1 values similar to that of [11C]FLB 457) are more affected by variable CBF than less permeable radioligands (e.g., [11C]raclopride, with K1 values comparable to that of [carbonyl−11C]WAY-100635). Thus, activation paradigms that increase CBF in both the target and reference regions could be interpreted as showing decreased specific binding, possibly related to increased synaptic dopamine levels. Conversely, compounds that decrease CBF globally could obscure a decrease in BP because of increased synaptic dopamine levels. The sensitivity of [11C]FLB 457 to CBF changes requires robust study design, accurate quantification and careful interpretation of PET data.
Conclusion
Saturable binding was estimated in rats to account for more than half of the total cerebellar uptake of [11C]FLB 457, invalidating use of the latter as an estimate of nonspecific binding. The use of the cerebellum as a reference region in the Scatchard analysis of rat data led to the underestimation by a factor of about five of the in vivo affinity of [11C]FLB 457, which may be even higher than previously estimated, thereby increasing the specific activity required in order to avoid the mass effect of coinjected stable FLB 457. In the presence of specific binding in the reference region, the apparent binding potential is underestimated, the magnitude of which depends on the in vivo affinity of the radioligand and on the receptor densities. Using the cerebellum as a reference region in the measurement of drug occupancy may lead to erroneous conclusions: Using radioligands of different affinities for high and low-binding regions can obscure differential occupancies between regions of different receptor densities, whereas preferential occupancy in low over high binding regions can be amplified even when using a single high-affinity radioligand. If the binding potential of [11C]FLB 457 is estimated using the simplified reference tissue model, changes in dopamine levels can be confounded by changes in cerebral blood flow. Only in cases where changes in specific binding in the cerebellum have been shown to not occur between conditions or when a treatment does not induce changes in cerebral blood flow compared with baseline, can the SRTM be used and conclusions about changes in either D2/D3 receptor densities or dopamine levels in the target regions be made.
Footnotes
Acknowledgements
The authors thank Rabia Ahmad and Ella Hirani for their help in the rat data acquisition. We are also grateful to the staff of Hammersmith Imanet who contributed in the human data acquisition and processing. The helpful discussions with Dr Vin Cunningham and Dr Rainer Hinz are particularly acknowledged. AJM was supported by the Wellcome Trust, and PMG by the Medical Research Council.