
Abstract
The volumetric flow rate (VFR) waveform over the cardiac cycle in the cerebral vasculature is a significant factor in many studies, which involve cerebrovascular function. Perhaps contrary to expectation, the literature in this area is sparse and the characteristics of blood flow waveforms are ill defined. A better understanding of the variation of blood flow rate and pulsatility may aid our knowledge of risk factors involved in diseases and conditions, such as stroke, arteriovenous malformation, or aneurysm rupture. This study sought to characterise the blood flow waveform over the cardiac cycle at levels within the carotid artery and basilar artery (BA) in a normal cohort. The study cohort consisted of 22 subjects (recruitment age: 20 to 40 years) with no history of vascular disease (median age=26 years, interquartile range=25 to 32 years). Two-dimensional quantitative phase-contrast magnetic resonance imaging was performed on each subject at nine anatomic locations within the carotid artery and BA. Significant differences in pulsatility were present within the carotid tree. Archetypal VFR waveforms were established for this group at the nine locations. A normal individual's VFR waveform at a location within the carotid tree can be estimated by taking the group's archetypal waveform for that location, and scaling by the individual's average flow rate.
Introduction
Characterisation of volumetric flow rate (VFR) waveforms over the cardiac cycle may be important for establishing baselines by which pathologic changes can be assessed and modelled. Windkessel models have shown that changes in arterial compliance may alter VFR waveforms (Westerhof et al, 2009). As arterial compliance is related to the status of the vasculature, vascular disease may be indicated by changes in VFR waveforms. For example, it has already been shown that systemic vascular compliance is reduced in the early stages of type I diabetes (Romney and Lewanczuk, 2001). Furthermore, there is growing recognition that cerebrovascular disease is associated with the development of cognitive impairment (Heyman et al, 1998; Kalaria, 2002, 2003). For example, the risk of developing Alzheimer's disease is closely associated with many factors that are generally also linked to vascular disease (Amaducci et al, 1986; Kalback et al, 2004; Skoog et al, 1998). Knowledge of VFR dynamics over the cardiac cycle may also be useful in other areas, such as in the assessment of rupture risk of a cerebral aneurysm. In addition, numerical models of the cerebrovasculature require reliable input functions that are currently not readily available.
Therefore, as there is a known association between disease and arterial compliance, and a further link between arterial compliance and the VFR waveform, the VFR waveform could be useful in the context of neurodiagnosis. The purpose of this study was to improve the characterisation of the temporal profile of VFR in normal individuals as the arterial blood travels through the carotid tree.
Previous studies in this area are mainly restricted to large qualitative changes due to stenoses etc., using Doppler ultrasound (DUS). A significant deviation from this was the study by Marshall et al (2004), which used phase-contrast (PC) magnetic resonance imaging (MRI) and sought to provide information about the redistribution of blood flow in the common carotid artery (CCA), internal carotid artery (ICA), and external carotid artery before and after carotid bifurcation. Recent work has attempted to establish more qualitative data. Holdsworth et al (1999) used DUS to produce a typical VFR waveform at the CCA. Following on from this, Ford et al (2005) used PC MRI to produce archetypal VFR waveforms in the ICA and vertebral artery. Both of these publications established the method of waveform characterisation adopted in this study. This comprises the production of an average waveform by identifying the key features of each waveform and averaging these features across subjects. Such a feature-based approach can minimise the ‘invisibility’ of more subtle features, such as local minima and maxima, which can vary in time between subjects.
This study provides archetypal waveforms at locations along the carotid arteries and the basilar artery (BA), as well as information on intrasubject differences between arterial locations, using PC-based quantitative flow MRI.
Materials and methods
Magnetic Resonance Imaging
Local ethics committee guidelines were followed for this study, and informed written consent was obtained from all volunteers. A total of 20 adults with no known vascular or neurologic abnormalities agreed to participate in this study. Of these, three were women. The age range for recruitment was 20 to 40 years resulting in a median age of 26 with an interquartile range of 25 to 32 years.
Magnetic resonance imaging was performed on a clinical system operating at 3 T (Achieva 3.0T, Philips Medical Systems, Best, The Netherlands). A standard, eight-channel head coil was used for radiofrequency signal reception. Vascular anatomy from the CCA to a level distal to the circle of Willis was determined using the standard time-of-flight MR angiographic method. Maximum intensity projections derived from the resultant time-of-flight three-dimensional data set were used to define the placement of each two-dimensional slice to be used for quantitative flow estimation (Q-flow, Philips Medical Systems). The Q-flow technique was based on a single-slice, multiphase, fast-field echo sequence which encoded flow parallel to the slice-encode direction. Thus, for each vascular region to be sampled (Figure 1), the slice was placed perpendicular to the long axis of the vessel of interest. Measurements were made on both sides of the carotid arteries in the following approximate locations: CCA, 3 cm proximal to bifurcation (point A); ICA, 3 cm distal to bifurcation (ICABIF, point B); ICA, 1 cm proximal to the siphon (ICBCIP, point C); ICA, distal to the siphon, proximal to the circle of Willis (ICACOW, point D); and midpoint of BA (point E). The same technologist imaged all subjects to minimise the scan-setup variability. The PC cine sequence (echo time=3.7 msecs; repetition time=7.7 msecs; field echo single shot interval=16 msecs; flip angle=10°; in-plane acquisition resolution=1.72 × 1.60 mm2, interpolated to 0.86 × 0.86 mm2; slice thickness=5 mm) sampled k-space in a continuous, linear-ordered, phase-encoded scheme. Centrally acquired vector electrocardiogram was used to retrospectively gate the timing of 40 time points over the cardiac cycle. At each of the 40 time points, 2 data sets were sampled corresponding to the application of positive and negative movement-encoding gradients in the slice direction. An appropriate velocity encoding factor relating to these gradients was chosen based on previous experience, to prevent aliasing, while maximising the sampling bandwidth to ensure high precision with regard to velocity. The absence of velocity aliasing was checked on each scan. Typical settings were 150 cm/sec for CCA measurements and 100 cm/sec for all others. Errors caused by second-order residual background phase offsets were minimised by the inclusion of low-pass filtering and concomitant gradient correction techniques. In addition to the magnitude (anatomic) of field echo images, subtraction between the two data sets yielded phase images plus calculated flow maps. From the latter, quantitative flow-encoded information could be extracted by a region-of-interest analysis yielding VFRs at each spatial location for each subject (see below).
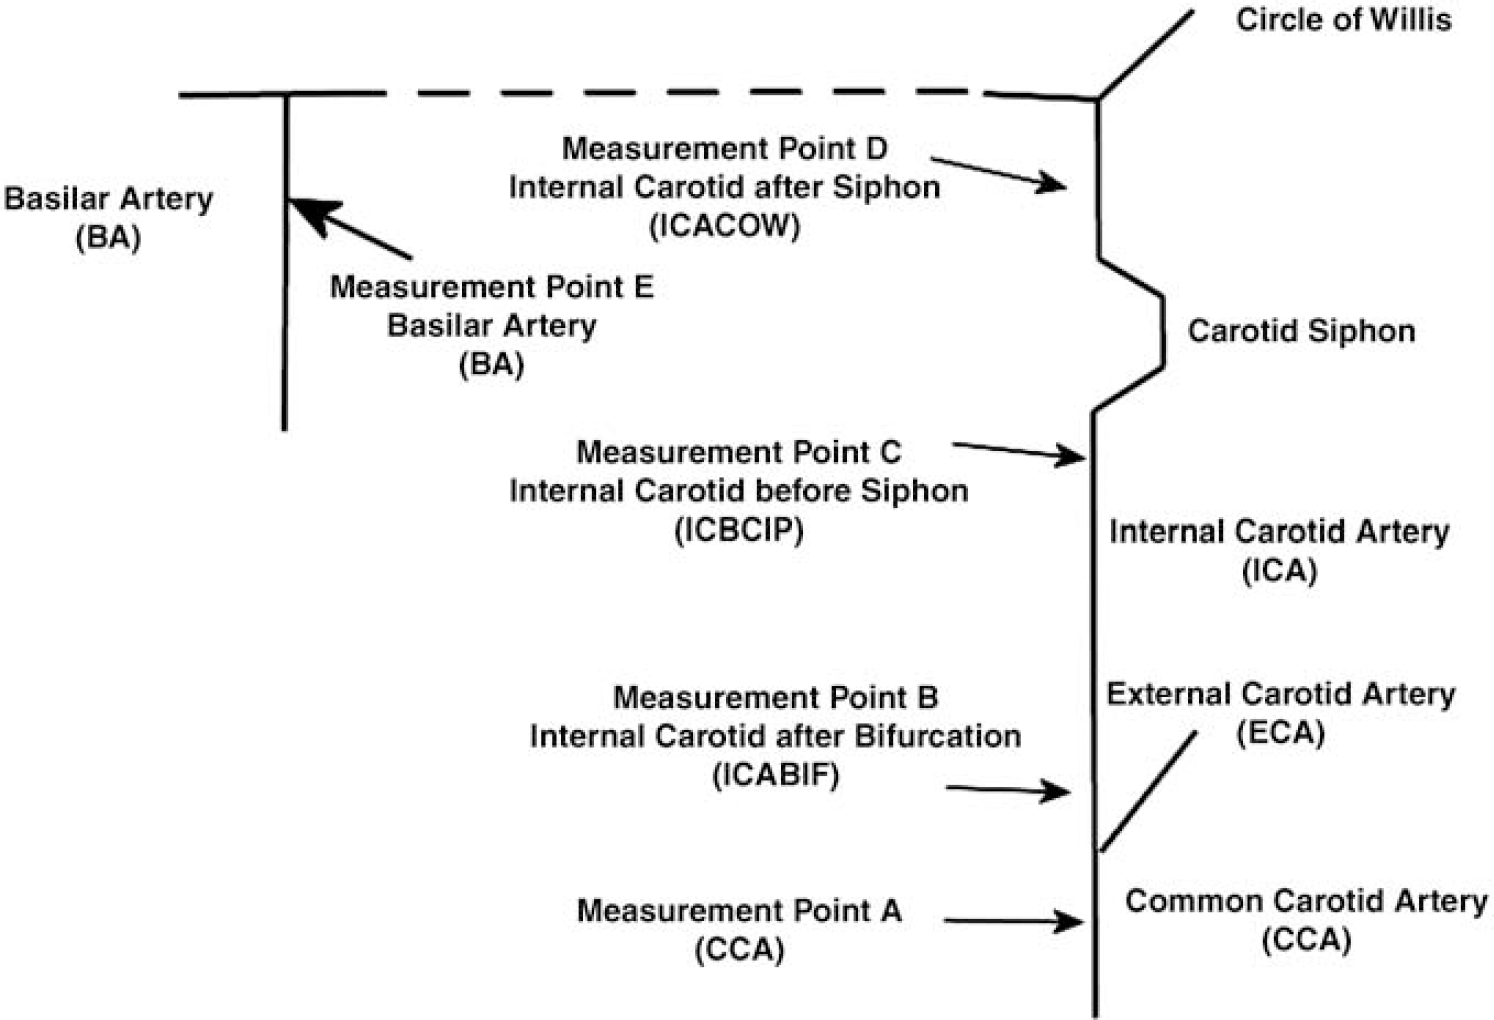
Measurement locations.
Table-occupancy time was kept within 1 h. Within this period, it was difficult to ensure that all measurements were obtained for all volunteers. The tortuous nature of the arteries could also make slice selection perpendicular to the artery at the desired location difficult to achieve. To maintain a high degree of integrity in the final data set, data were rejected if there was doubt with regard to the placement of the measurement slice.
Postacquisition Q-flow proprietary analysis software (Philips Medical Systems, Best, The Netherlands) was used to extract VFR waveforms for each location by drawing a region of interest around the artery and integrating the velocity-encoded pixels within the region of interest at each frame within the cine sequence. The completed VFR waveforms were exported for analysis on PC.
Volumetric Flow Rate Waveform Feature Extraction
The total flow values at each location were analysed using the MATLAB 7.2 package (The Mathworks, Natick, MA, USA). Following the example of Ford et al (2005), a semiautomated algorithm was used to identify the key points on the waveform. The points M0, P1, M1, P2, M2, and P3 were noted manually (Figure 2). The global peak, P1, was used as the initial feature point. Working backwards from P1, the point M0 was defined as the point at which the gradient first changed sign. Working forwards from P1, the point M1 was defined again as the point at which the gradient first changed sign. Similarly, points P2, M2, and P3 were identified. Points H0, H1, H2, and H3 were identified using an automated algorithm that linearly interpolated from the original waveform to find the time to the associated half-peak from the associated local minima and peak. Points D1 to D3 were spaced equally between P3 and D4, D4 being the final point in the waveform. Time 0 was defined as M0.
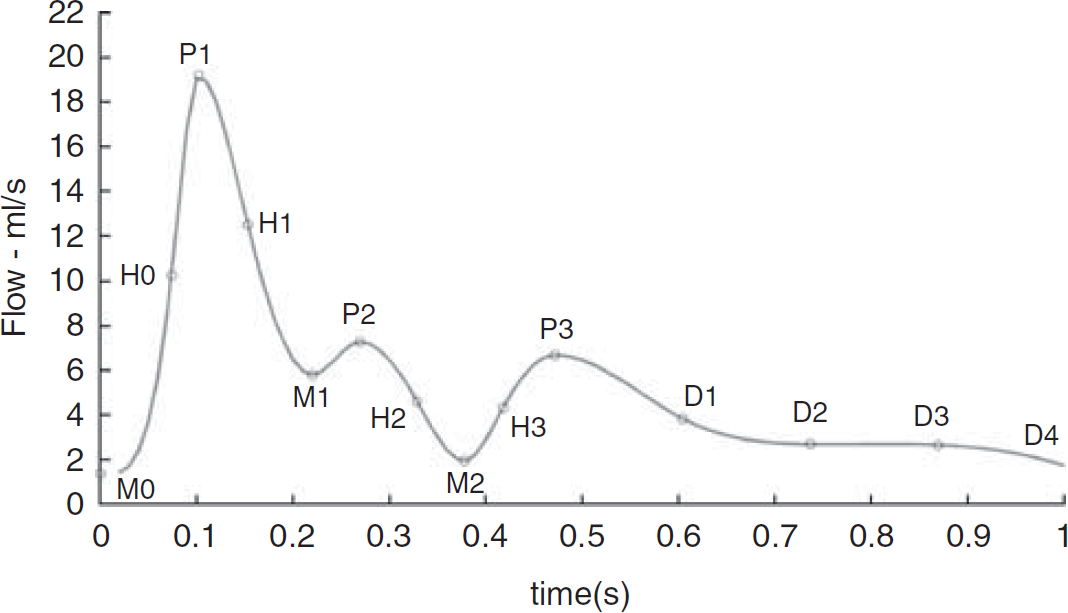
Waveform features.
If M1 to P2 was a plateau rather than a local minima followed by a local maxima, the start of the plateau was noted as M1 and the end as P2. If neither a plateau nor a peak occurred, a definite shallow gradient in the otherwise steep gradient after P1 to M2 was noted in a similar manner.
Splines were then fitted to the data to produce characteristic waveforms. In addition, an average waveform for each level, both left and right, was produced by taking the mean of the feature points, both their magnitude and time, and a spline was fitted in a similar manner.
The process was repeated by normalising each waveform by dividing each by its mean. In addition, the time points were normalised by dividing by the time taken to complete a cardiac cycle for each waveform. It is acknowledged that this ignores the behaviour that the systolic period extends much less than does the diastolic period (Ashman, 1942). This is unavoidable and any introduced error is unlikely to be significant.
This method of feature extraction and normalisation mirrors that of Ford et al (2005) as closely as possible. One methodical difference was the extraction of feature M2 and P2 when no definite P2 was identified. Therefore, characterisation of the waveform cannot be considered to have been significantly improved upon at point B, but measurements are made at several more locations.
Statistical Analysis
The waveforms were assessed using a pulsatility index (PI) adapted from an index used in DUS for assessing the pulsatility of velocity waveforms (Johnston et al, 1978).
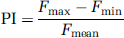
where Fmax is the maximum flow rate in waveform, Fmin the minimum flow rate in waveform, and Fmean the mean flow rate in waveform.
Intralocation variations were assessed by comparing the PIs at these locations conducted using Student's t-tests.
Results
The number of data sets obtained for each location is as follows (the numbers in brackets are those obtained on the right/left tree): CCA point A=21 (11/10); ICABIF point B=40 (20/20); ICBCIP point C=24 (12/12); ICACOW point D=36 (18/18); and BA point E=15.
The error bars depicted in Figure 3 are significantly reduced when the waveforms are normalised. The average s.d. of the absolute waveform features is 23% of the value of the mean points. This is reduced to 9% when the data are normalised. This indicates that although there is great variance in the absolute values of the features, the shape of the waveform is very similar across all subjects.
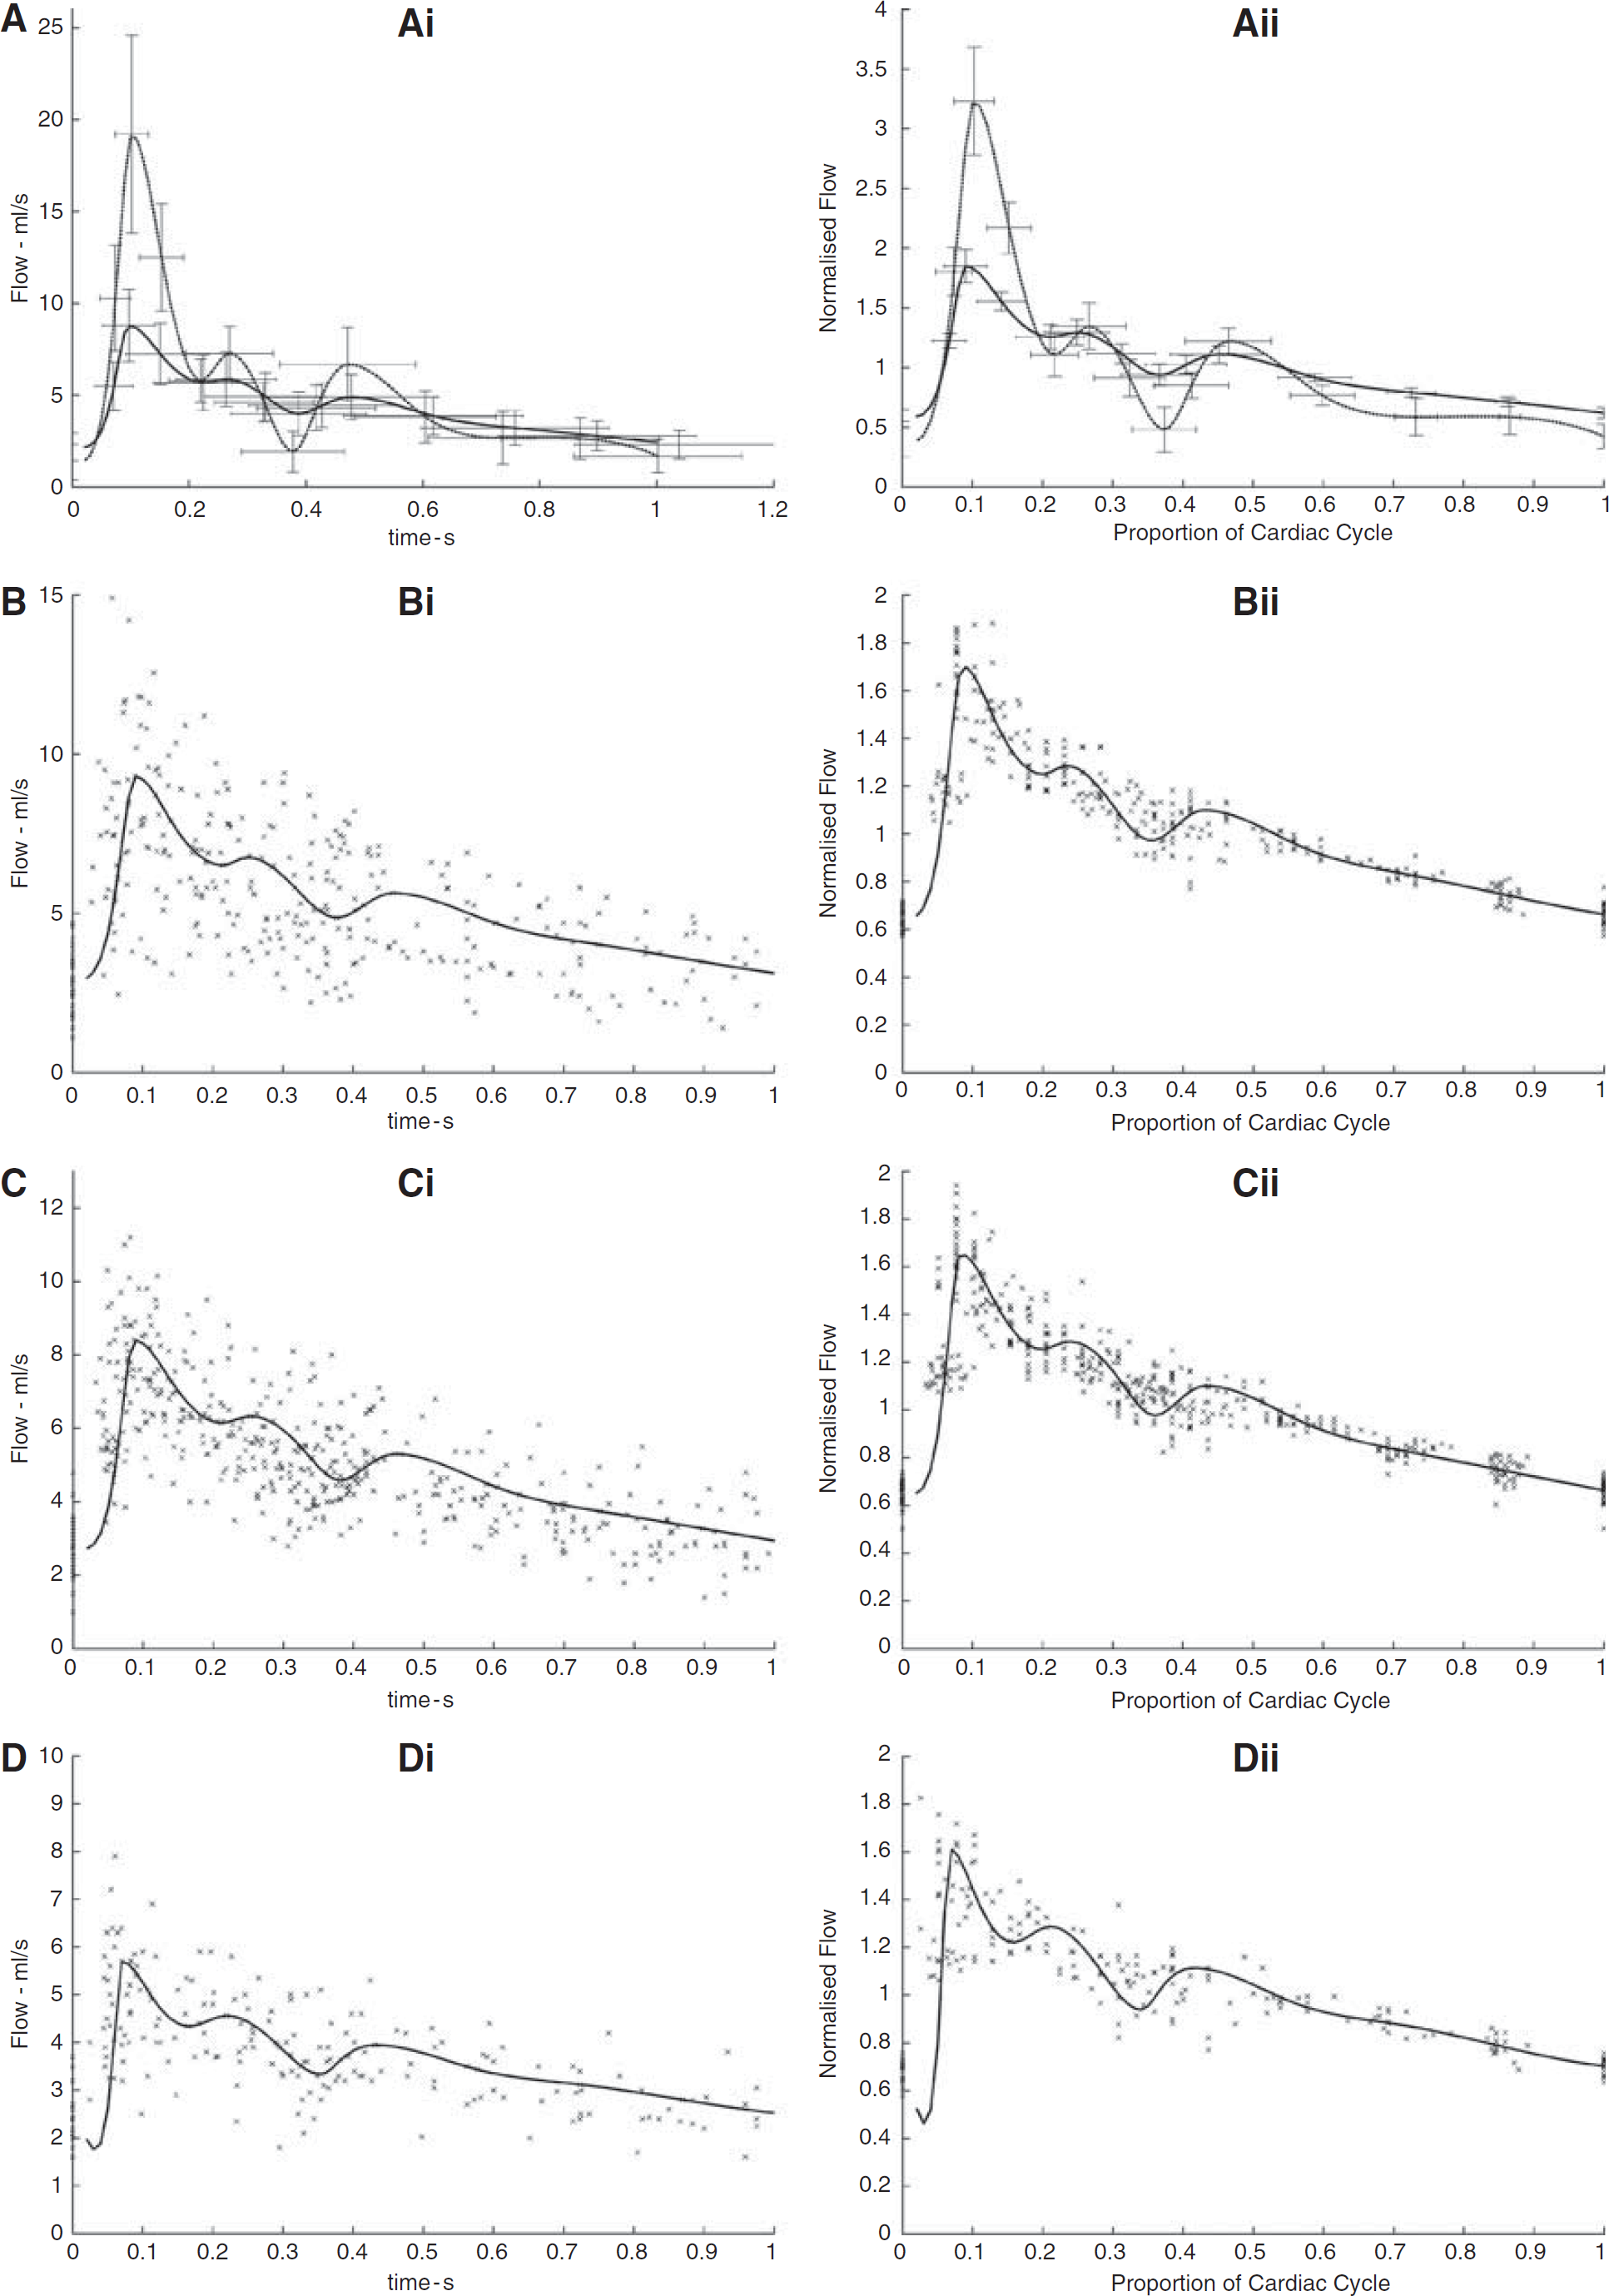
Mean absolute waveforms (
A trend of pulsatility reducing along the carotid tree was found (Figure 4). When analysing intrapatient data, it was shown that in 18 cases, of a possible 20, there was reduction in pulsatility of more than 50% at point B when compared with that at point A. Of the remaining two cases, pulsatility decreased by 49 and 38%, respectively. In 23 cases, of a possible 25, there is a further decrease between points B and C, although this decrease is not as large as that between points A and B. Between points C and D, of 21 available data sets, 7 increased and 14 decreased in pulsatility.
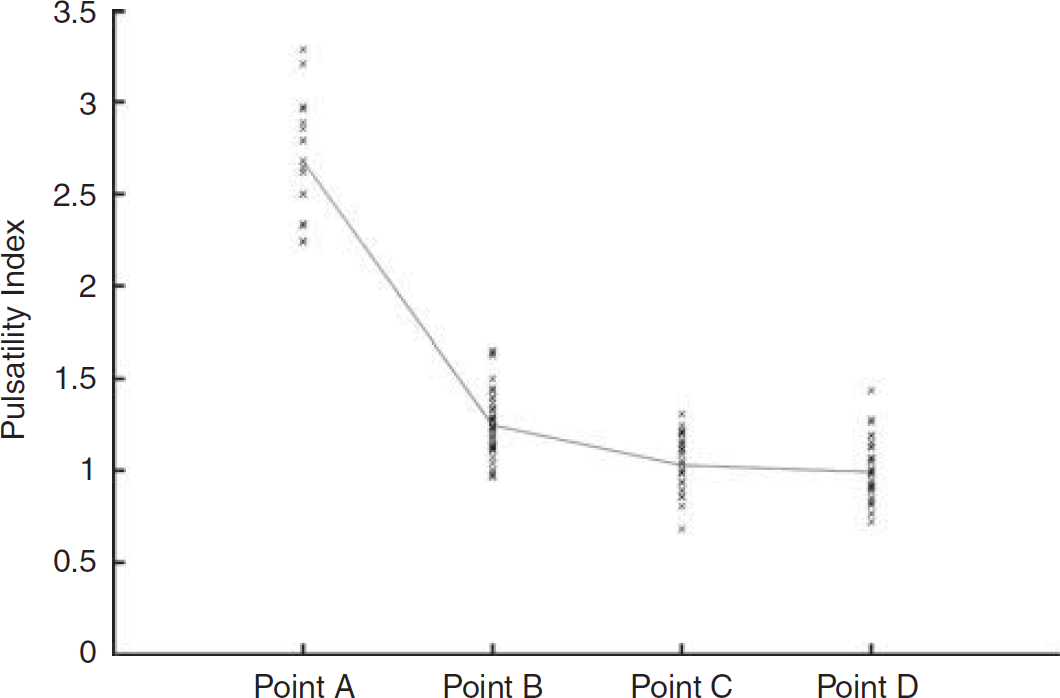
Pulsatility index for all waveforms at each level in the carotid tree (see Figure 1). Point A=common carotid artery; point B=internal carotid artery after bifurcation; point C=internal carotid artery before siphon; point D=internal carotid artery after siphon. A line connecting the mean of each location is also shown.
An inspection of the intrapatient maximum flow rate also clearly showed a change in VFR dynamics in the common carotid when compared with that in the internal carotid.
t-tests (Table 1) were carried out on various groups of data by comparing their PIs. The null hypothesis is that the data from both regions A and B are obtained from distributions with equal mean pulsatility. These results show that there is little difference between pulsatility in the left and right carotid arteries, and data from both sides are grouped for further analysis at the same measurement level. However, there is a statistically significant difference between pulsatility measured at the CCA and at ICABIF and also between the ICABIF and ICBCIP. Pulsatility measured on either side of the siphon (CBCIP and ICACOW) is not shown to be statistically different.
Comparison of pulsatility indexes obtained at various locations
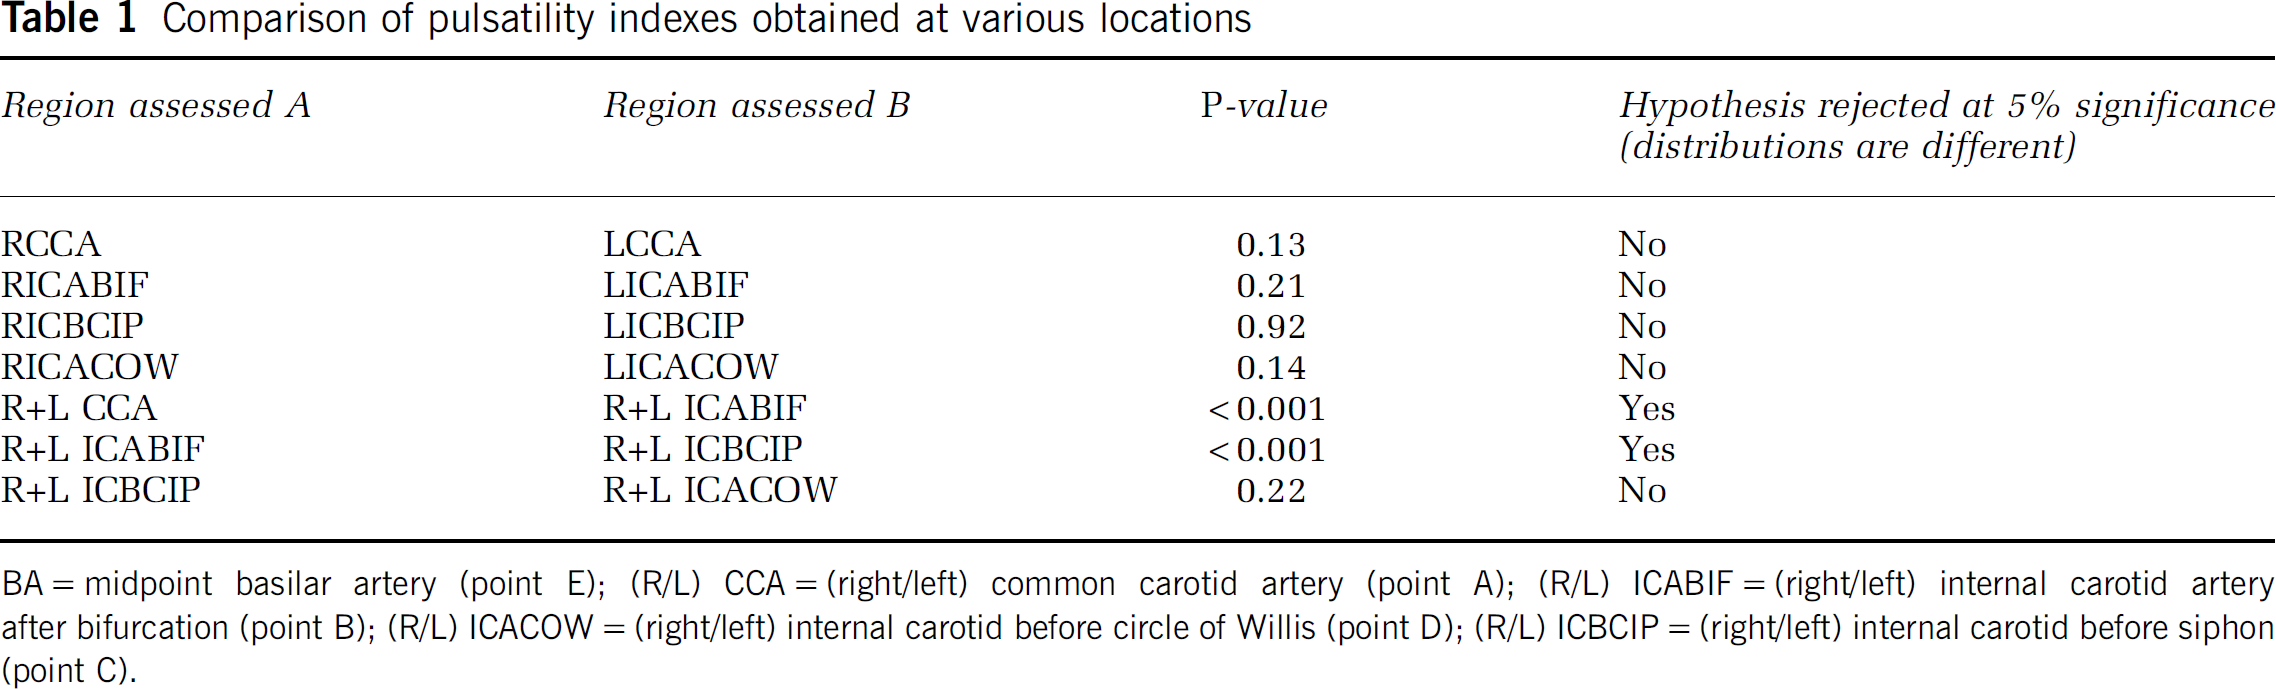
BA=midpoint basilar artery (point E); (R/L) CCA=(right/left) common carotid artery (point A); (R/L) ICABIF=(right/left) internal carotid artery after bifurcation (point B); (R/L) ICACOW=(right/left) internal carotid before circle of Willis (point D); (R/L) ICBCIP=(right/left) internal carotid before siphon (point C).
Discussion
Mean Waveform
Figure 3 shows the mean absolute and normalised waveforms at each location. The relatively small s.d. of the normalised waveforms support the finding of Ford et al (2005), in that intersubject variations can be accounted for by taking these mean waveforms and scaling by the average flow over the cardiac cycle.
There is a significant change in the VFR waveform measured at points A and B. These changes are much greater than any changes within the ICA, despite the spatial distance between points B, C, and D being much larger than that between locations A and B. This is important for modelling as it implies that the major influences on changing the VFR as blood ascends through the arterial tree are bifurcations rather than the influence of the length of an arterial pathway. Another point of significance across this distance is the carotid bulb. The properties of this feature may itself be a significant factor in changing the waveform. It is known that there is slower flow and reversed flow in the carotid bulb due to focal dilatation. It is believed that this is related to slower flow and the ‘exit effect’ causing flow separation, which can extend into the internal carotid. Indeed, the loss of flow separation is said to be evidenced on ultrasound of atherosclerotic disease at the carotid bulb. Studies evaluating the static and dynamic characteristics of the common carotid bifurcation describe appreciable vessel wall motion with an increase in distensibility at the carotid bulb compared with the proximal CCA. Histopathological studies suggest that changes in the carotid artery elastin and collagen structure may contribute to the increased distensibility at the carotid bulb (Lusby et al, 1982). In addition, this site is also an important site for baroreceptors. The important role that baroreceptors have in regulating heart rate and vasodilatation, both factors that cannot be decoupled from PI and mean waveform shape elsewhere in the vasculature, mean that flow patterns at this location are of greater interest.
There is a smaller but statistically significant change between the pulsatility measured at points B and C. This implies that a long nonbifurcating length of artery, such as the ICA between points B and C, is associated with waveform change and variance, but the magnitude of the change is less than the changes due to bifurcations. Arterial wall compliance may be associated with pulsatility changes and is of particular relevance over this relatively long length of artery with no major bifurcations. However, any changes cannot be attributed exclusively to the physical properties of the artery as measurement location C is inside the skull. The skull is a relatively closed volume, and it is not unreasonable to suspect that this will have an effect on the ability of the artery to expand regardless of the physical properties of the arterial wall itself. For example, it has been shown that cerebrospinal fluid flow in and out of the skull is related to arterial blood flow into the skull, and this implies that arterial properties inside the skull may be a function of other factors than arterial properties outside the skull (Ursino, 1988; Hu et al, 2006).
Measurement locations C and D have only a small spatial distance between them but are separated by the siphon. However, there was no statistically significant change in pulsatility, suggesting that the siphon and perhaps other geometric arterial features, have little effect on the waveform shape.
Pulsatility Changes in the Carotid Tree
As is shown in Figure 4, the PI in the carotid tree dramatically decreases in the ICA when compared with that in the CCA. In all but one case, the available pulsatility decreases by more than 15% from the CCA compared with the most inferior measurements. The mean PI continues to decrease, much less dramatically as the waveform travels through the ICA. This further reflects the major assumptions in certain Windkessel models, that bifurcations are the major influences on VFRs as they propagate through the vasculature. However, it is also shown that there are more subtle changes within the ICA and that these changes must be taken into account when attempting to produce accurate models of the vasculature.
Possible Clinical Implications
Establishment of these baseline waveforms is important for comparison with waveforms obtained from subjects with known pathologies and for modelling of cerebral pathologies. For example, it has been shown that abdominal aortic aneurysms can change the measured waveform in the femoral artery (Wells, 2008) and a screening programme based on DUS of the common femoral artery has been suggested. If similar findings were to be established with, e.g., cerebral aneurysms, a comparison with baseline waveforms would be key to knowing the effect of aneurysm on flow and perhaps the assessment of associated stress and rupture risk. Just considering the geometric changes in the artery caused by an aneurysm would seem to suggest that there must be some disruption in flow. If these changes in flow are pronounced sufficient enough to be detected in the internal carotid extracranially, then it may be possible to develop a monitoring or screening regime, similar to the one proposed for abdominal aortic aneurysms (Wells, 2008), for cerebral aneurysms based on VFR waveforms over the cardiac cycle. If these were found, then it allows for the possibility that simple DUS, assuming appropriate reproducibility, could be used as a screening tool for groups at risk. In addition, it may be that the shape of the waveform may be used to infer prognostic information about the aneurysm.
It may be that a stenosis or other pathologic cause affects the flow in such a manner that the VFR waveform changes shape. This could be useful in assessing the disruption caused by pathologic cause. To do this, archetypal waveforms must be established.
This study's cohort consisted of healthy 20- to 40-year-old individuals and many of the pathologies discussed are particularly relevant to a more elderly age group. Another important factor that must be also considered is the normal stiffening of arteries associated with age affecting the arterial compliance. Simple Windkessel models (Westerhof et al, 2009) show that this will affect the waveform shape and perhaps even pulsatility. Therefore, the model of normal vasculature should include age dependence. Although stiffening with age is considered normal, what must also be considered is that stiffening is likely caused by a subject's diet, liver function, or a history of blood-property altering medical interventions (such as the use of statins). Another feature of ageing in this context is that arterial geometry can alter, becoming more tortuous and geometrically complex. This may further affect waveform shape and pulsatility and it seems likely that a more complex arterial geometry may reduce pulsatility. The cause of such change in vascular geometry is of some debate, perhaps resulting from or compensating for increased arterial stiffness. Further work in this area is warranted.
Phase-Contrast Magnetic Resonance Imaging and Ultrasound
An advantage of PC MRI in this context is that DUS suffers from intrinsic spectral broadening, which adds uncertainty to velocity estimation. This uncertainty in the measured velocity will vary with location along the vessel and hence, will have a bearing on measurements made at more than one site along the vessel. In addition, the shape of the sample volume in DUS results in a nonuniform insonation. Estimates of velocity in the anterior and posterior vessel walls can be included using an appropriate axial Doppler gate length; however, the narrow beam width will exclude contributions to the velocity from flow near the lateral walls. Visualisation of the artery can also be problematic especially in the transcranial DUS. The main advantage of using quantitative MR in this type of study is that flow through the carotid tree and BA/vertebral artery can be characterised at numerous anatomic locations, not being limited by the presence of skull bone thickness. The use of region-of-interest fitting algorithms can also limit errors related to movement over the cardiac cycle. Moreover, the three-dimensional nature of MR angiography used for vascular guidance in this protocol allows for accuracy of measurement plane placement perpendicular to the length of artery under investigation. Overall, it is the ability to perform measurements at multiple locations, which highlights the use of PC MR techniques in this study.
Relationship to Previous Work
This study intended to produce baseline, characteristic waveforms at various locations in the carotid tree and cerebrovasculature. In this way, this study hoped to show the manner by which the waveform changes as the pulse travels through the carotid tree and into the head and to provide realistic input functions for use in the haemodynamic modelling of the cerebrovasculature. Marshall et al (2004) provide quantitative data about the distribution of flow across the external artery, ICA, and CCA, which this study does not. These results have reinforced the work carried out by Holdsworth et al (1999) and Ford et al (2005) and used many of their methods to produce a study of the VFR waveform dynamics over the cardiac cycle of the arteries which are of significance to the brain at more anatomic vascular locations than previously achieved.
Conclusions
There are large intersubject variations in magnitude of average flow through both the carotid tree and BA. Despite this, normal subject-specific VFR dynamics can be characterised using the baseline waveforms shown herein, scaled by the average flow over the cardiac cycle. This supports the same finding in the study by Ford et al (2005) and extends it to the CCA, other locations in the ICA and BA.
There are statistically significant differences between the measured VFR waveforms in the CCA and ICA. Changes in the VFR waveform due to the length of ICA are also statistically significant, but these changes were more subtle. Changes in the VFR waveform across the siphon were not found to be statistically significant in this study.
Footnotes
Acknowledgements
The authors thank Dr R Hose and Professor P Griffiths (University of Sheffield) and Dr M Clemence (Philips Medical Systems) for help associated with this project. Work supported by UK NIHR: Technology Platform Funding (Diagnostic Imaging).
The authors declare no conflict of interest.