
Abstract
Resting- and acetazolamide (Acz)-activated-regional cerebral blood flow (rCBF) measurements were performed by consecutive single-photon emission computed tomography (SPECT) studies before and after Acz administration using equal-volume-split technetium-99m-L,L-ethyl cysteinate dimer. Quantitative rCBF images were converted from qualitative axial SPECT images by the application of Patlak plot graphical analysis with radionuclide angiography and Lassen's linearization correction. Total time span required for this study was 53 minutes. The unaffected side of 37 studies with unilateral vascular lesions and 45 studies without apparent vascular lesions showed 132 ± 17% and 140 ± 15% increase of mean CBF (mCBF), respectively, under Acz administration. Comparing these values, the Acz-activated rCBF increases of less-affected and affected hemispheres of 23 studies with bilateral vascular lesions (116 ± 13% and 113 ± 12%, respectively) was lower with high statistical significance (P < 0.001). For the other 20 cases, physiologic saline was administered instead of Acz. This group showed no changes in mCBF under placebo administration (after placebo/baseline; 100 ± 6%). Acetazolamide-activated rCBF increase was recognized clearly and easily using quantitative images. This noninvasive method is easy to perform and may be helpful to detect regional abnormalities of hemodynamic reserve in cerebrovascular diseases.
Acetazolamide (Acz), which increases cerebral blood flow (CBF) but leaves cerebral metabolic rate for oxygen unchanged (Vorstrup et al., 1984), has been widely used in combination with several CBF tracers, such as, 133Xenon (133Xe), N-isopropyl p-[123I]iodo-amphetamine (123I-IMP), technetium-99m hexamethylpropylene amine oxime (99mTc-HMPAO), and technetium-99m L,L-ethyl cysteinate dimer (99mTc-ECD), in single-photon emission computed tomography (SPECT) studies. For precise assessment of regional CBF (rCBF) changes, the study should be performed in succession during a single procedure to ensure baseline rCBF stability and reproducibility of the measurement without movement of the patient's head. Quantitative assessment is also required, especially for patients with bilateral or severe hemodynamic compromise, because bilateral decrease (or increase) of the response may obscure abnormalities if analyzed qualitatively.
The compound 99mTc-ECD is superior to 99mTc-HMPAO during Acz administration in terms of sensitivity of lesion detection and lesion-to-normal contrast (Nakagawara et al., 1994), probably because of lower back-diffusion from the brain to the blood (Ishizu et al., 1996) as well as its excellent radiochemical stability (Friberg et al., 1994). Although the first-pass brain extraction of 99mTc-ECD is lower than that of 99mTc-HMPAO (Friberg et al., 1994) and the loss of 99mTc-ECD from the brain in the period of 30 ∼ 100 minutes after injection was reported to be much higher than the corresponding loss of 99mTc-HMPAO (Holm et al., 1994), the washout rate is similar for high- and low-perfusion regions and is not affected by Acz administration (Hattori et al., 1996), so the relative image contrast was essentially unchanged with time (Friberg et al., 1994).
In this study, we applied a simplified noninvasive approach to measure resting- and Acz-activated rCBF using 99mTc-ECD without any venous or arterial blood sampling.
MATERIAL AND METHODS
Subjects of Acz activation study
The study population consisted of 87 patients (105 consecutive studies), 43 women and 44 men, with an average age of 61.9 ± 16.1 years (mean ± SD), who were suspected of impairment of cerebrovascular reserve. Types of stroke were transient ischemic attack or reversible ischemic neurological deficit, which did not contain major strokes but lacunar infarctions. Sixty (19 women and 24 men, with an average age of 58.1 ± 19.2 years) of 105 studies had stenosis apparently detected by magnetic resonance imaging angiography (MRA) or Doppler sonography findings (stenosis group). Thirty-seven (14 women and 13 men, with an average age of 63.2 ± 13.6 years) studies of the stenosis group had unilateral stenosis localized in the affected hemisphere (unilateral stenosis group). The remaining 23 studies (5 women and 11 men, with an average age of 50.2 ± 25.4 years) had stenosis bilaterally (bilateral stenosis group), whose affected side was decided mainly by clinical symptoms, or determined by the severity of MRA or Doppler sonography findings when they could not be judged according to symptoms. Forty-five (24 women and 20 men, with an average age of 65.3 ± 10.8 years) of 105 studies showed normal MRA or Doppler sonography findings (patent group).
Method of calculating baseline mean CBF
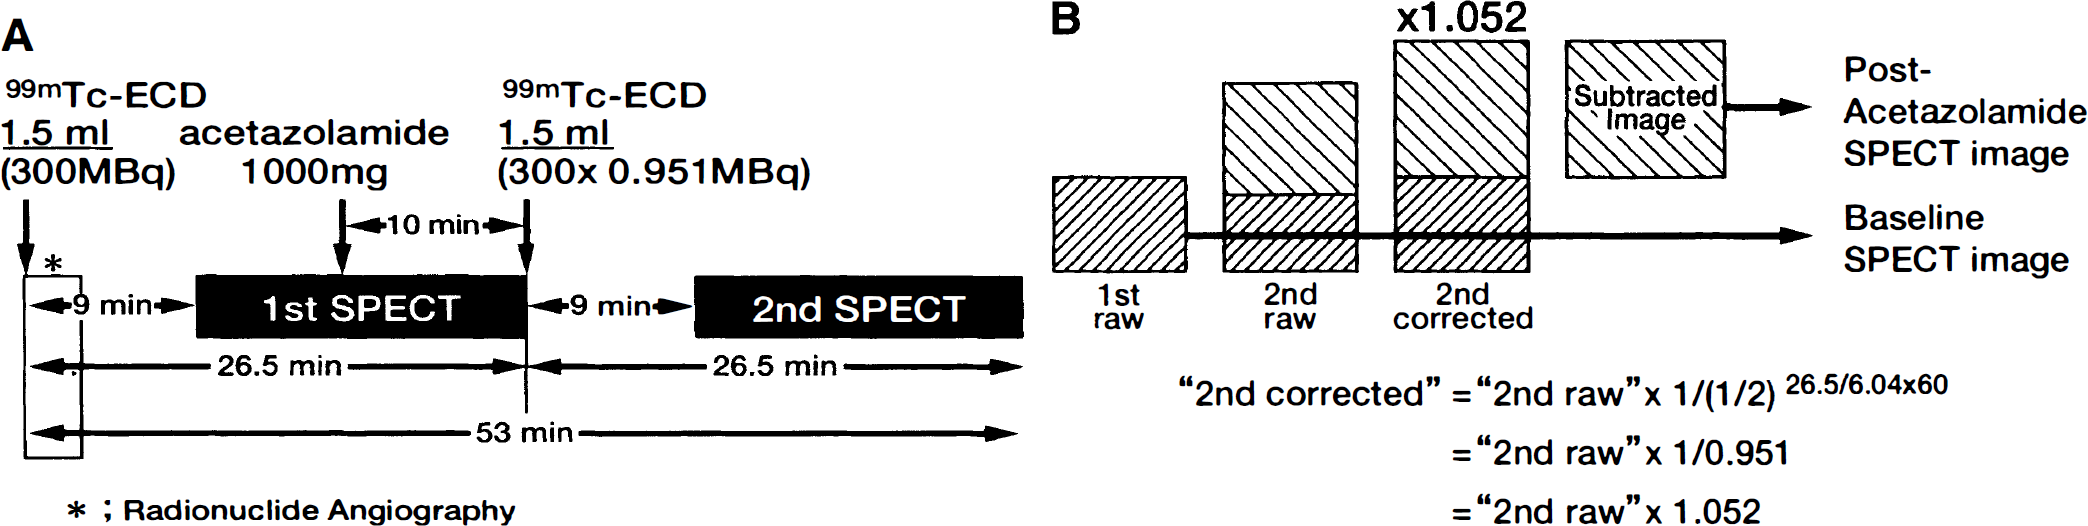
As shown in Fig. 1A, the reconstituted 99mTc-ECD delivered in the ready-to-use syringe-type-container (600 MBq/3 mL) was split easily but accurately to the same volume (1.5 mL) using a handmade spacer inserted between the syringe and its plunger rod. After good venous access was established, intravenous radionuclide angiography was performed by bolus injection of 99mTc-ECD (1.5 mL). The passage of the tracer from the aortic arch to the brain was monitored in a 128 × 128 format (magnification 1.0) for 120 seconds at 1-second intervals using a rectangular gamma camera of the two-head SPECT system (Prism 2000 XP, Picker International, Inc., Bedford Heights, OH) equipped with high-resolution parallel-hole collimators. Subjects wore eye masks and faced the detector in the supine position in a quiet room.
Study protocol.
Regions of interest (ROI) were drawn manually over the aortic arch and less-affected cerebral hemisphere. Assuming the unidirectional transfer process of 99mTc-ECD from the blood to brain, brain activity, B(t), can be expressed as:
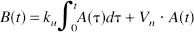
where A(t) represents the arterial activity, ku is the unidirectional influx rate, and Vn is the initial distribution volume. Dividing this equation by A(t) provides the following equation:
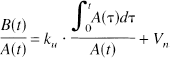
Plotting of B(t)/A(t) versus
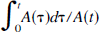
provides ku as the ordinate intercept of the straight line. Therefore, time activity curves of above-mentioned two ROI were plotted and the time delay of the brain activity curve to the aortic arch was corrected by shifting to the left to match the peak times of both curves. Then the graph of the ratio of brain activity to aortic arch activity at the respective times (ordinate: B(t)/A(t)) versus the ratio of aortic arch activity–time integral to aortic arch activity at the respective times (abscissa:
was composed to obtain the slope (ku) of a straight line fitted by a least square routine. A hemispheric brain perfusion index was determined as was described in the previous study (Matsuda et al., 1992).
Brain perfusion index was then converted to mean CBF (mCBF) value for the early picture method by 133Xe-inhalation SPECT using the regression equation given in the previous study (Matsuda et al., 1995). For the patent group, whose affected side could not obviously be determined by clinical symptoms and MRA or Doppler sonography findings, mCBF of whole brain was calculated from the ROI containing bilateral hemispheres.
Method of calculating Acz-activated mCBF
Seven minutes after the completion of radionuclide angiography, cerebral SPECT imaging was carried out using the Prism 2000 XP employing high-resolution fan-beam collimators with a workstation (Picker, Odyssey VP). The projection data were obtained in a 64 × 64 format (magnification 1.33) for 36 angles in a 180° arc for each camera with 25 seconds per angle. The time required for SPECT data acquisition was 17.5 minutes.
One gram of Acz was intravenously administered 10 minutes before the completion of the first SPECT acquisition. Without any change in the subject's head position, intravenous injection of the rest (1.5 mL) of 99mTc-ECD was performed immediately after stopping of the first data acquisition. Nine minutes later, the second projection data acquisition, whose acquisition conditions were identical to those of the first, was started.
The first (baseline) and second projection data were reconstructed by filtered back-projection method using Ramp filter followed by postprocessing Butterworth filter (order 8, cutoff 0.28). Attenuation correction was performed using Chang's method (attenuation coefficient: μ = 0.09). To obtain Acz-activated (post-Acz) projection data, the first projection data were subtracted from the second SPECT data multiplied by 1.052, which was the correction coefficient for the decay of 99mTc between the first and the second SPECT study (Fig. 1B), and finally the baseline and post-Acz projection data were reformatted. When the rotating radius is 16.0 cm, the pixel size and the slice thickness was 4.5 mm2 and 4.5 mm, respectively.
For the calculation of Acz-activated mCBF (post-Acz mCBF) of the stenosis group, a transverse slice containing basal ganglia (slice thickness, 9.0 mm) was produced from the summation of axial SPECT images as the reference slice. Regions of interest were drawn manually over each less-affected cerebral hemisphere containing all structures composed of gray matter, white matter, and ventricle. Baseline and post-Acz mean SPECT counts of less-affected hemisphere were calculated using the above-mentioned ROI of respective reference slices. The Lassen's linearization correction algorithm (Lassen et al., 1988) was adapted to baseline mean SPECT count. Because of a curvilinear relationship between the brain activity and CBF, the Lassen's linearization correction algorithm was needed for the calculation of post-Acz mCBF. The linearization correction factor α was determined as follows: α = k3/k2, where k3 is the conversion rate constant from lipophilic to hydrophilic tracer in the brain and k2 is the back-diffusion rate constant from the brain to the blood stream. In a 99mTc-ECD study α value was proposed to be fixed to 2.59 by Friberg et al. (1994). Using this algorithm, post-Acz mCBF was estimated from the baseline mCBF, baseline mean SPECT count, and post-Acz mean SPECT count as follows:
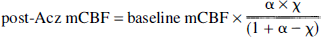
where χ = post-Acz mean SPECT count/baseline mean SPECT count. The post-Acz mCBF of the patent group was calculated by the same procedure as in the unilateral stenosis group but using manually drawn ROI containing whole hemispheres.
Method of creating quantitative rCBF images
In rCBF quantification, as described in the previous study (Matsuda et al., 1995), baseline and post-Acz 99mTc-ECD transaxial SPECT images were converted to baseline and post-Acz quantitative rCBF images using baseline mCBF and post-Acz mCBF, respectively, by the application of Lassen's linearization correction algorithm (α = 2.59).
In principle, respective rCBF values can be calculated from any size ROI positioned at will in a baseline or post-Acz quantitative slice. However, rCBF analyses were performed mostly using above-mentioned hemispheric ROI in this preliminary study, and smaller ROI were used in the limited cases (refer to respective figure legends of case 1 and case 2 in the case presentations) for the more precise analysis of localized regions. For the analysis of cerebral perfusion increment ratio (IR) was calculated from post-Acz CBF/baseline CBF. Mean IR (mIR) and regional IR (rIR) signified post-Acz mCBF/baseline mCBF and post-Acz rCBF/baseline rCBF, respectively.
Placebo study
To determine the reproducibility of this consecutive 99mTc-ECD SPECT studies, patients exclusively referred for resting SPECT study were examined with the same procedure used in the Acz activation study protocol without Acz but with physiologic saline administration. Twenty subjects with various cerebral perfusion conditions (placebo group: 9, transient ischemic attack; 2, chronic infarction; 2, Alzheimer's disease; 2, psychiatric disease; 2, meningioma; 1, subarachnoid hemorrhage; 1, Parkinson's disease; and 1, epilepsy; 12 women and 8 men with an average age of 61.4 ± 13.9 years) were examined (Table 1) after obtaining their informed consents. Baseline mCBF, placebo-loaded (post-placebo) mCBF, baseline quantitative image, and post-placebo quantitative image were obtained by the same procedures as for the Patent Group. Using baseline and post-placebo quantitative rCBF-mapping SPECT images, rCBF values of the reference slice (the level of basal ganglia) of each side were calculated, and similar analyses using IR were performed (Table 1).
Summary of placebo group
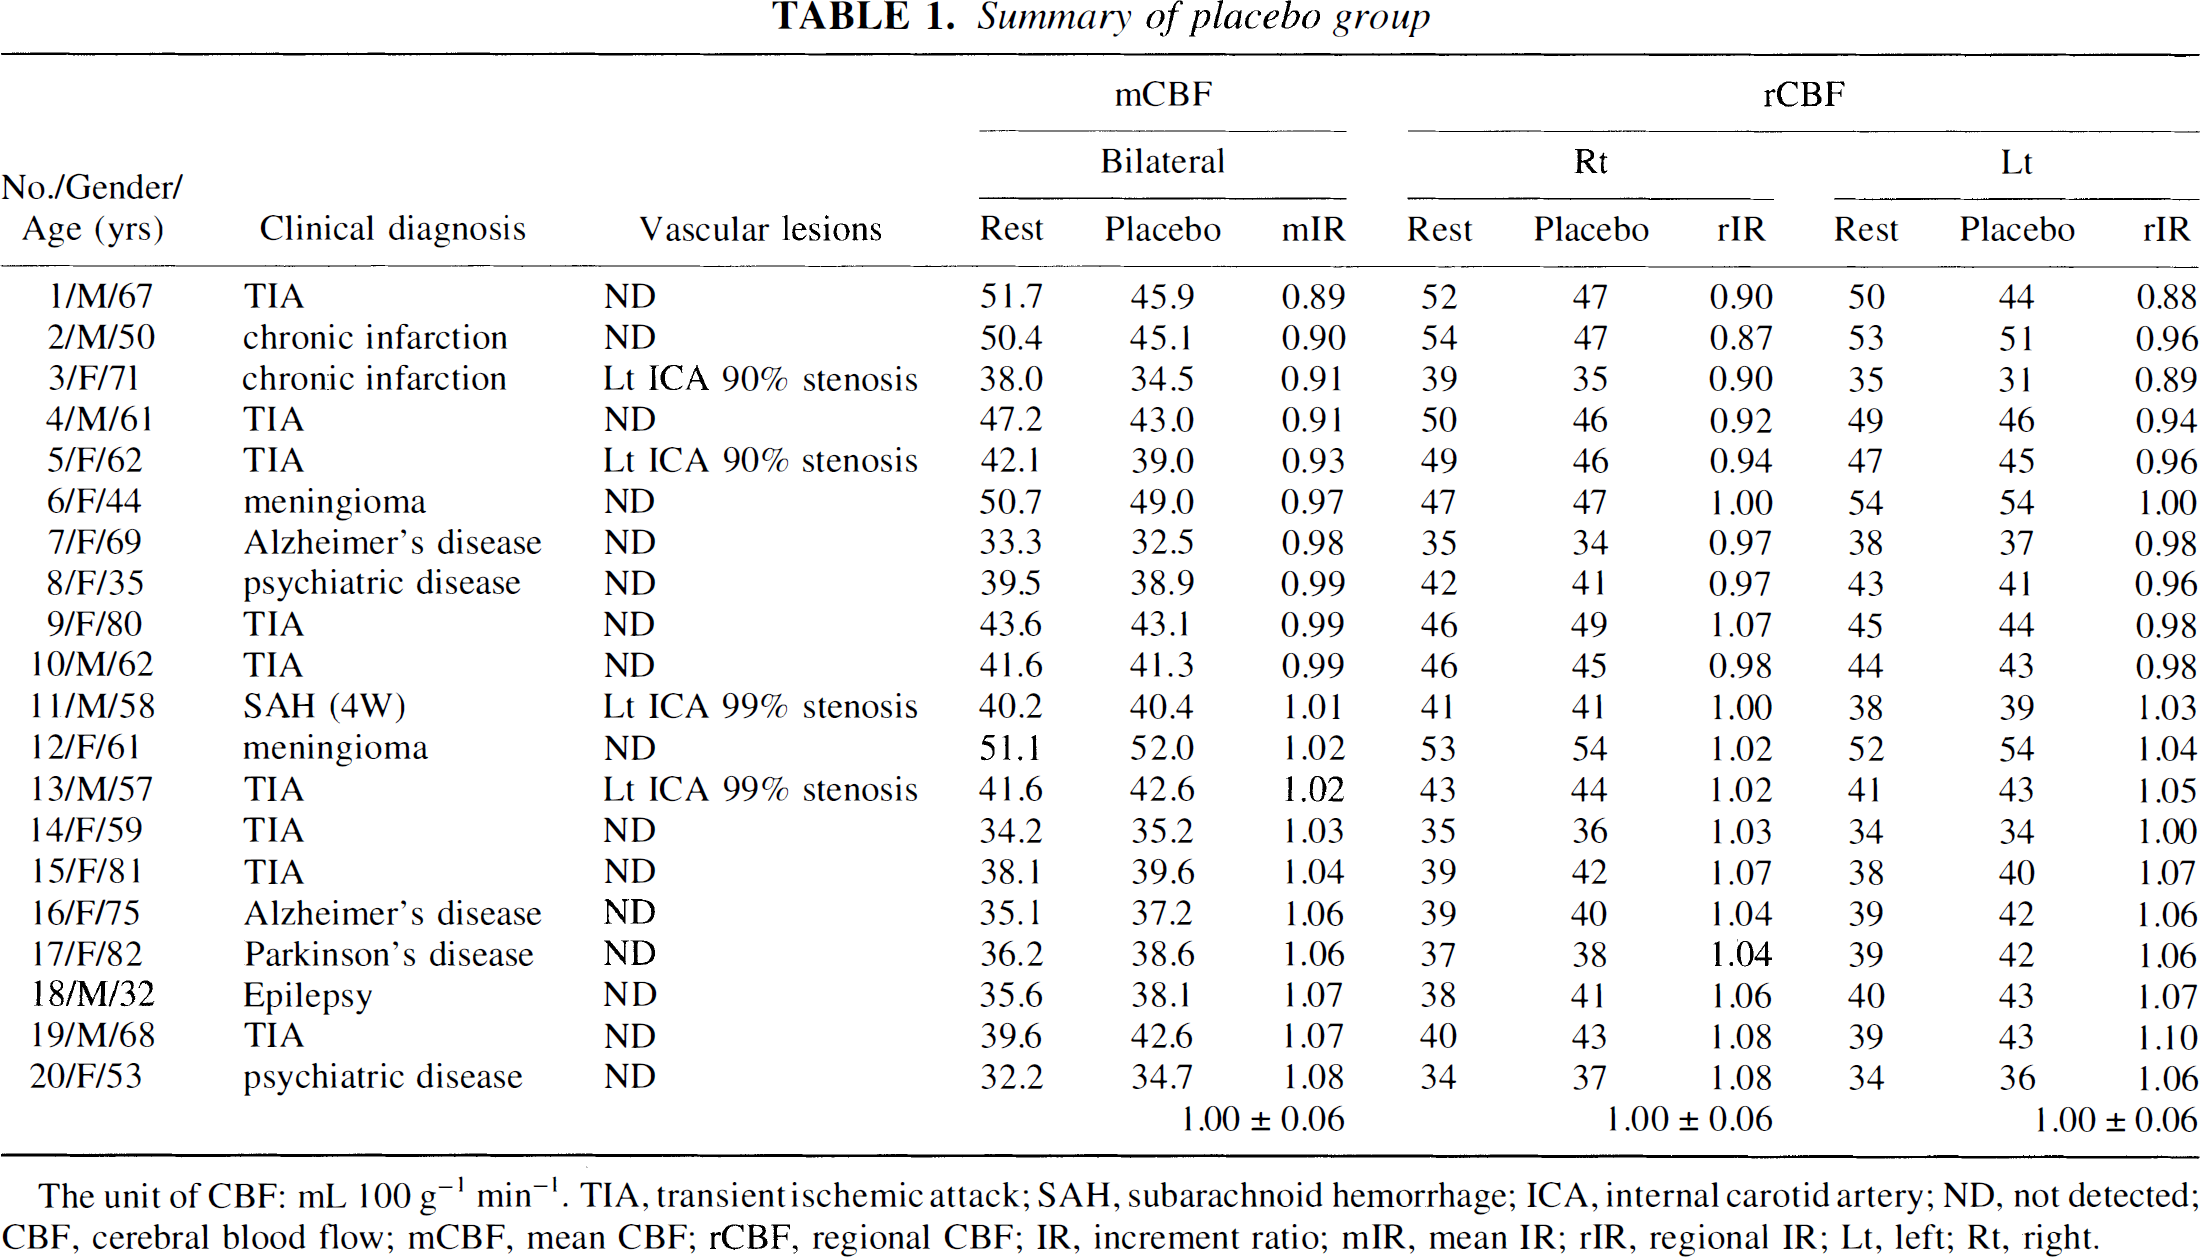
The unit of CBF: mL 100 g−1 min−1. TIA, transient ischemic attack; SAH, subarachnoid hemorrhage; ICA, internal carotid artery; ND, not detected; CBF, cerebral blood flow; mCBF, mean CBF; rCBF, regional CBF; IR, increment ratio; mIR, mean IR; rIR, regional IR; Lt, left; Rt, right.
Follow-up study
To evaluate the effects of revascularization surgery, eight patients (no. 1, 3, and 7 of the bilateral stenosis group and no. 9, 19, 28, 30, and 38 of the unilateral stenosis group) were followed up using this protocol (no. 8 was withdrawn from the follow-up study because of change of residence). Clinical diagnosis, symptoms, and MRA findings are summarized with IR values in Table 2.
Follow-up study of stenosis group
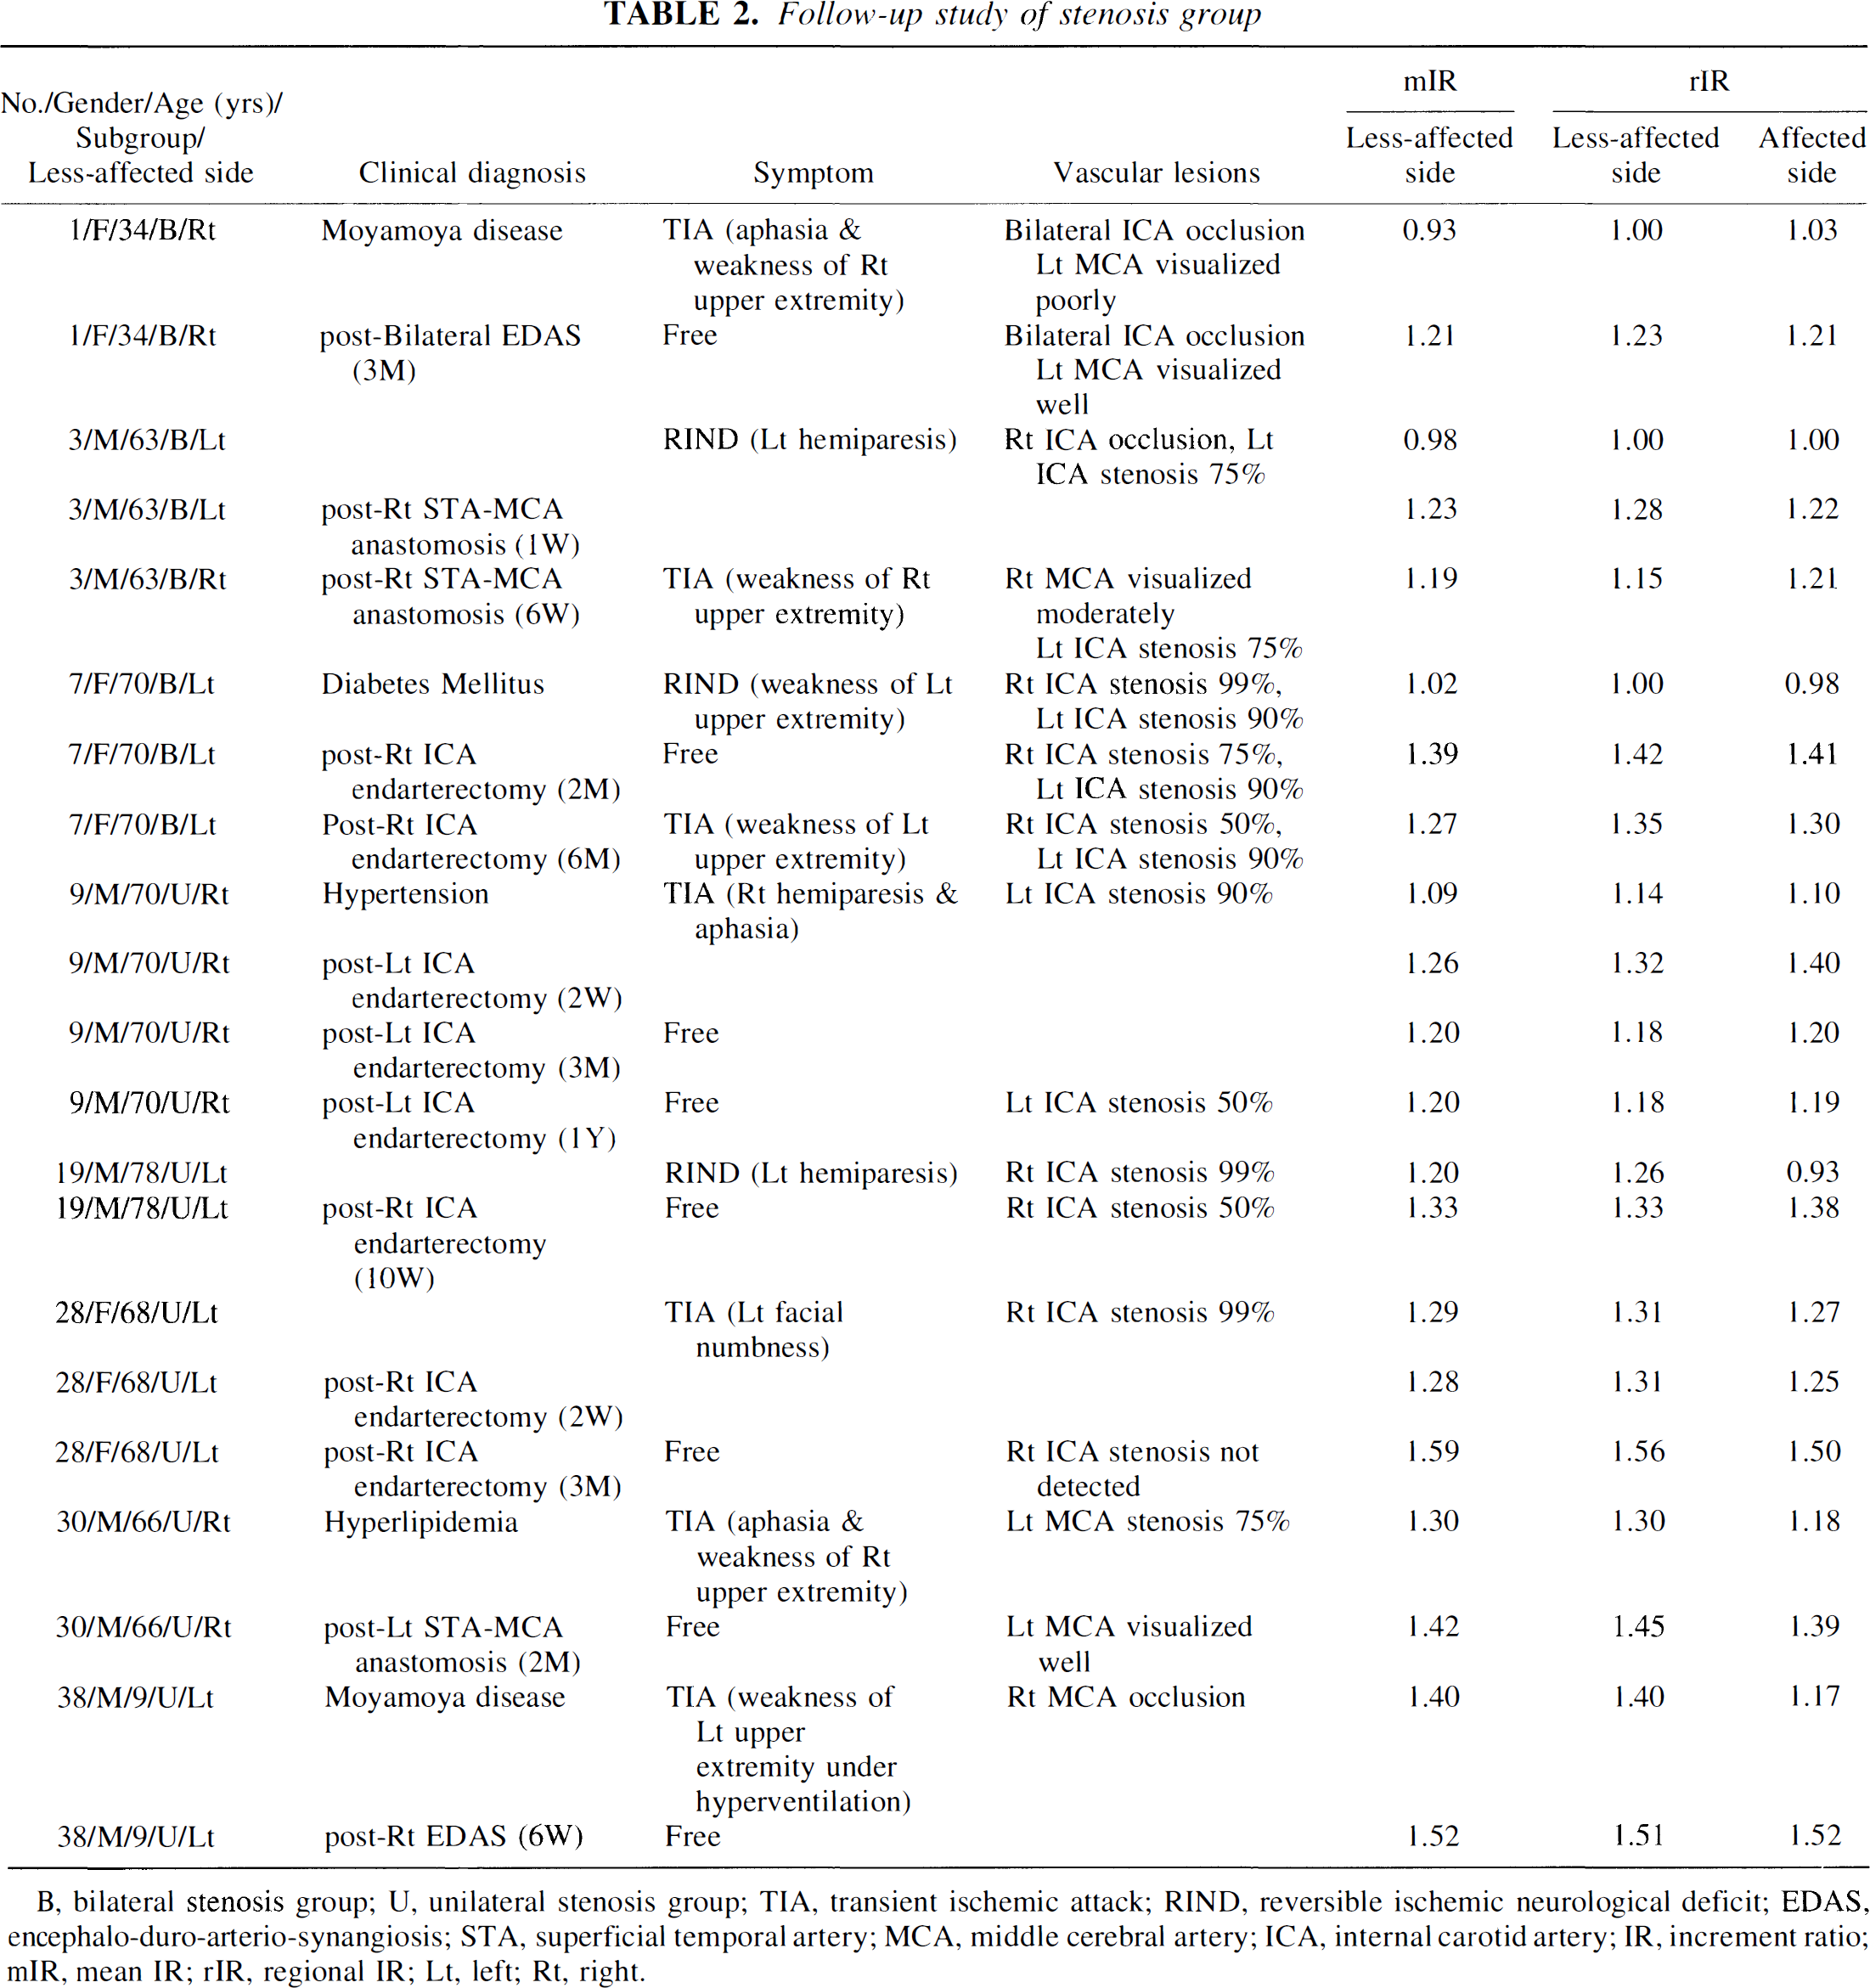
B, bilateral stenosis group; U, unilateral stenosis group; TIA, transient ischemic attack; RIND, reversible ischemic neurological deficit; EDAS, encephalo-duro-arterio-synangiosis; STA, superficial temporal artery; MCA, middle cerebral artery; ICA, internal carotid artery; IR, increment ratio; mIR, mean IR; rIR, regional IR; Lt, left; Rt, right.
RESULTS
In the placebo group (Table 1), mIR of bilateral hemispheres and rIR of the quantitative reference slice (the level of basal ganglia) of each hemisphere were 1.00 ± 0.06 (mean ± SD) combined. The rCBF values of both hemispheres showed a good agreement with mCBF (P < 0.001, Fisher's paired z-test) as shown in Fig. 2.
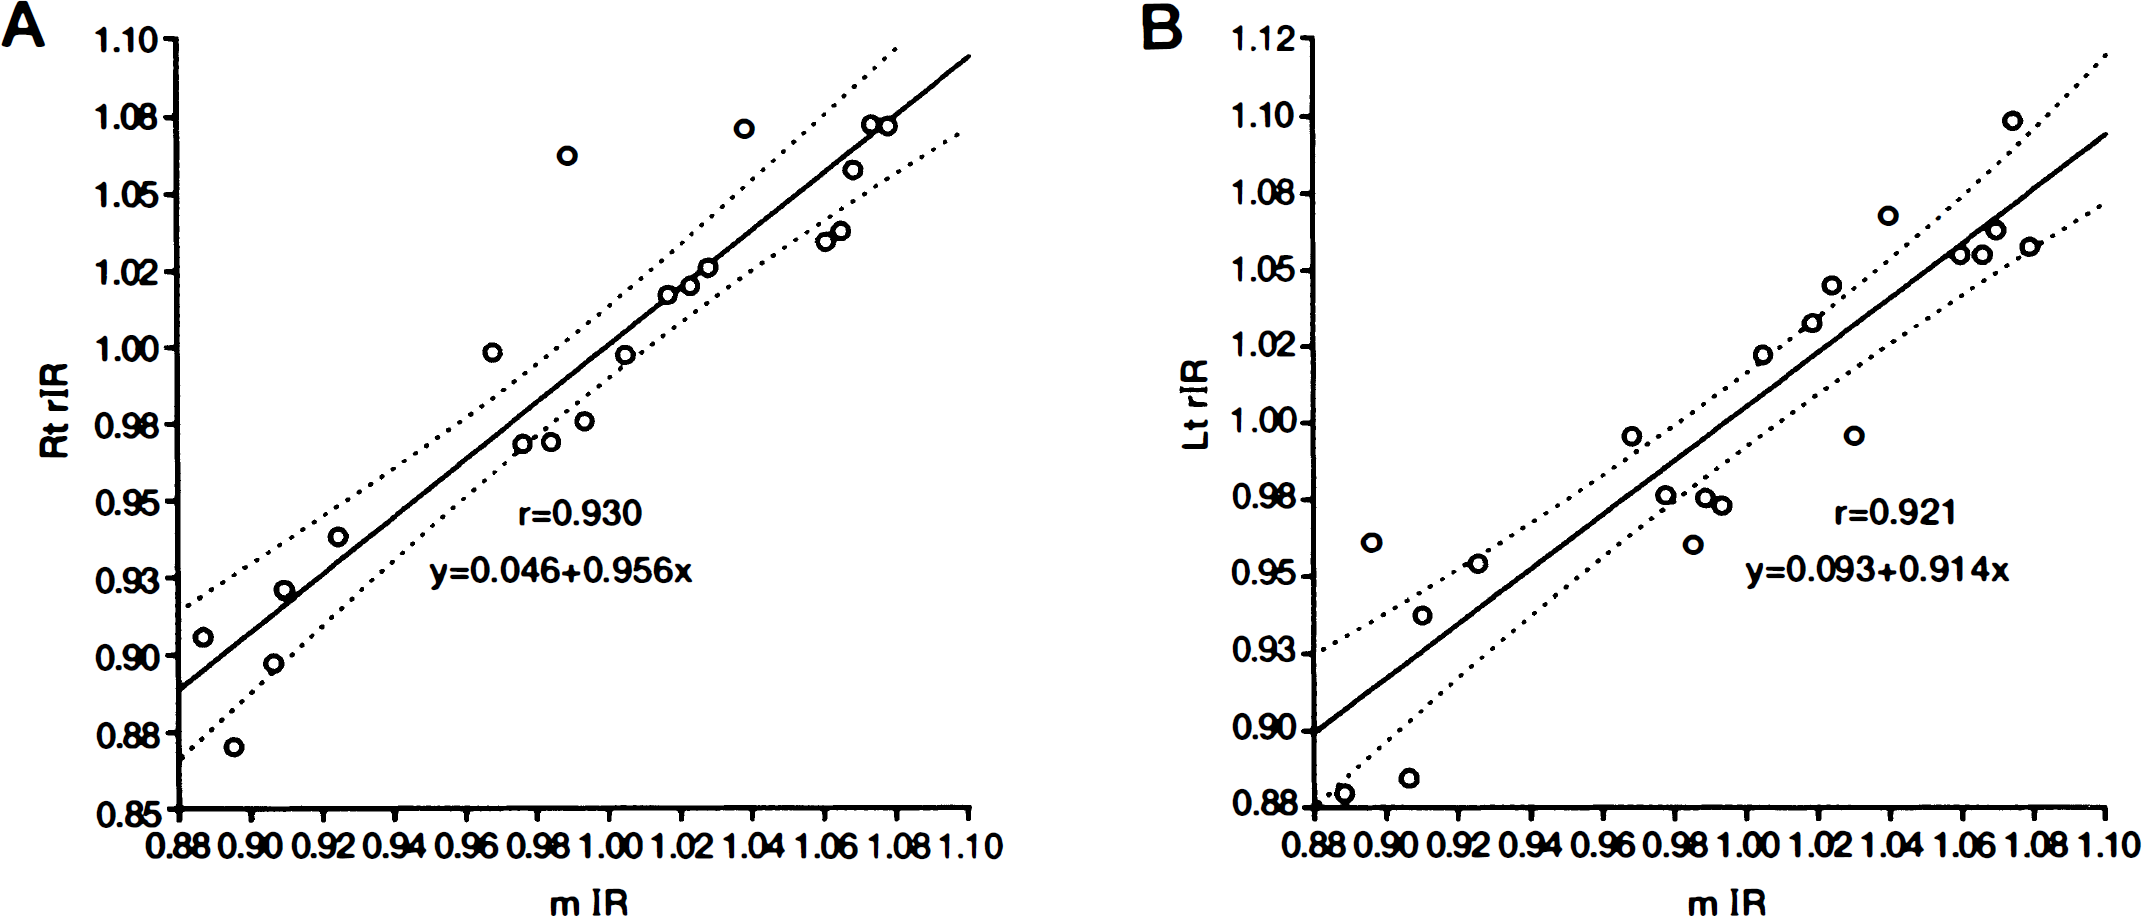
Results of paired z-test analysis between the mean increment ratio (mIR) values and the regional IR (rIR) values calculated from each hemispheric referential SPECT slice.
As shown in Table 3, the unilateral stenosis group showed less increase of rCBF values in the affected hemisphere compared with those in the unaffected hemisphere (P < 0.001). The rIR was 1.33 ± 0.13 and 1.26 ± 0.18 for unaffected side and affected side, respectively.
Summary of unilateral stenosis group
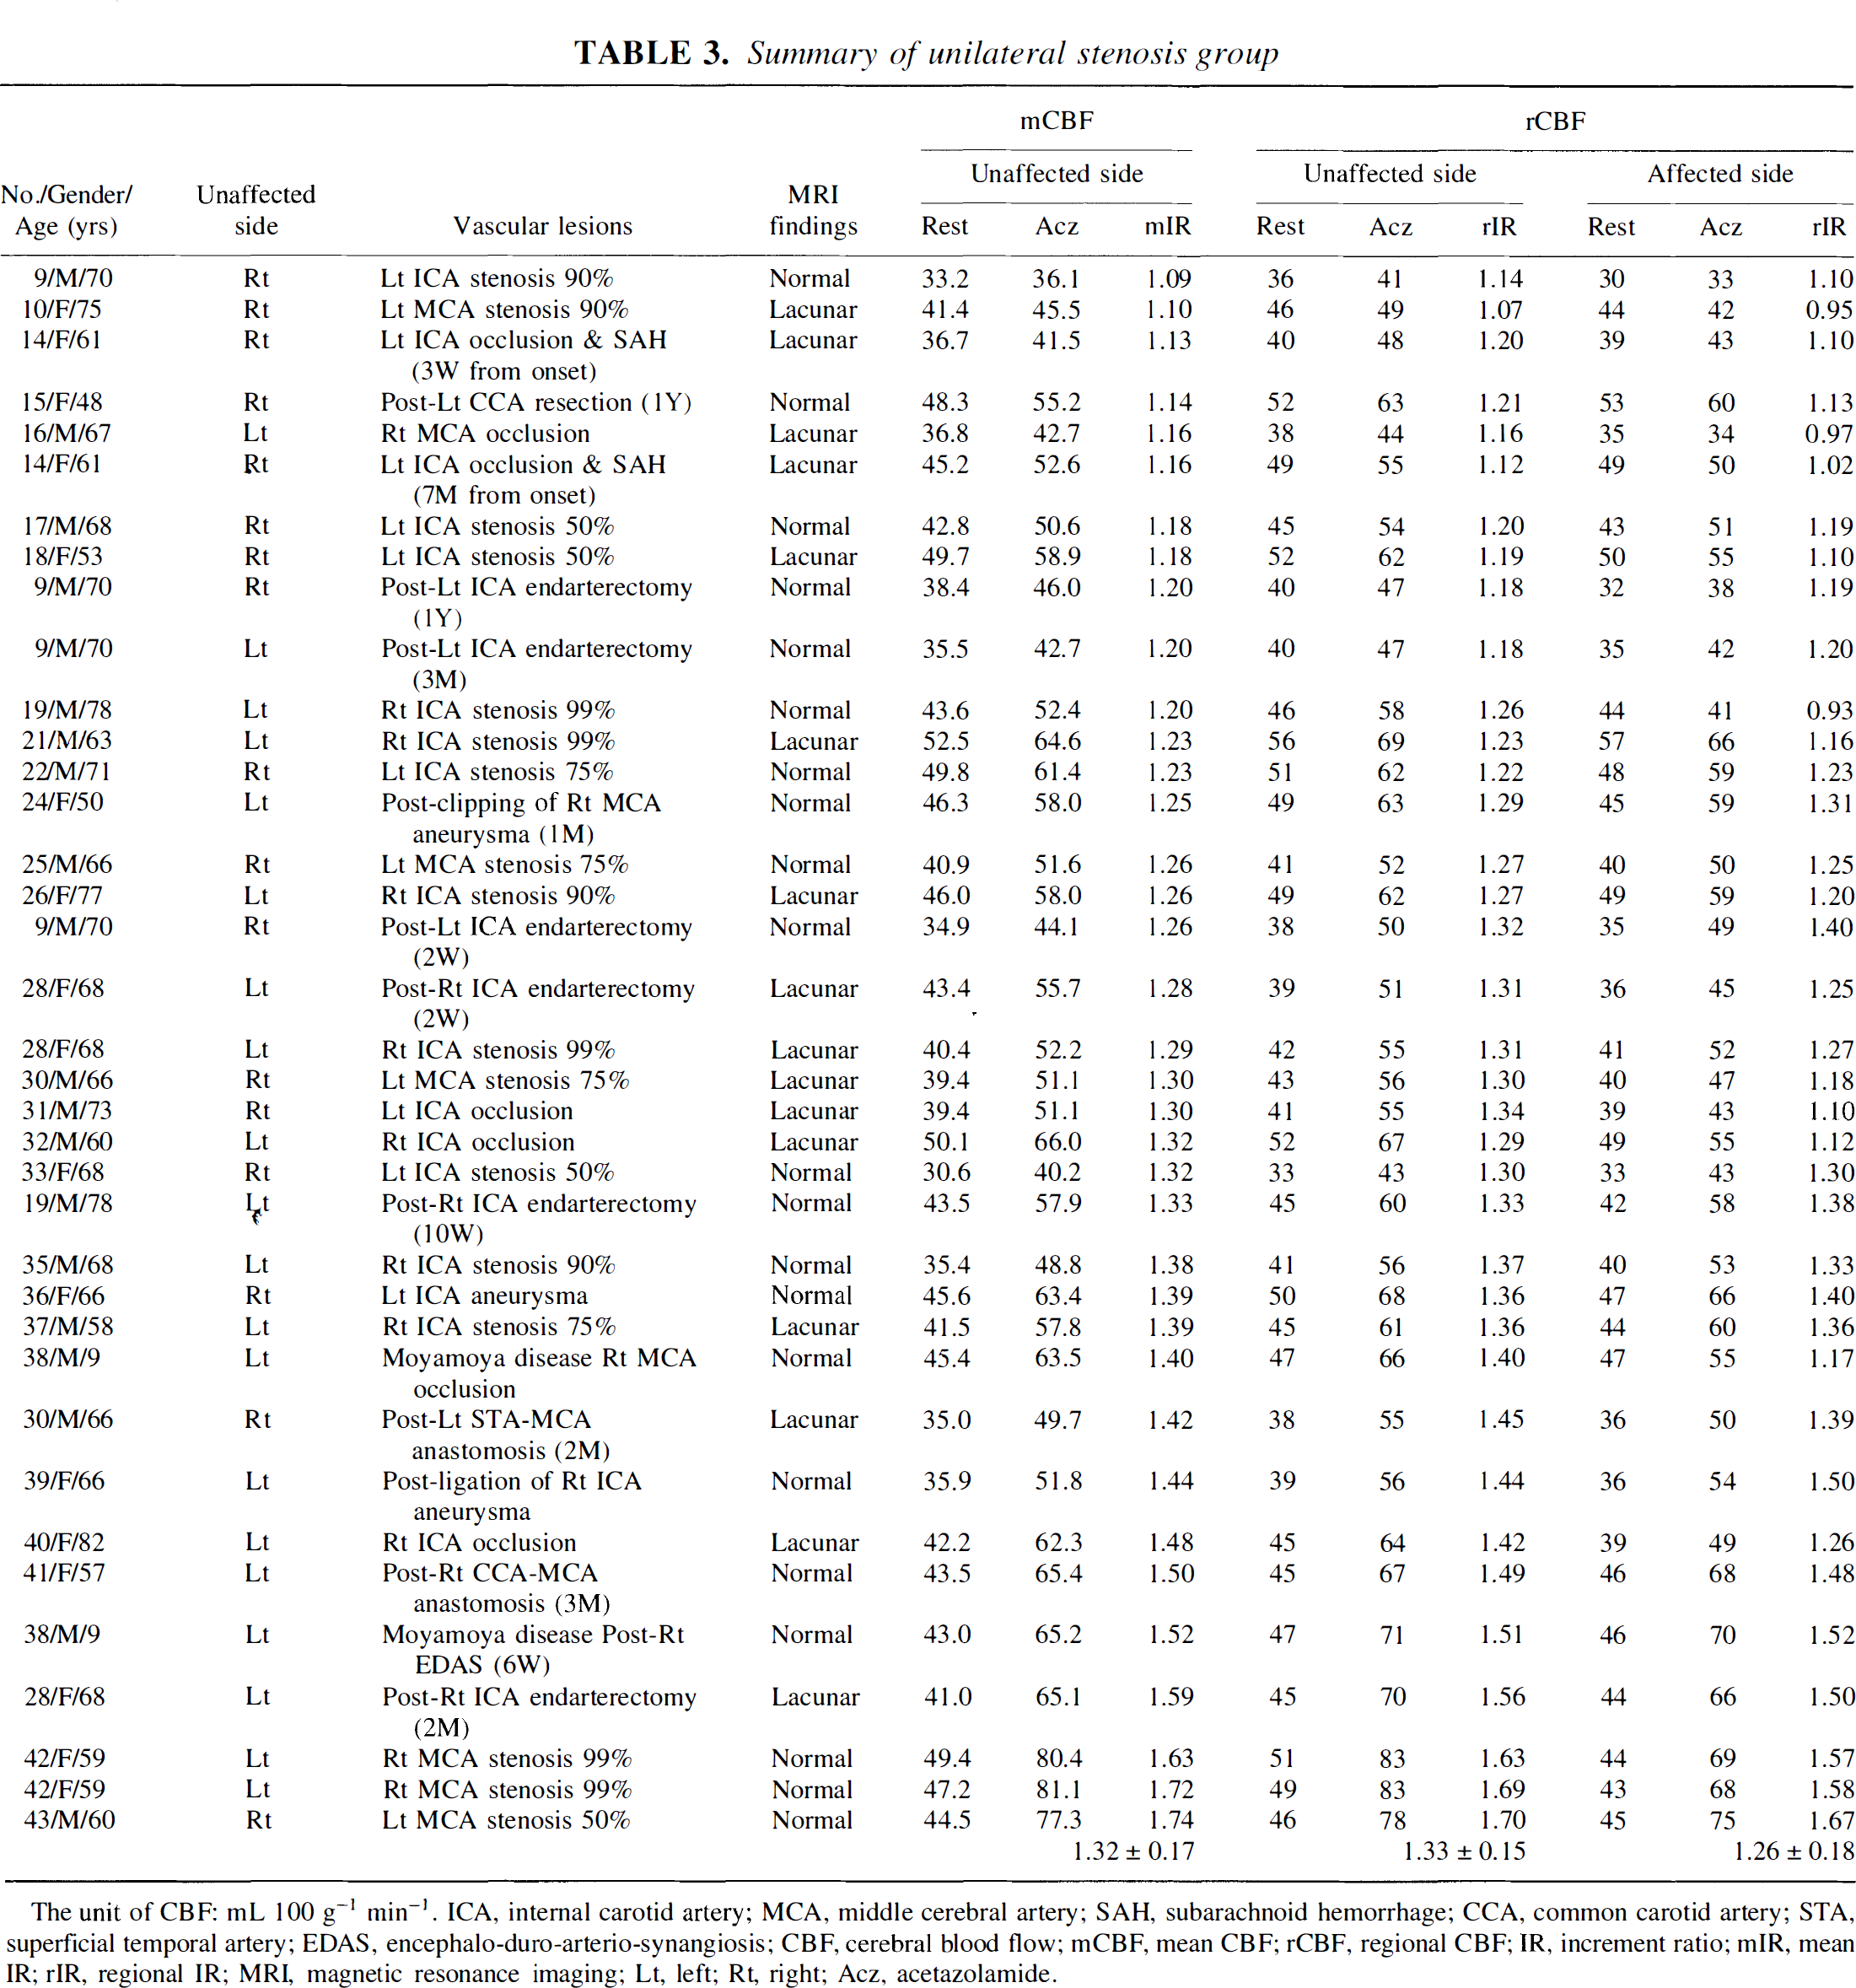
The unit of CBF: mL 100 g−1 min−1. ICA, internal carotid artery; MCA, middle cerebral artery; SAH, subarachnoid hemorrhage; CCA, common carotid artery; STA, superficial temporal artery; EDAS, encephalo-duro-arterio-synangiosis; CBF, cerebral blood flow; mCBF, mean CBF; rCBF, regional CBF; IR, increment ratio; mIR, mean IR; rIR, regional IR; MRI, magnetic resonance imaging; Lt, left; Rt, right; Acz, acetazolamide.
On the other hand, rIR was lower in both affected and less-affected hemisphere in the bilateral stenosis group as shown in Table 4 (1.16 ± 0.13 in less-affected side and 1.13 ± 0.12 in affected side). A significant difference was not recognized between rIR of the less-affected side and rIR of the affected side of the bilateral stenosis group (P = 0.06) by paired Student's t-test. Meanwhile, a significant difference (P < 0.001) was recognized between mIR of the bilateral stenosis group and mIR of the unilateral stenosis group, between rIR of the less-affected side of the bilateral stenosis group and mIR of the unilateral stenosis group, and between rIR of the affected side of the bilateral stenosis group and mIR of the unilateral stenosis group by unpaired Student's t-est. Using mIR of the patent group instead of mIR of the unilateral stenosis group, a more significant difference (P < 0.001) was also recognized. The results of these statistical analyses are summarized in Fig. 3.
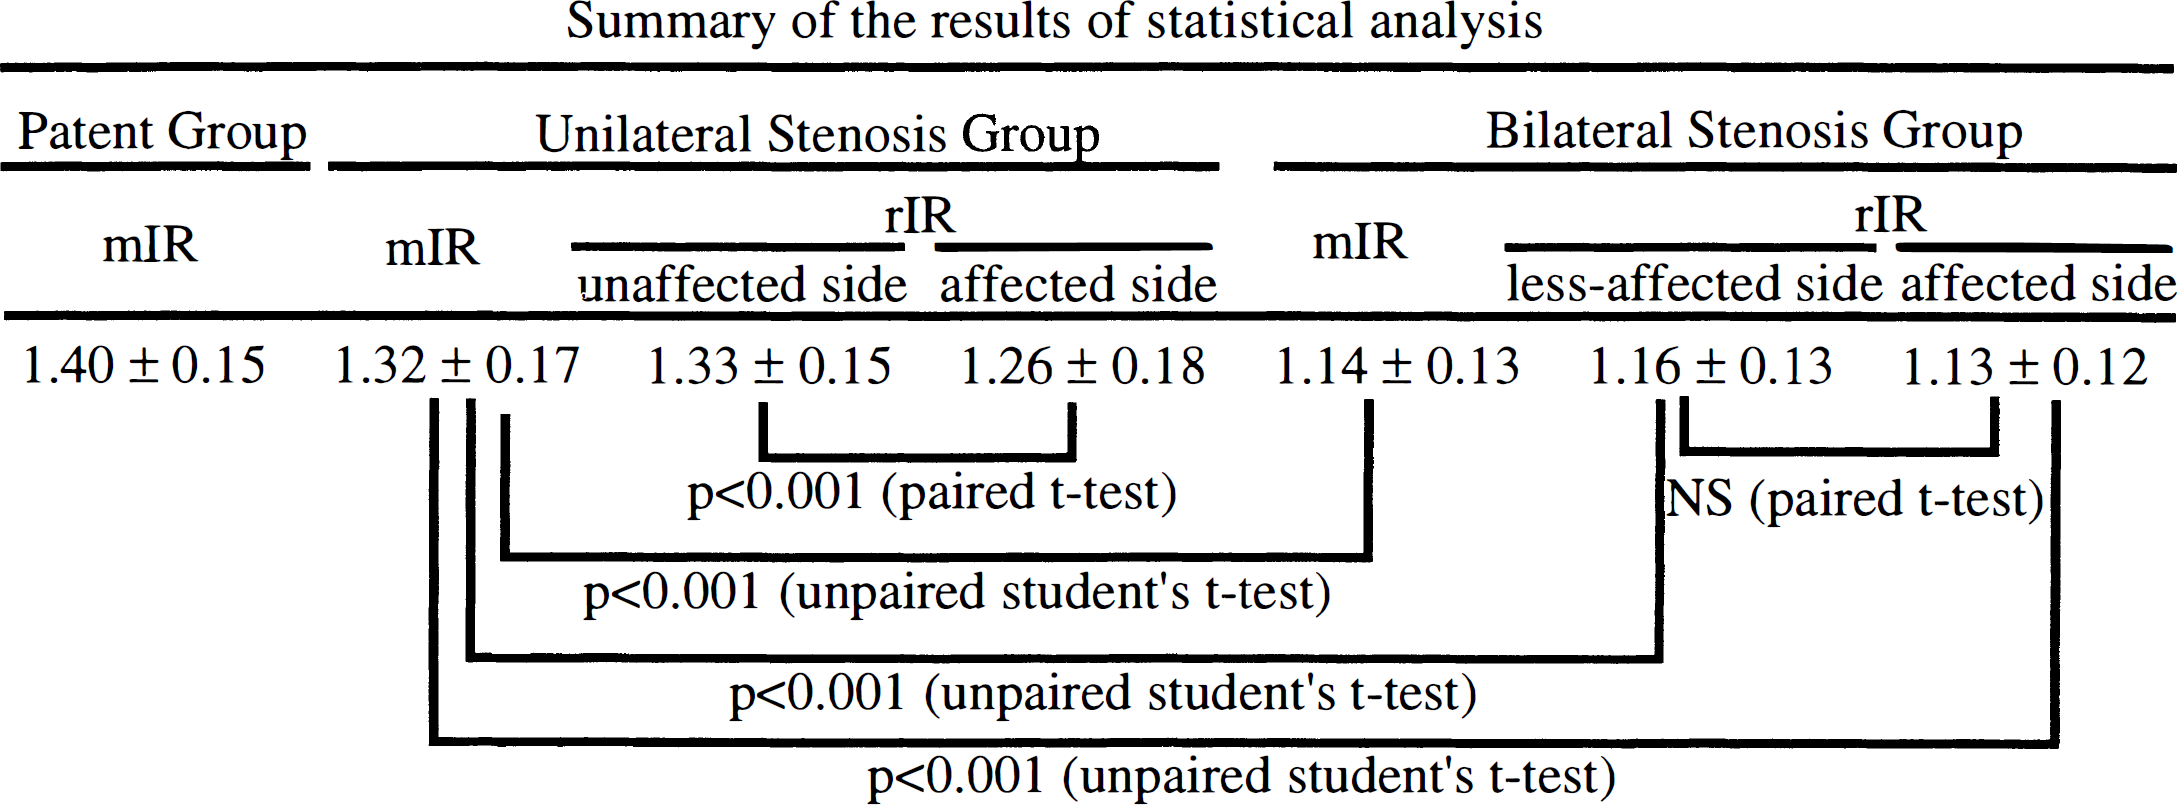
Using mIR of patient group instead of mIR of unilateral stenosis group, the more significant difference could be recognized by unpaired Student's t-test. IR, increment ratio; mIR, mean IR; NS, not significant; rIR, regional IR.
Summary of bilateral stenosis group
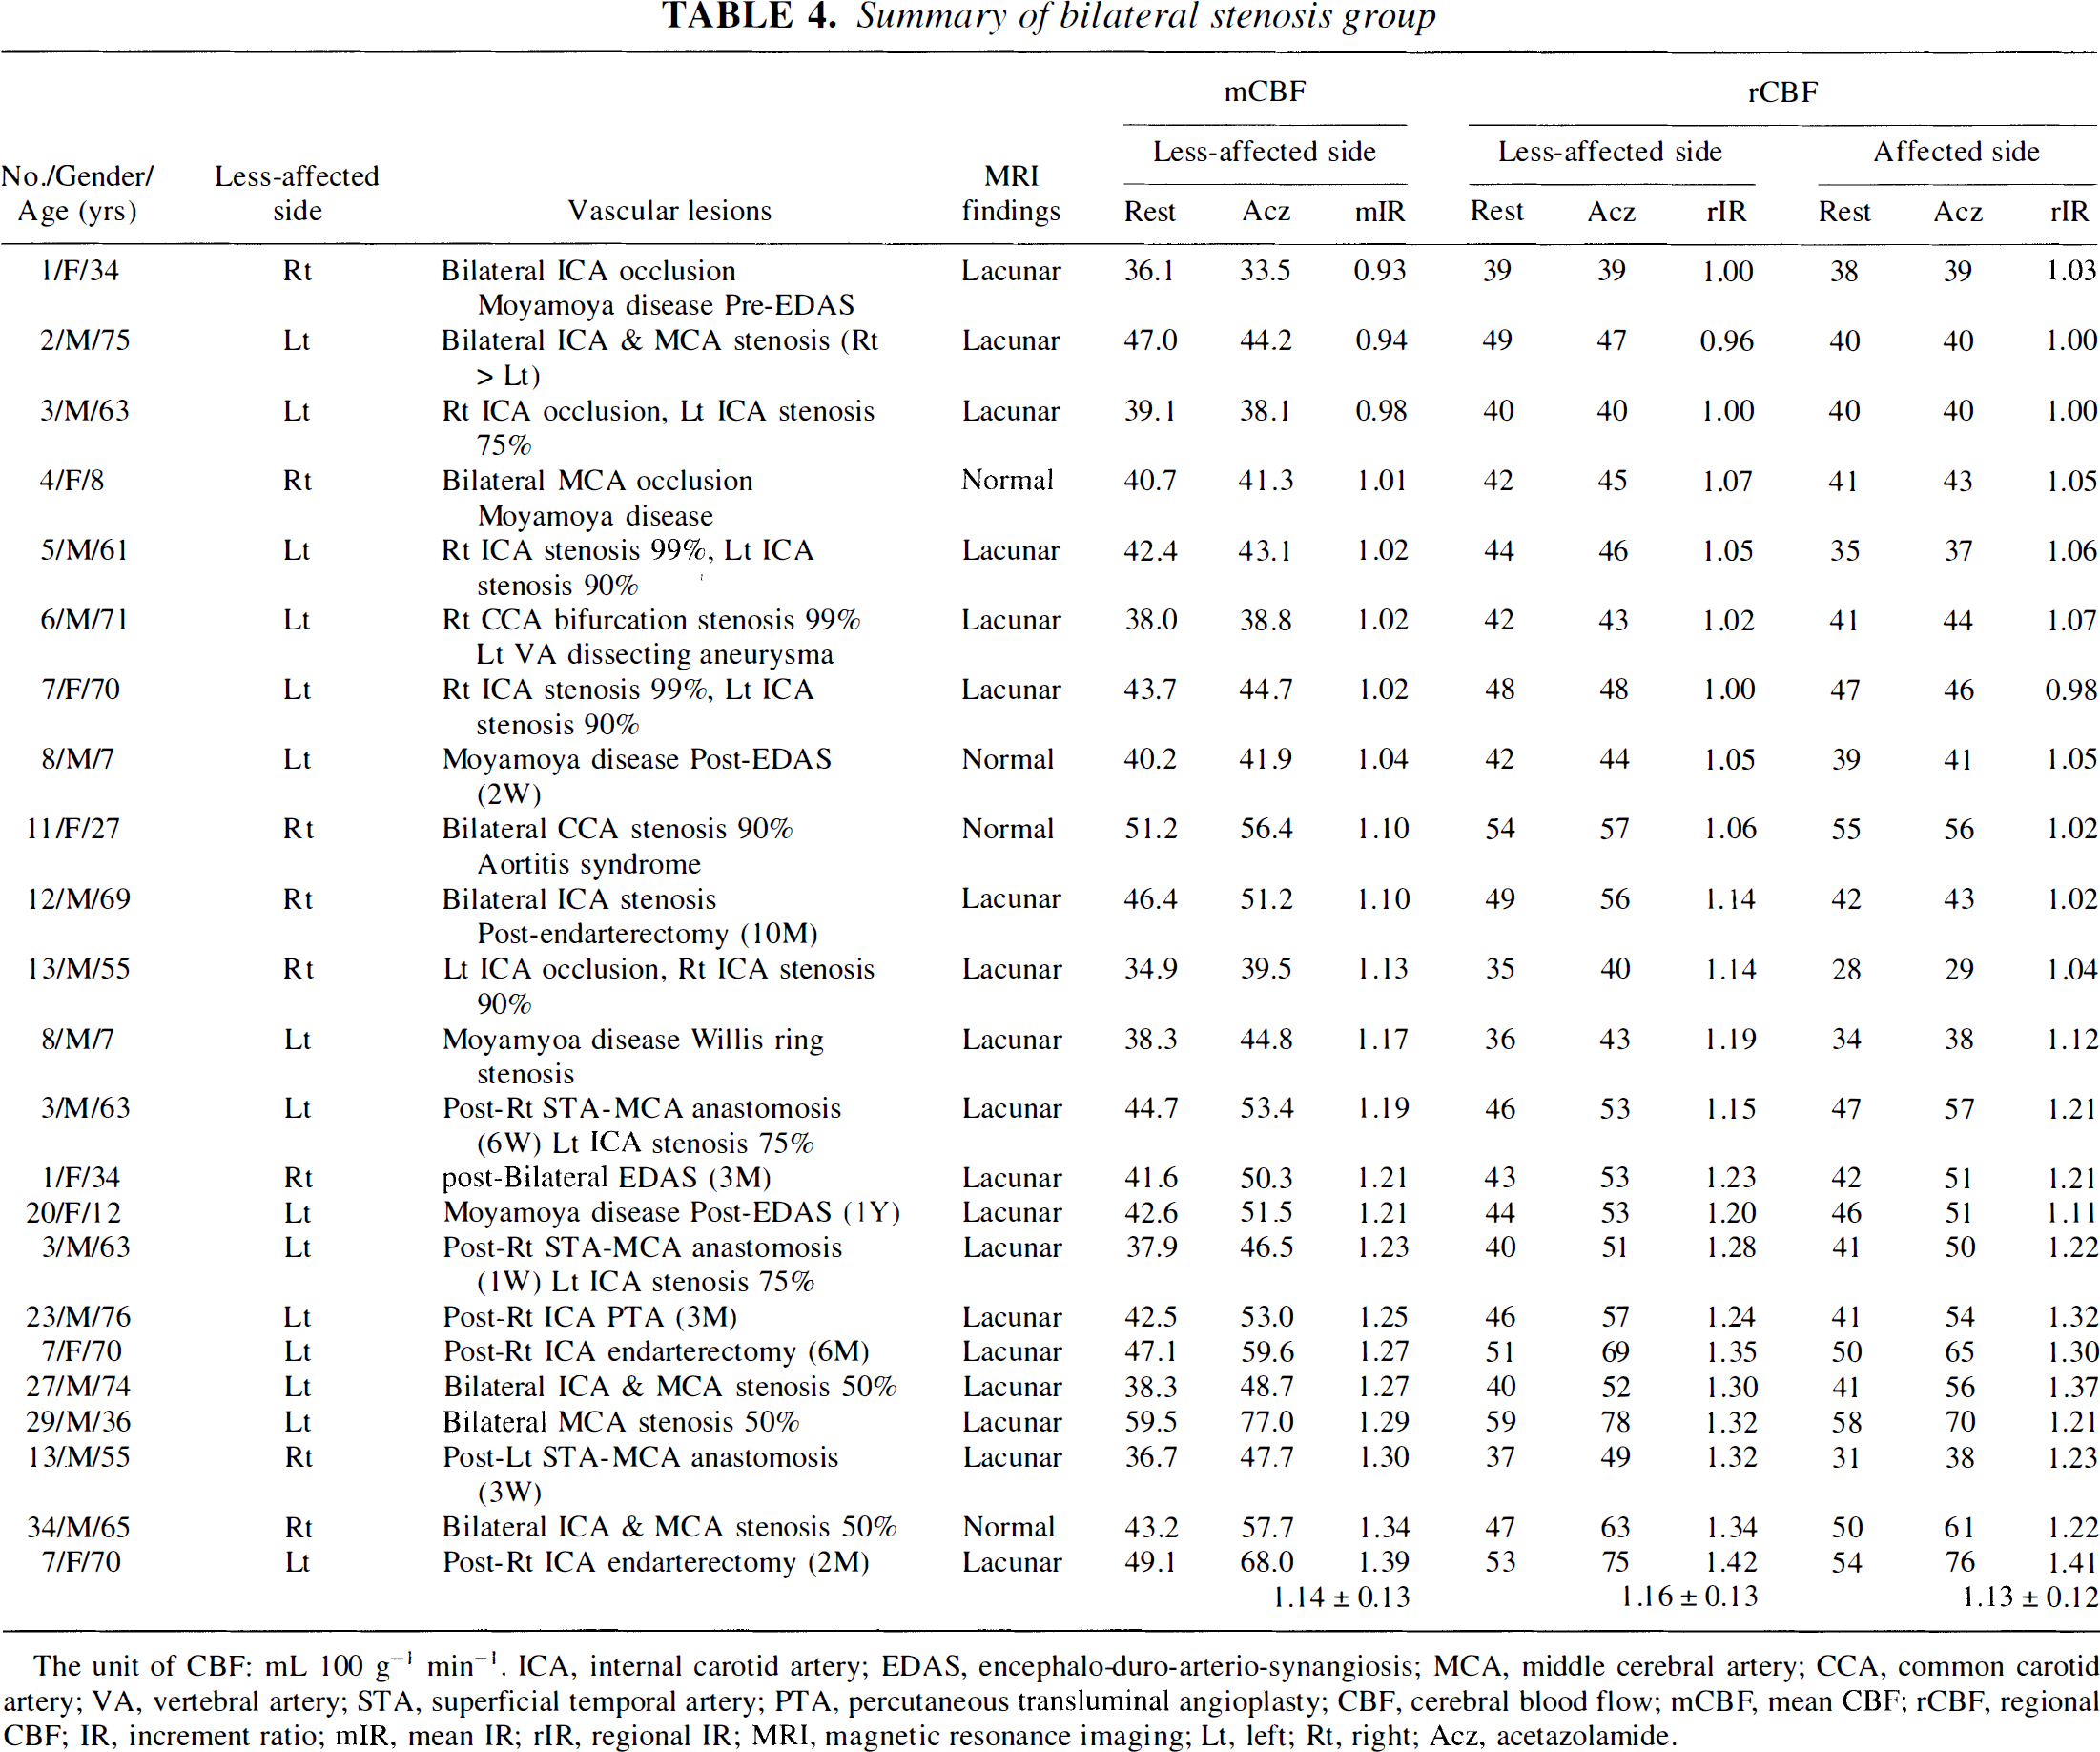
The unit of CBF: mL 100 g−1 min−1. ICA, internal carotid artery; EDAS, encephalo-duro-arterio-synangiosis; MCA, middle cerebral artery; CCA, common carotid artery; VA, vertebral artery; STA, superficial temporal artery; PTA, percutaneous transluminal angioplasty; CBF, cerebral blood flow; mCBF, mean CBF; rCBF, regional CBF; IR, increment ratio; mIR, mean IR; rIR, regional IR; MRI, magnetic resonance imaging; Lt, left; Rt, right; Acz, acetazolamide.
The values of mIR and rIR of right and left hemispheres of the patent group (Table 5) were 1.40 ± 0.15, 1.40 ± 0.15, and 1.39 ± 0.15, respectively. These values were higher than those of the unilateral stenosis group and the bilateral stenosis group.
Summary of patent group
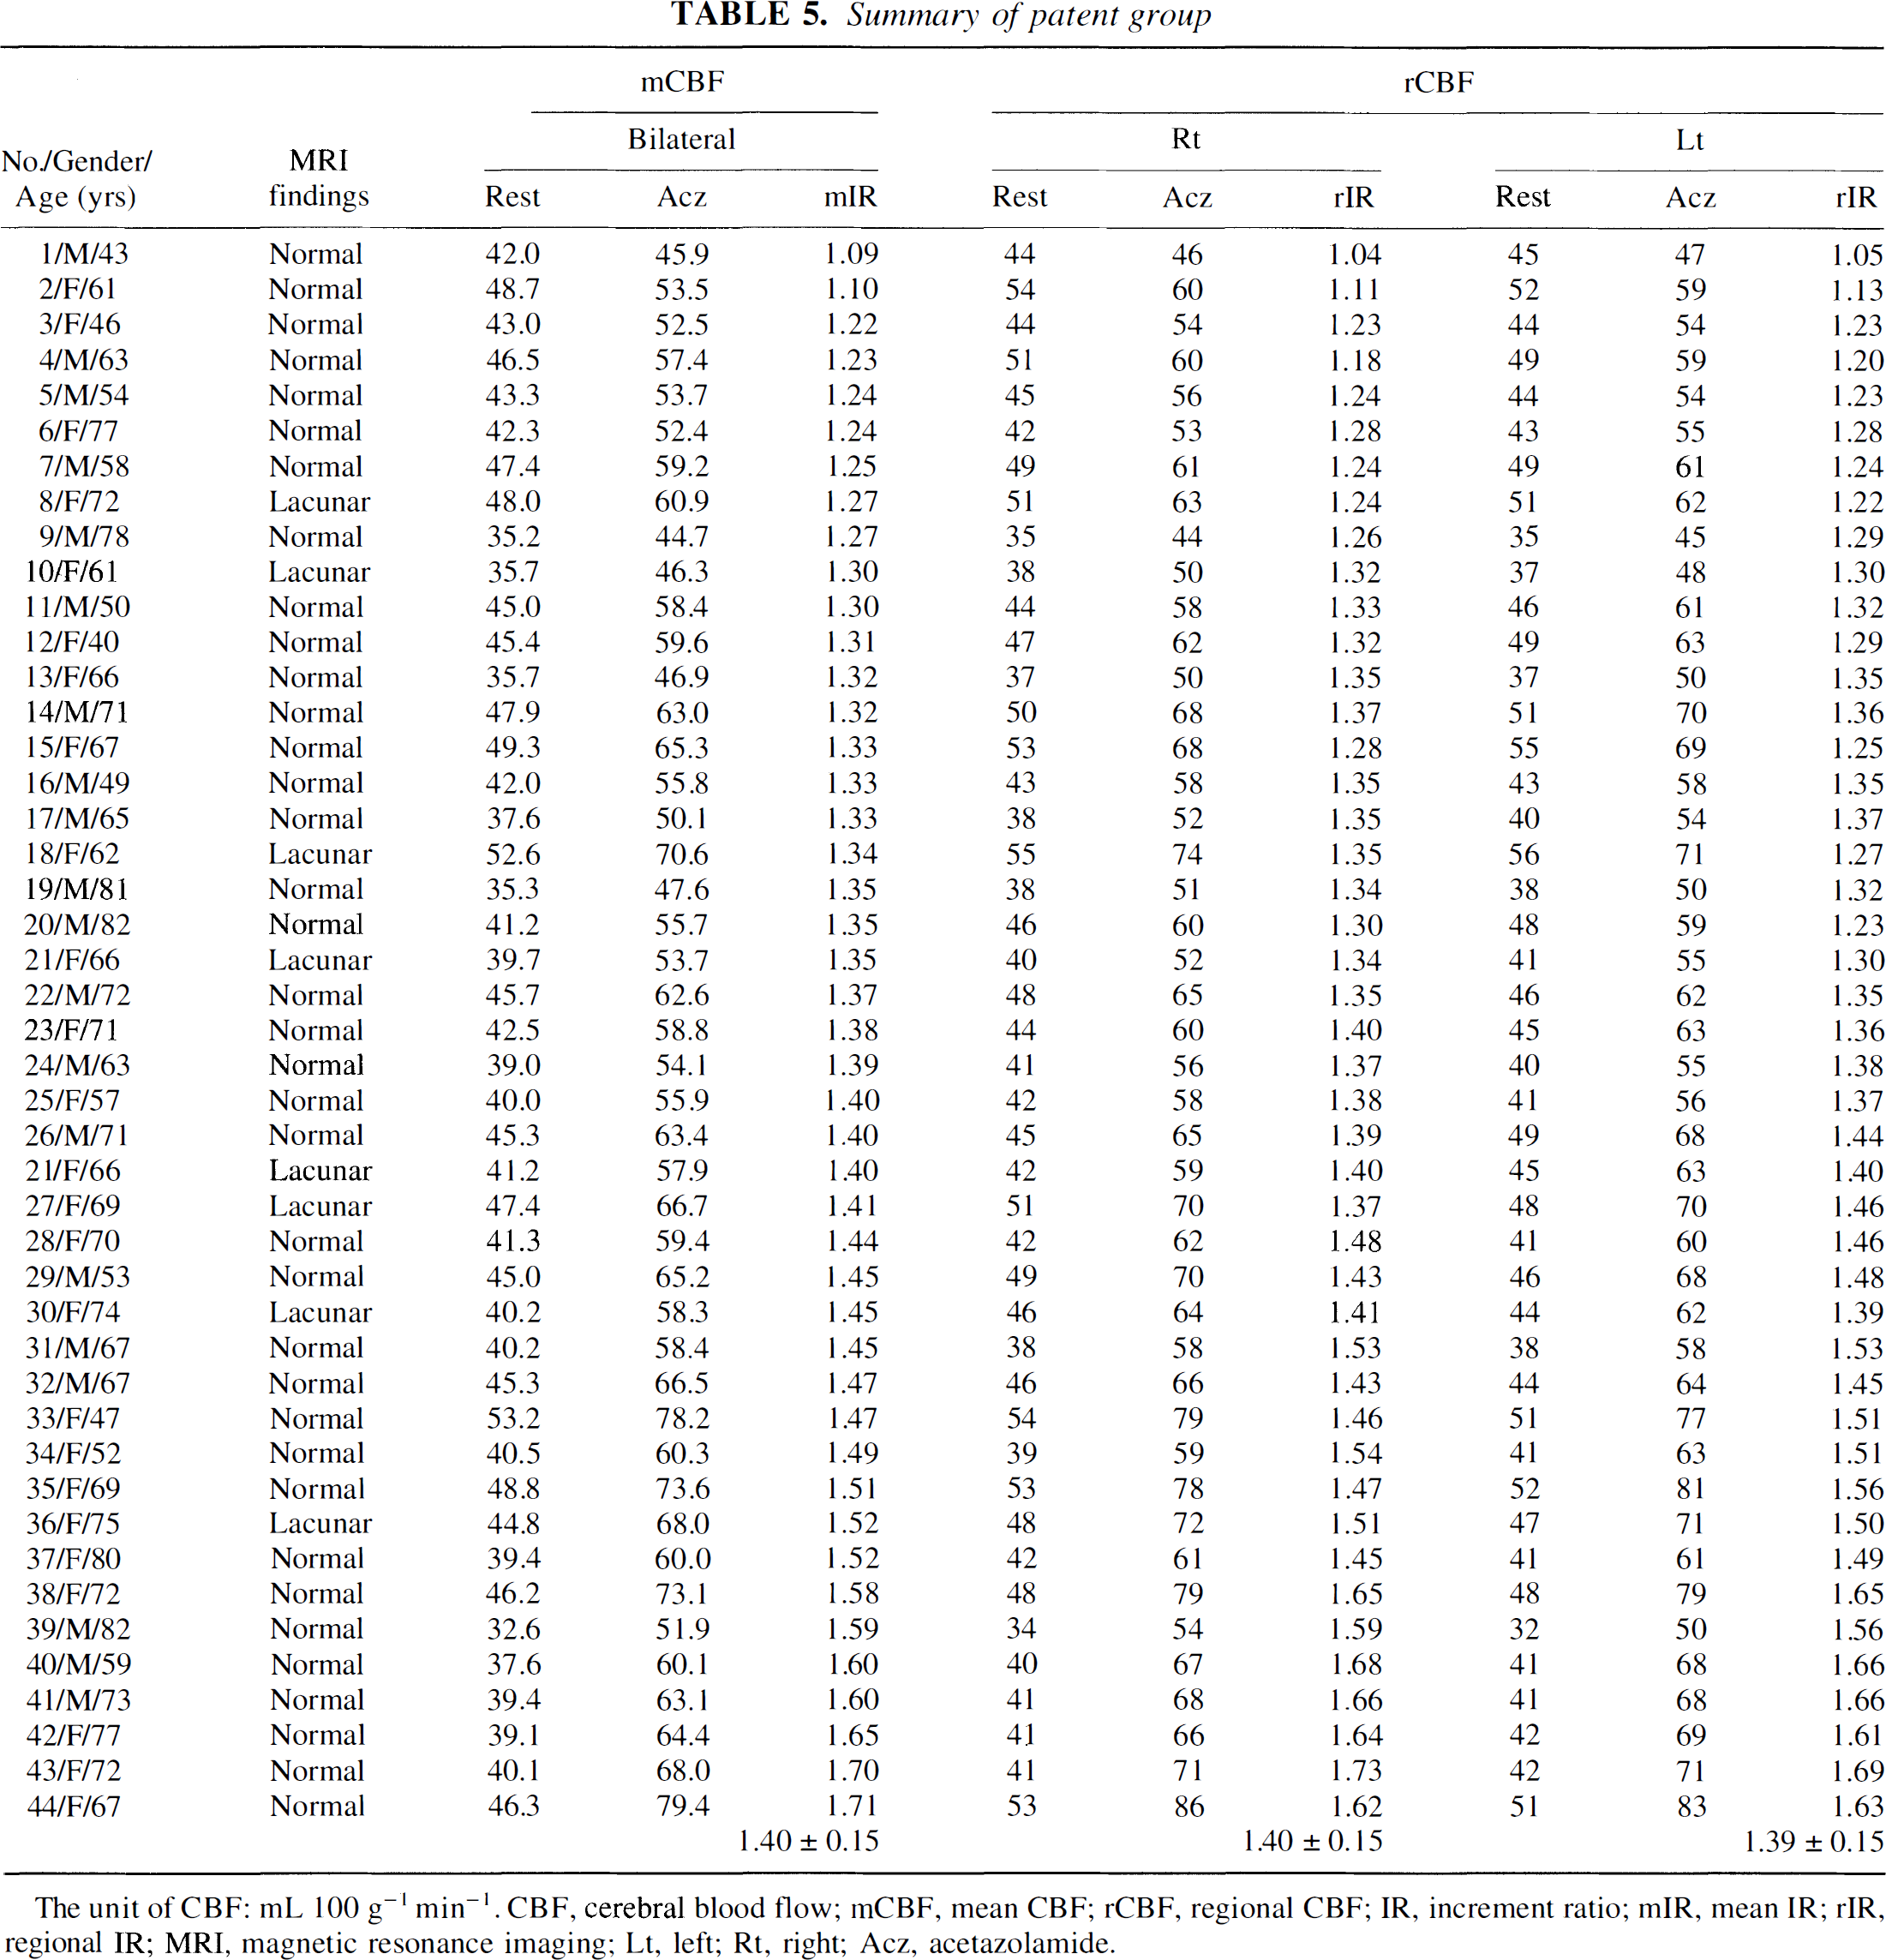
The unit of CBF: mL 100 g−1 min−1. CBF, cerebral blood flow; mCBF, mean CBF; rCBF, regional CBF; IR, increment ratio; mIR, mean IR; rIR, regional IR; MRI, magnetic resonance imaging; Lt, left; Rt, right; Acz, acetazolamide.
Table 2 summarizes the follow-up study in eight cases. The IR values increased to exceed 1.20 when their clinical symptoms improved postoperatively.
CASE PRESENTATION
Case 1: Patient 38 in Table 3
A 9-year-old boy was admitted with weakness of the left upper extremity caused by hyperventilation from August 1996. Magnetic resonance imaging on November 28th, 1996, showed no abnormality, but MRA showed stenosis of the circle of Willis and proliferation of collateral vessels (Fig. 4). He underwent SPECT study the next day (Fig. 5). Although resting images showed normal perfusion, significant increase of rCBF was not manifested in the right (Rt) middle cerebral artery territory during Acz administration. The localized impairment of cerebral vascular reserve was clarified, and encephalo-duro-arterio-synangiosis of the Rt side was performed December 10. The follow-up SPECT study on January 23, 1997, 6 weeks after the operation (Fig. 6), showed restoration of vascular reserve in Rt middle cerebral artery territory and developed vascular reserve in other regions. Up to now his symptoms have completely disappeared.
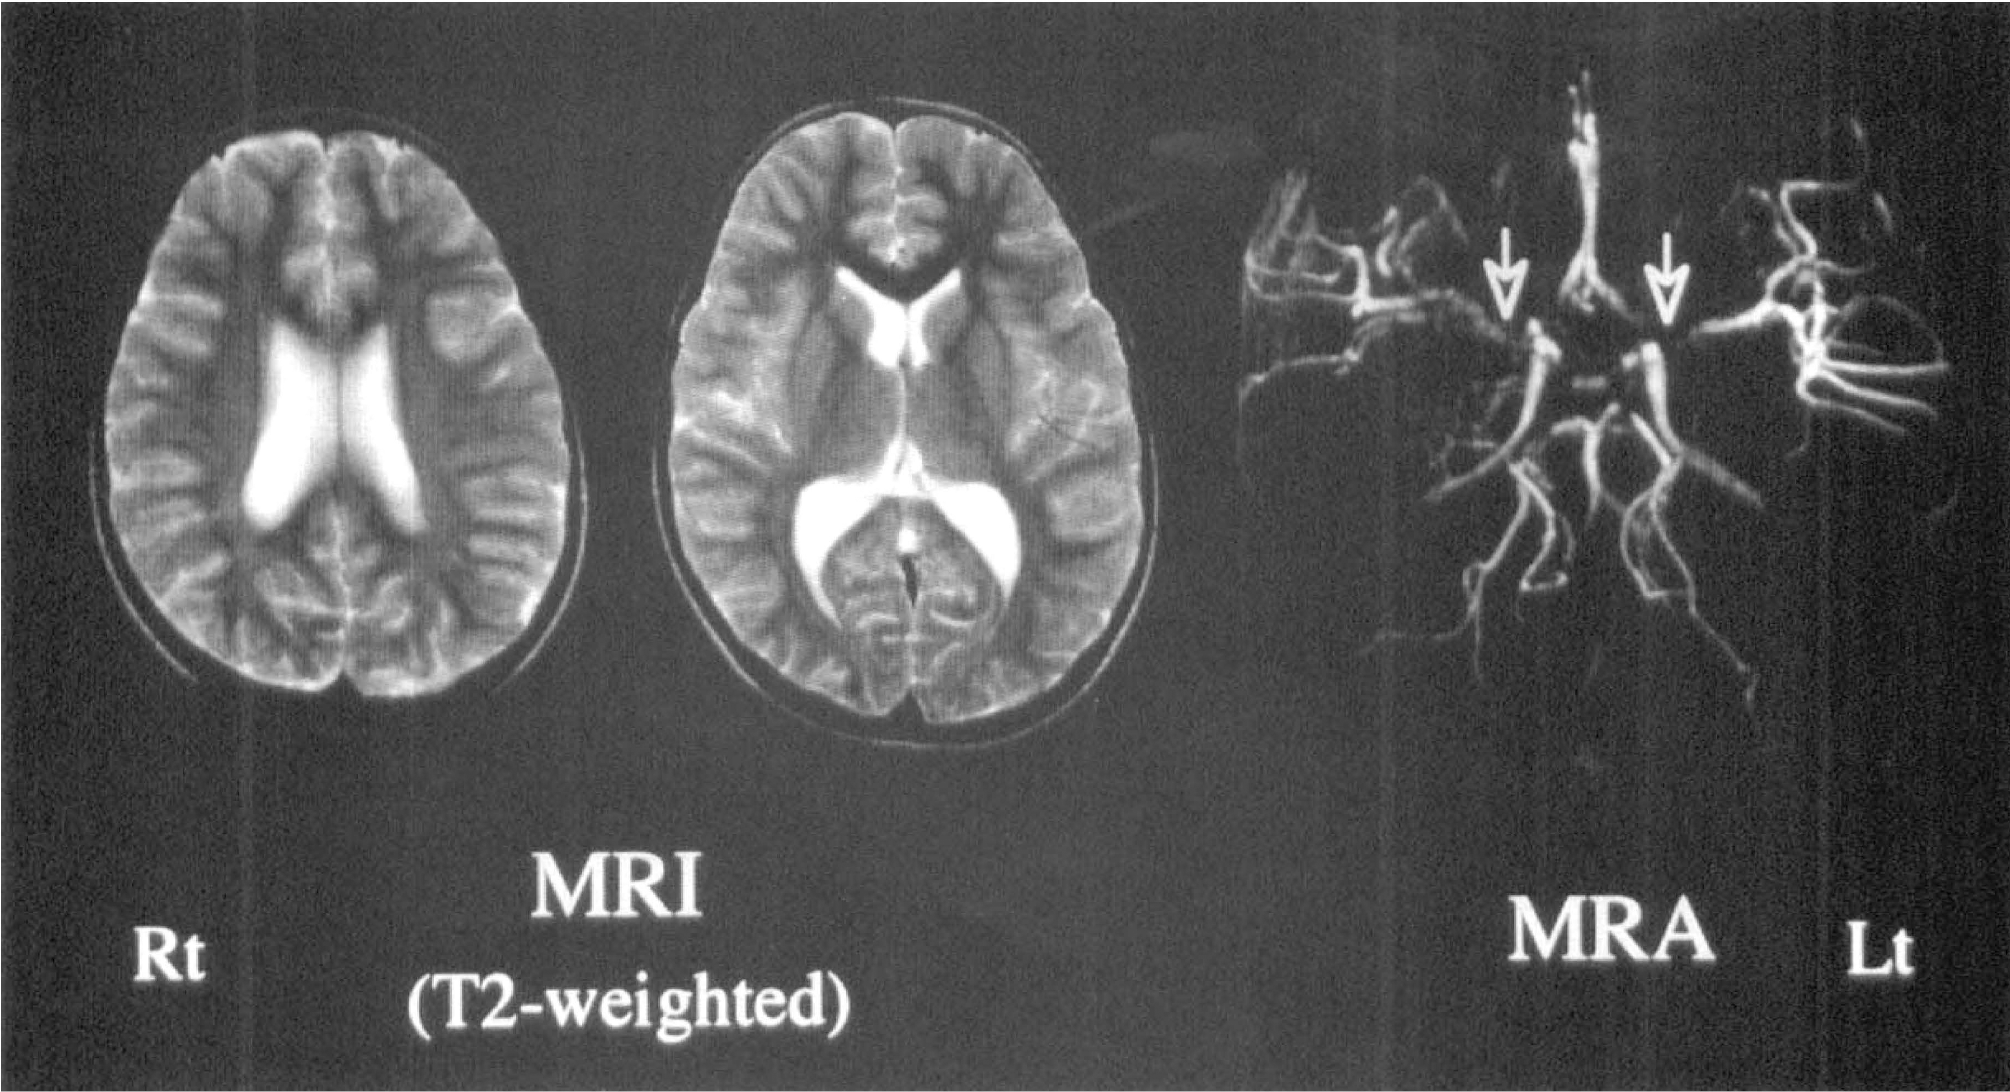
Although the magnetic resonance image (left and middle) is normal, the magnetic resonance imaging angiography (MRA) image (Rt) shows stenosis of the circle of Willis and proliferation of collateral vessels (arrows), especially on the Rt side. Abbreviations as in other figures.
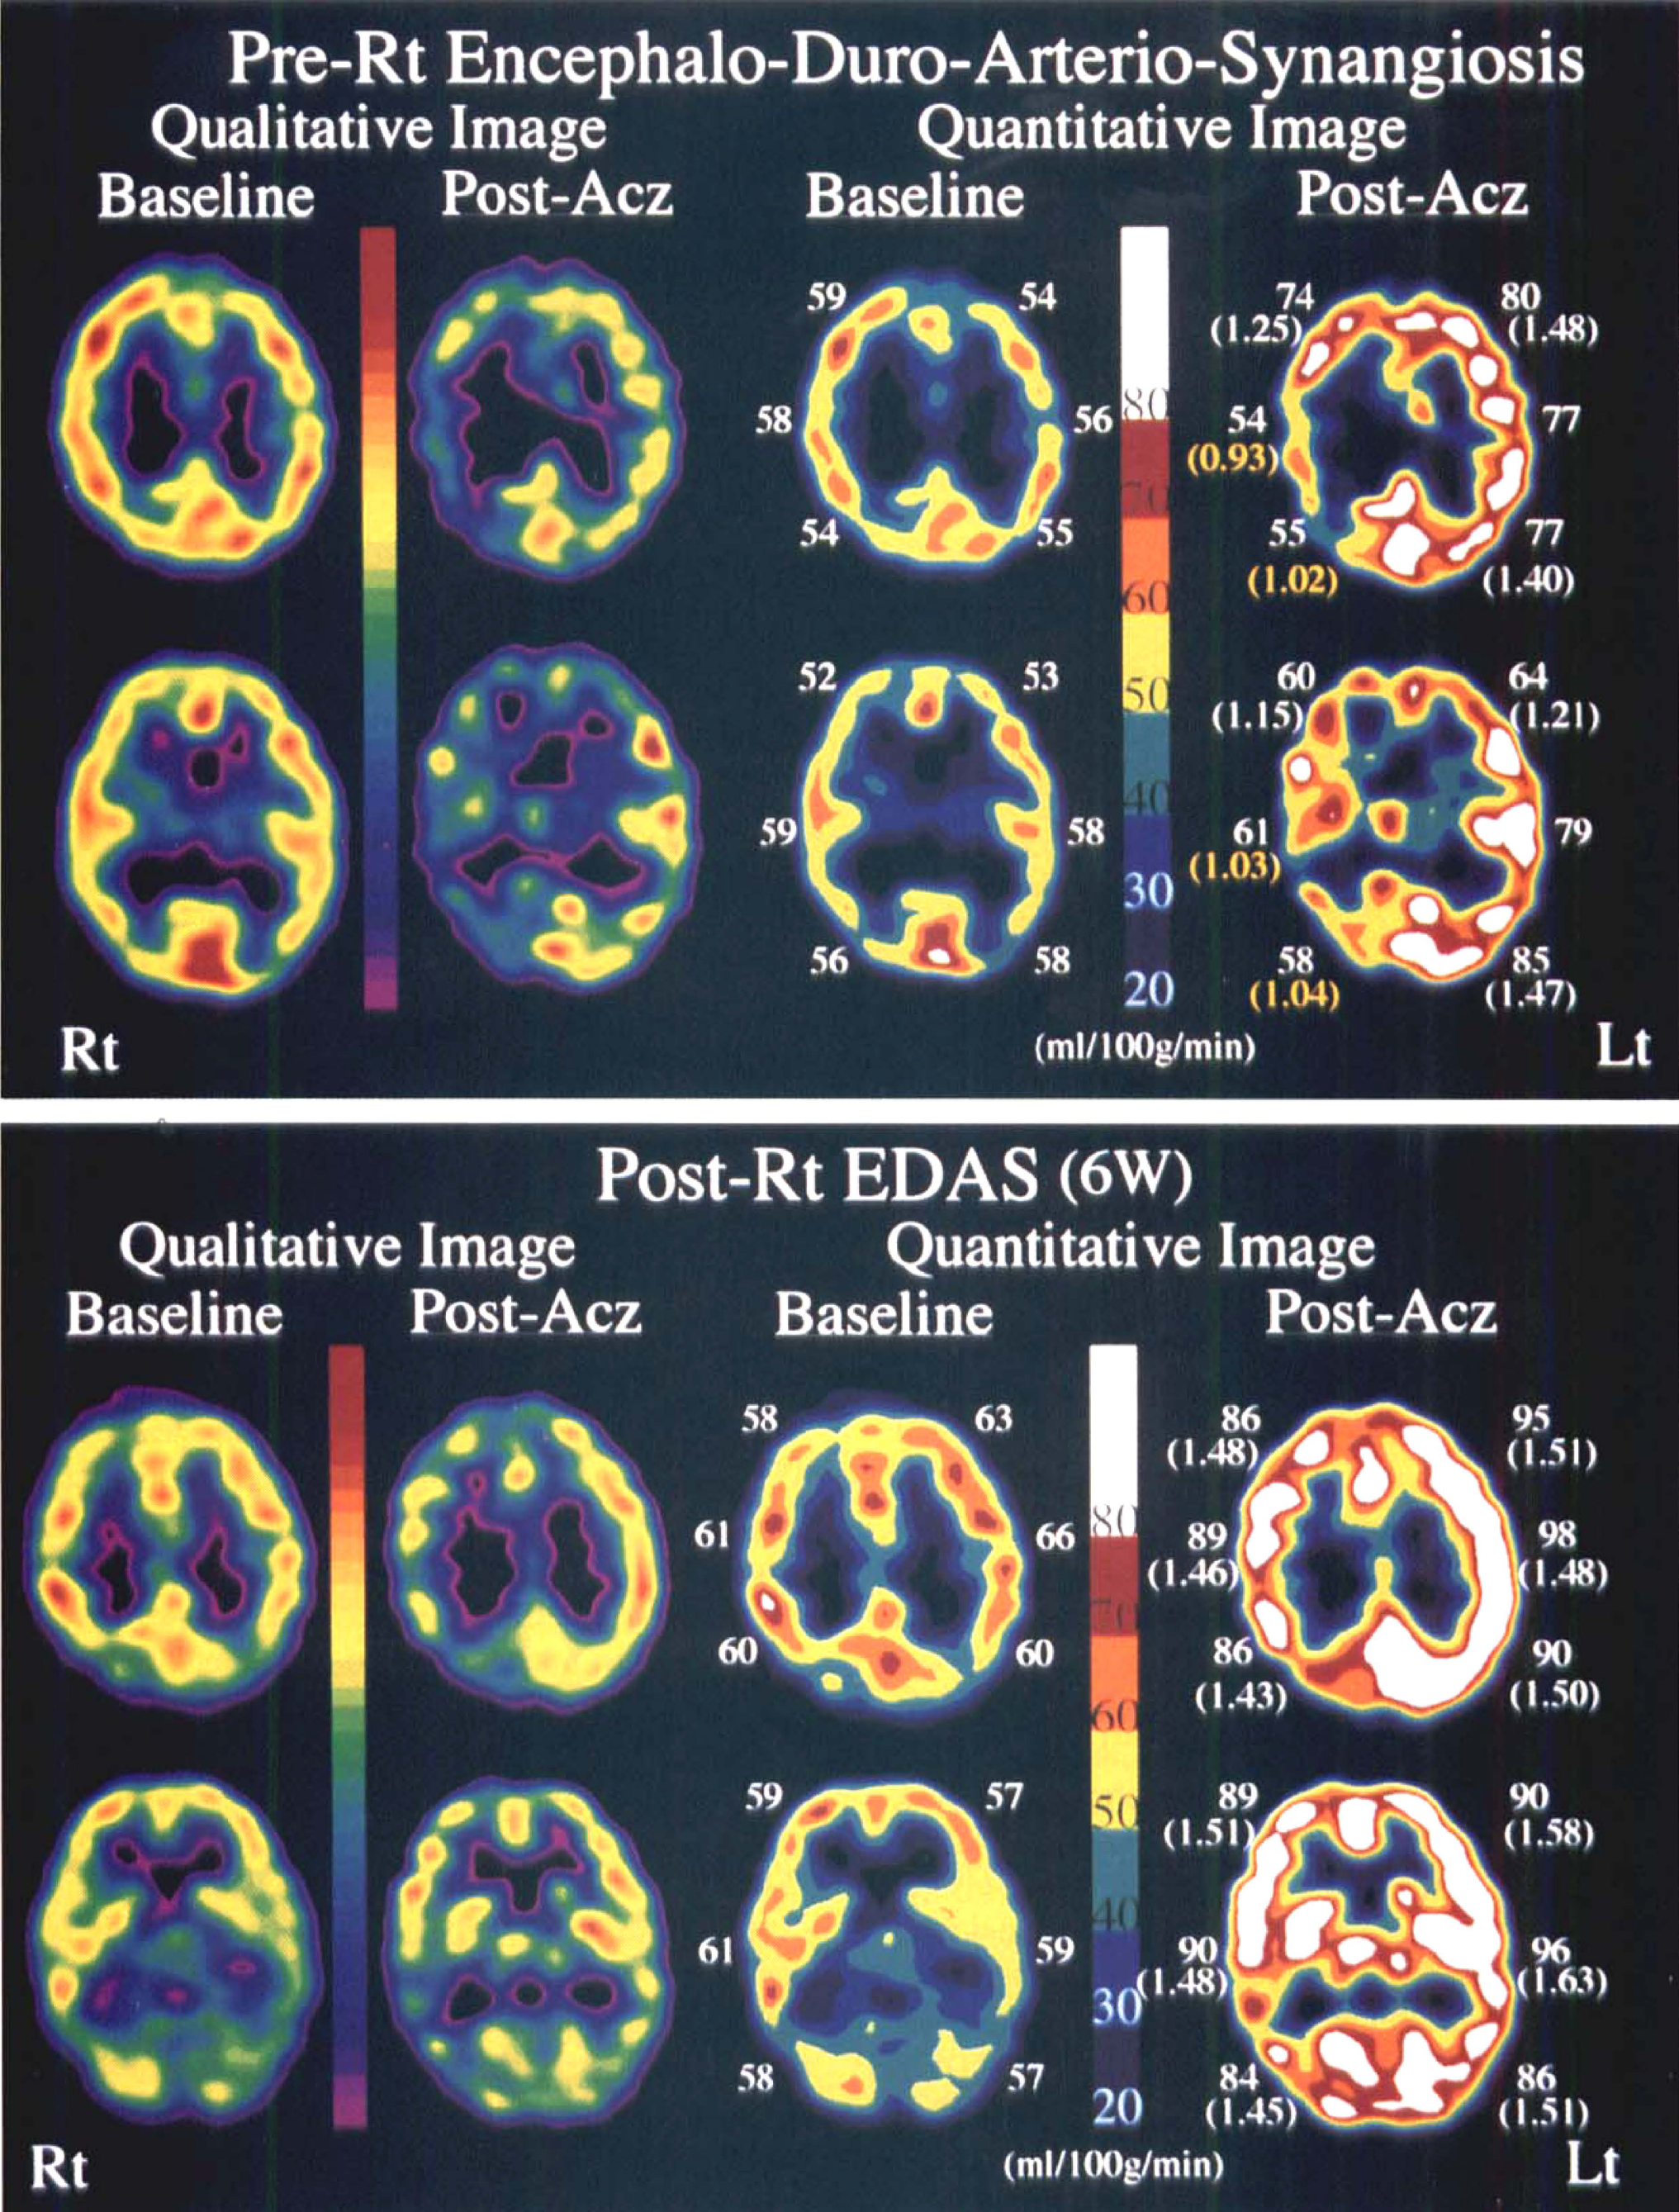
Qualitative and paired quantitative SPECT images at the level of the body of the lateral ventricle (top) and basal ganglia (bottom). Baseline and post-Acz images are shown at the left and Rt side, respectively. The sectoral-shaped regions of interest (ROI, 30 to 50 pixels) were drawn manually in the cortical anterior cerebral artery, middle cerebral artery, and posterior cerebral artery territory of each slice. The numerals exhibit regional cerebral blood flow (rCBF) values of each ROI and the rIR values of each rCBF are shown in parentheses. Abbreviations as in other figures.
Case 2: Patient 28 in Table 3
A 68-year-old woman experienced left facial numbness on September 9, 1996. Her symptoms improved the next day, but severe Rt internal carotid artery stenosis was suspected by cervical Doppler sonography. Magnetic resonance imaging showed several lacunar infarctions in the bilateral internal capsule, and the Rt middle cerebral artery was poorly visualized by MRA (Fig. 7). The 99% stenosis of the Rt internal carotid artery was confirmed by digital subtraction angiography (Fig. 7). The quantitative SPECT images on October 3 showed hypoperfusion in the resting condition and no increase of rCBF during Acz administration in the Rt anterior cerebral artery–middle cerebral artery watershed territory. Decreased regional vascular reserve in the territory was disclosed and endarterectomy of Rt internal carotid artery was performed October 15. The follow-up SPECT studies were performed November 1, 1996 (2 weeks after the operation), and January 14, 1997 (13 weeks after the operation). Although the resting quantitative SPECT images did not change remarkably, Acz-activated quantitative SPECT images clarified gradual improvement of vascular reserve in the watershed territory (Fig. 8).
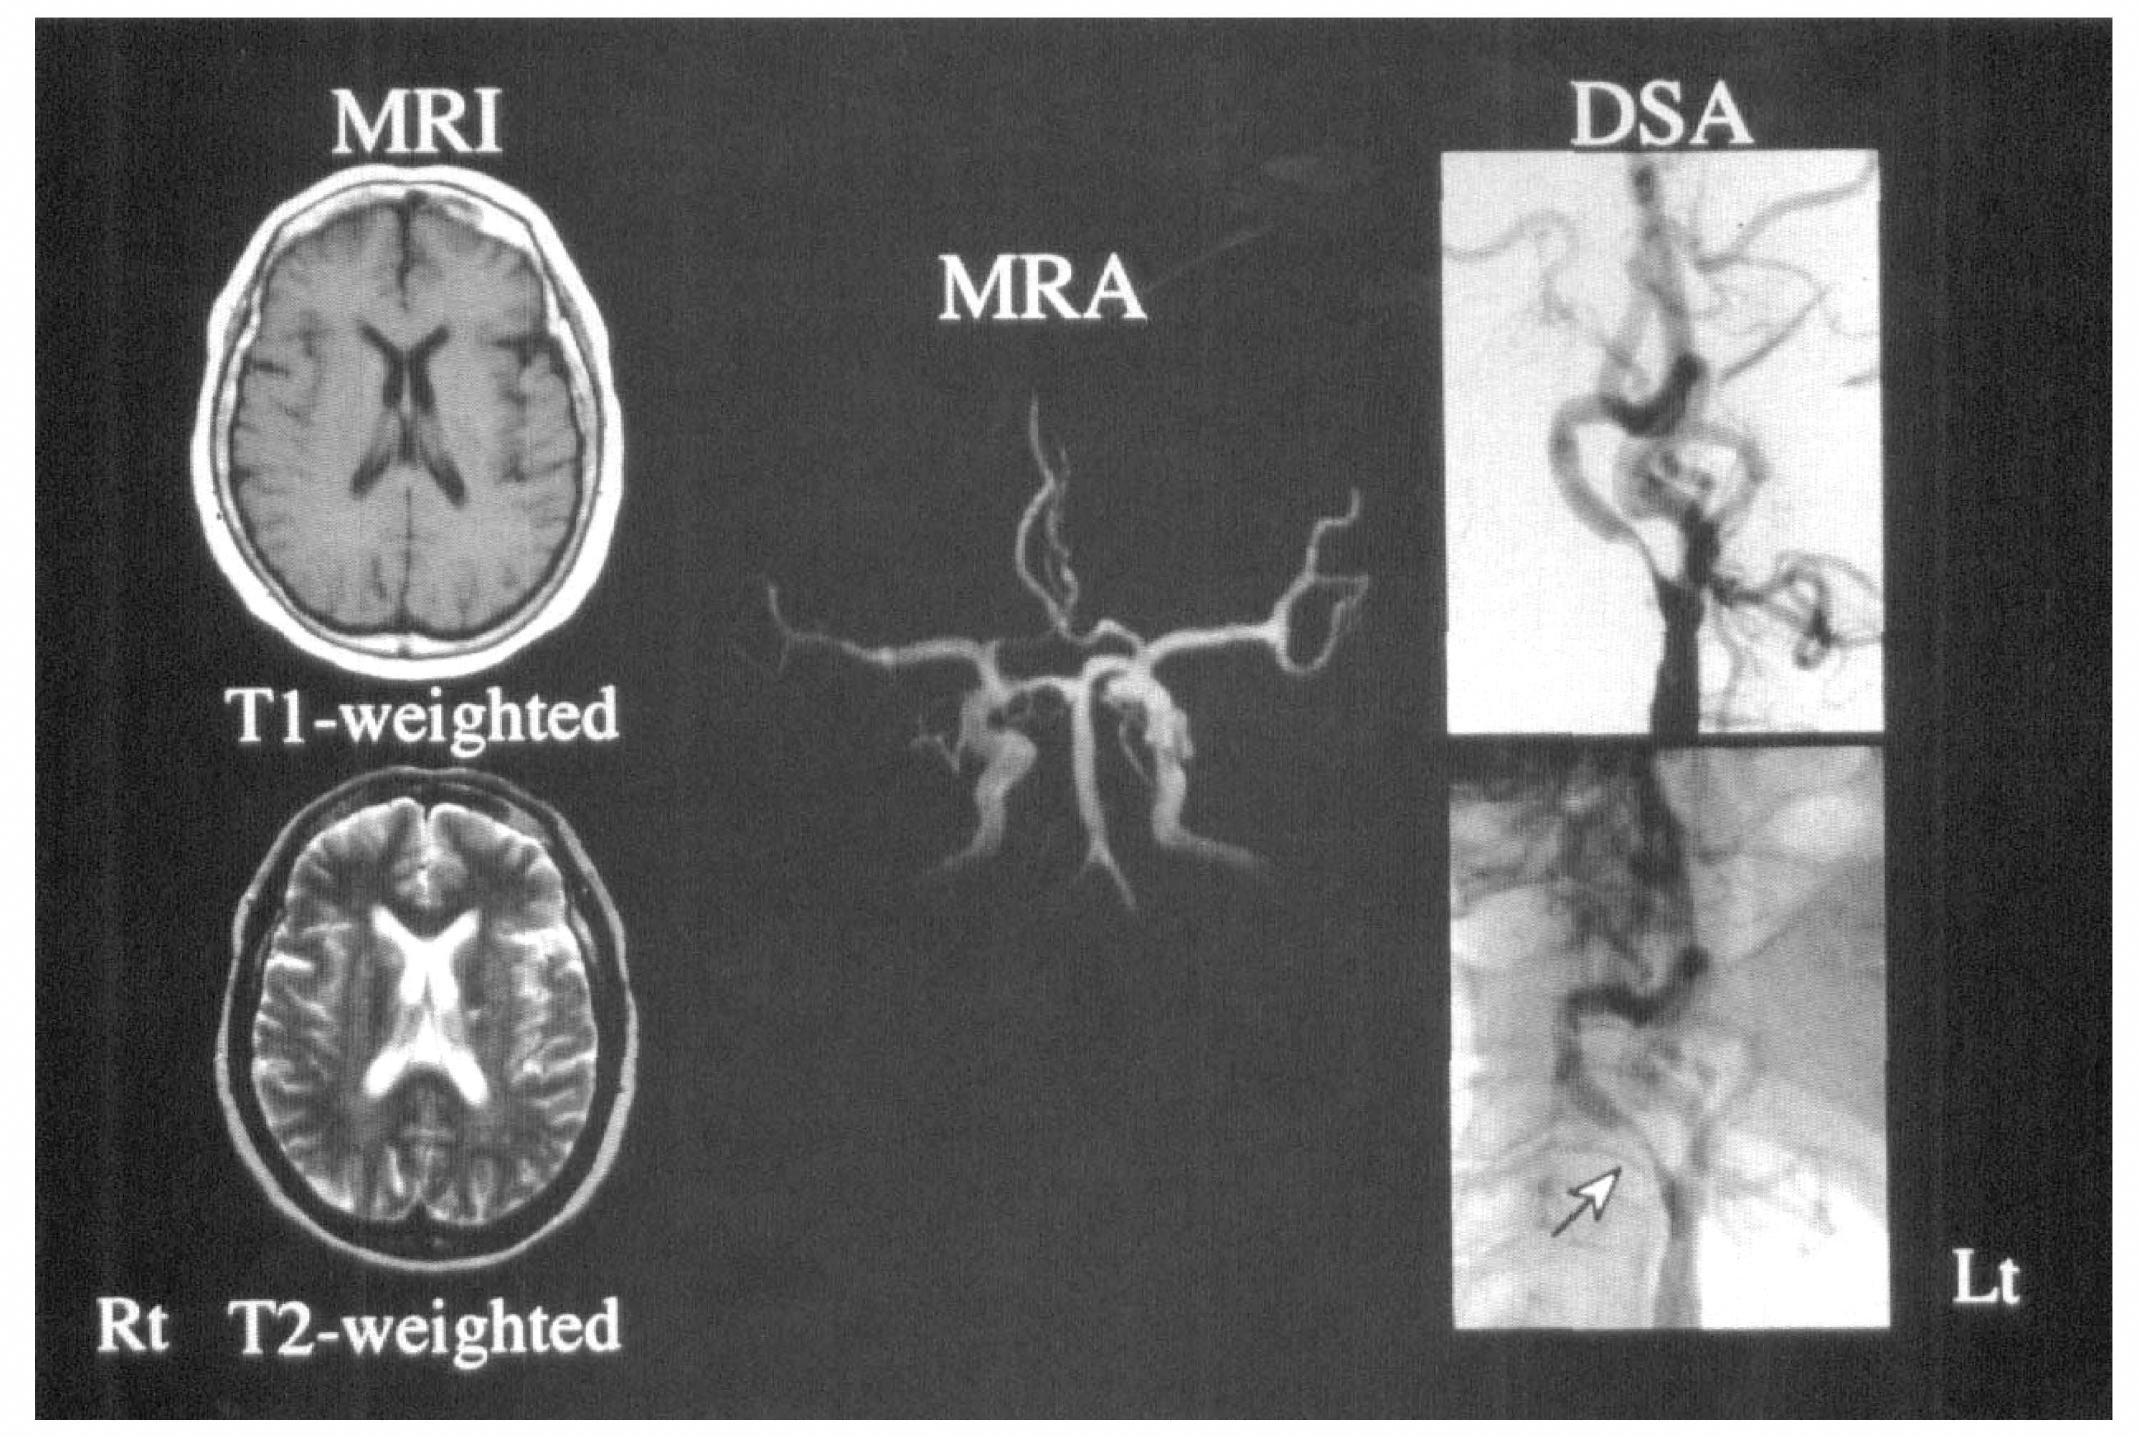
Magnetic resonance image (left) showed several lacunar infarctions in bilateral internal capsule. The Rt middle cerebral artery was poorly visualized by MRA (middle). The 99% stenosis of Rt internal carotid artery (arrow) was confirmed by digital subtraction angiography (Rt). Abbreviations as in other figures.
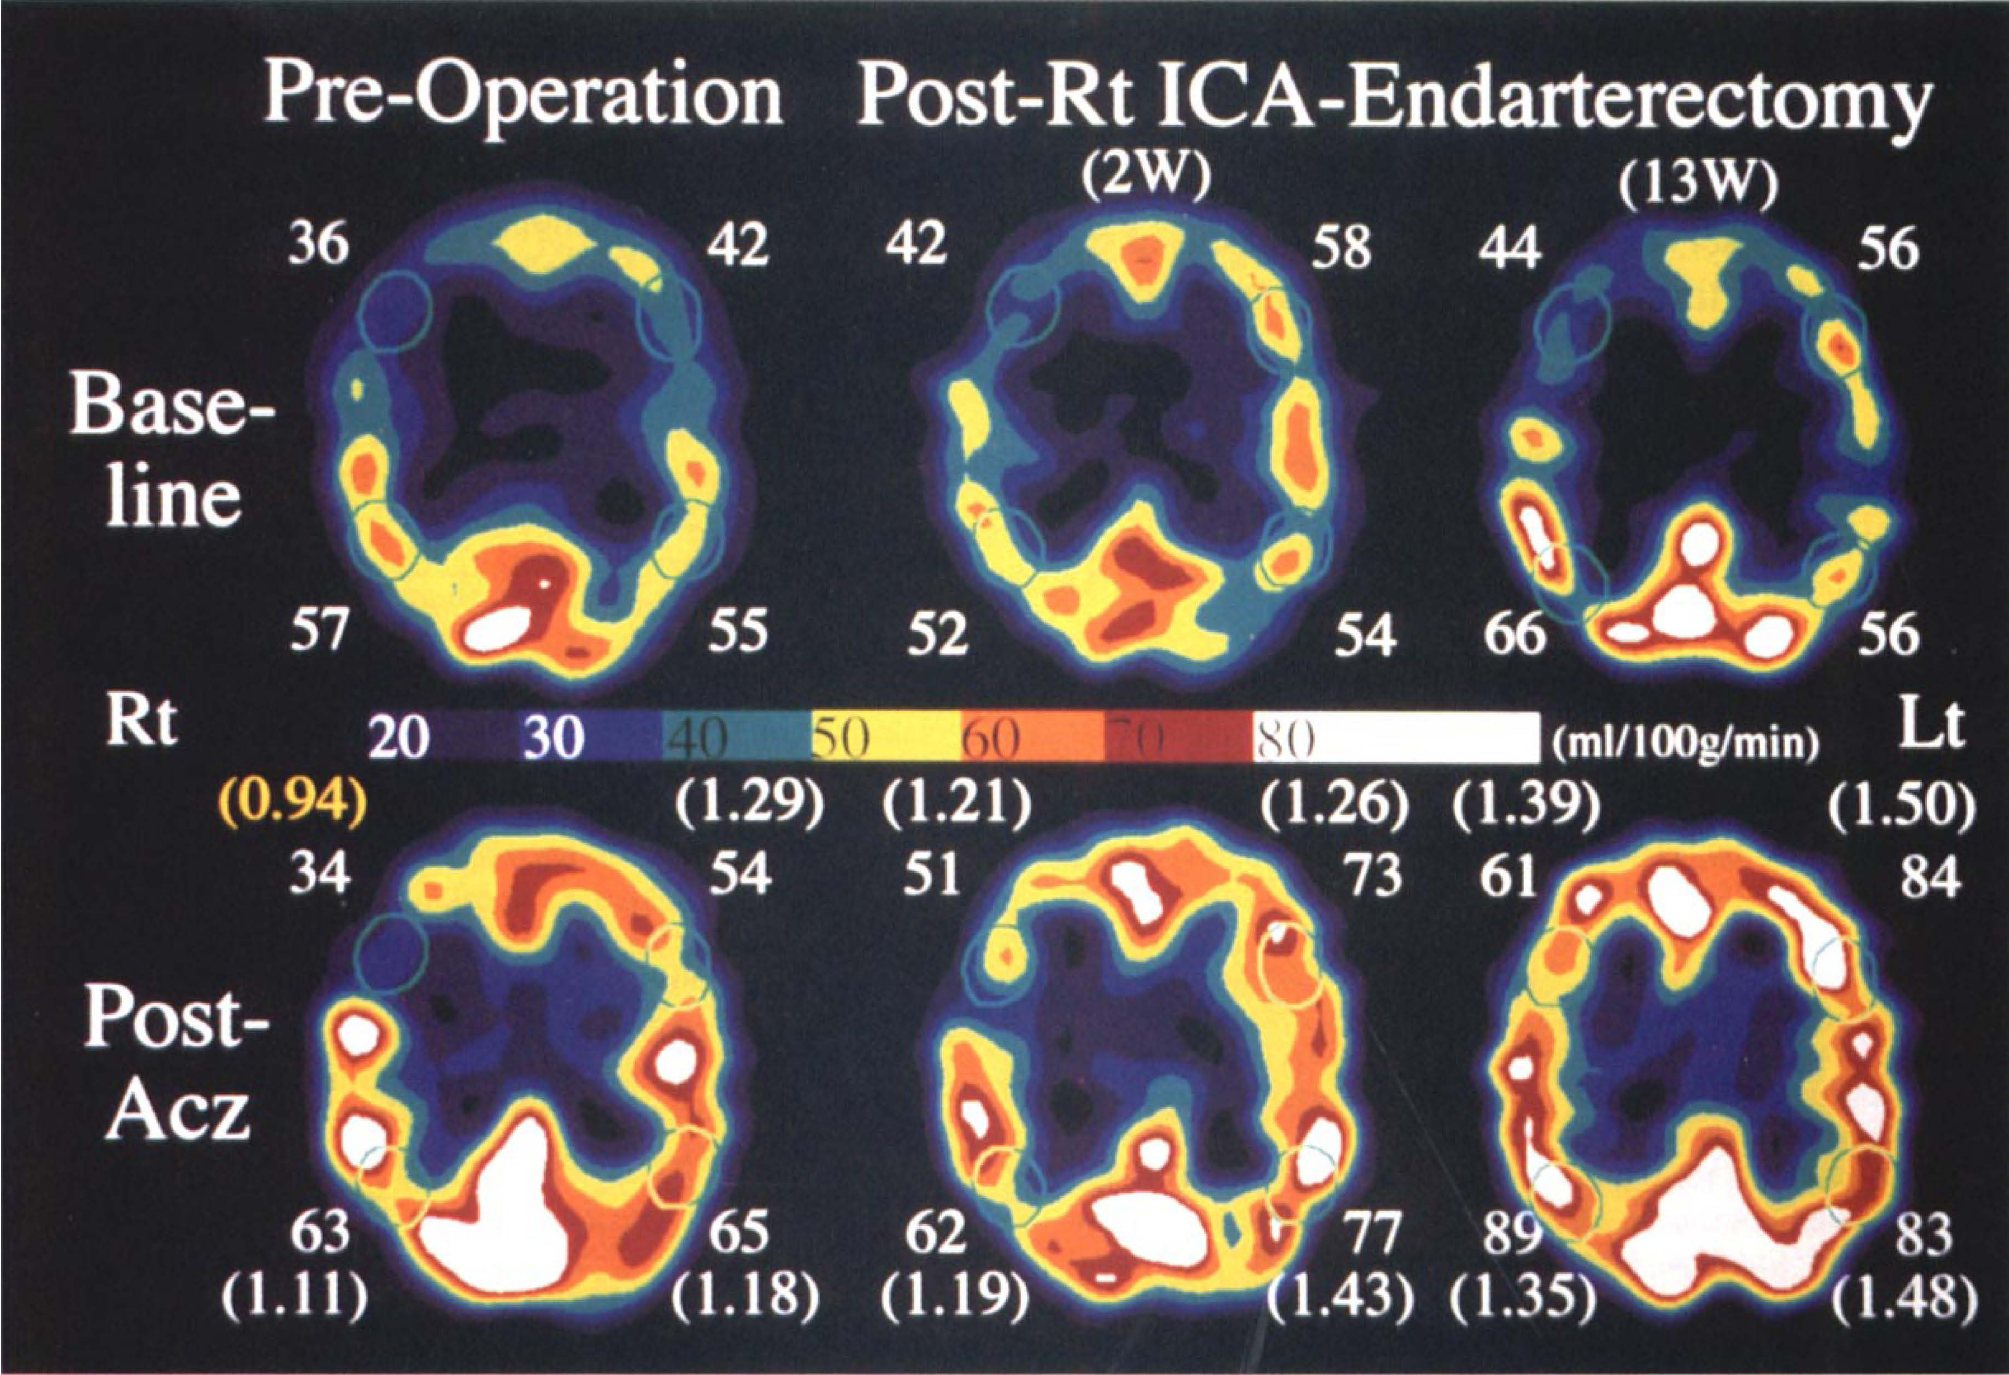
Time course of the quantitative SPECT images at the level of the body of the lateral ventricle. Baseline (top) and respective post-Acz (bottom) images are shown. The numerals of the upper and the lower rows of each image exhibit rCBF values of the anterior cerebral artery–middle cerebral artery and the middle cerebral artery–posterior cerebral artery watershed territory, respectively. Every oval-shaped ROI was composed of 5 pixels. The rIR values of each rCBF are shown in parentheses. Abbreviations as in other figures.
DISCUSSION
In brain perfusion studies, quantitative flow-mapping measurements are required, especially for diagnosis of a diffuse flow reduction, and are essential to evaluate the indication and the therapeutic effects of revascularization surgery. Vasodilation leading to increased cerebral blood volume is reported to be the first response to diminished perfusion pressure in an autoregulation mechanism (Baron et al., 1981; Gibbs et al., 1984), and regions with limited vasodilatory potential would show less blood flow increase in a vasodilatory challenge test. For the estimation of cerebrovascular reserve, Acz, which increases CBF but leaves cerebral metabolic rate for oxygen unchanged (Vorstrup et al., 1984), is widely used with various CBF tracers.
To perform any quantification of rCBF, it is necessary to measure the arterial input of the tracer used. Instead of conventional arterial blood sampling method, Patlak plot graphical analysis (Patlak et al., 1983; Patlak and Blasberg, 1985) was applied to the time activity curves of aortic arch and brain in this protocol. As shown in Fig. 1A, using 99mTc-ECD, consecutive SPECT studies before and after Acz administration with adjunctive radionuclide angiography performed in 2 minutes makes it possible for baseline and post-Acz rCBFs to be quantified using a rectangular gamma camera of the two-head SPECT system without blood sampling. The acquisition conditions of the second SPECT study were identical to those of the first, and the same volume (1.5 mL) of 99mTc-ECD (syringe-type: 3 mL/600 MBq) was split for each SPECT acquisition. Accordingly, the intervals of 99mTc-ECD injections and the commencements of the SPECT acquisitions are identical (26.5 minutes), and some corrections needed for the subtraction of the baseline SPECT data from the second SPECT data were remarkably simplified. As shown in Fig. 1B, the second SPECT data contained 95.1% of the baseline SPECT count and the post-Acz 99mTc-ECD retention (decreased to 95.1% activity because of 99mTc decay within 26.5 minutes), so that 100% of post-Acz 99mTc-ECD activity was obtained by subtracting the baseline SPECT data from 1.052 (1/0.951) multiplied second SPECT data. Neglecting this 99mTc-decay correction would lead to erroneous underestimates of the values of post-Acz CBF.
For this subtraction process, positions of the gamma camera and the subject could not be changed during the interval of consecutive SPECT studies, so that the second radionuclide angiography during Acz administration could not be performed. Hauge et al. (1983) examined the pharmacologic effects on the cerebral and systemic conditions of Acz, and concluded that cardiac output and total peripheral resistance were unaltered during Acz loading. We also monitored cardiac output and systemic blood pressure during Acz administration in five normal volunteers using ultrasound Doppler system, and any significant changes were not observed (data not shown). Hence post-Acz arterial input could be regarded the same as at rest, so that Acz-induced mCBF increase was rightly considered to be causative of Acz-induced mean SPECT count increase. Therefore, post-Acz mCBF could be calculated from the baseline mCBF, the baseline mean SPECT count, and the post-Acz mean SPECT count using Lassen's linearization correction algorithm (α = 2.59). Post-Acz rCBF was converted from post-Acz qualitative 99mTc-ECD transaxial SPECT images using Lassen's linearization correction algorithm. Accordingly, post-Acz rCBF quantification, which was corrected twice by Lassen's algorithm, was deemed to be overestimated. However, as shown in Fig. 2, reproducibility of this protocol was confirmed by the result that administration of physiologic saline instead of Acz (placebo group) caused no significant increase of rCBF or mCBF.
As for washout of the radioactivity from the brain, the loss of 99mTc-ECD from the brain in the period of 30 to ∼100 minutes after injection was reported to be much higher than the corresponding loss of 99mTc-HMPAO and varied from region to region (Holm et al., 1994). However, it was also reported that 99mTc-ECD has a constant decreasing washout rate in all cerebral regions of ∼15% during the first hour after injection (Shishido et al., 1994). Moreover, Hattori et al. (1996) precisely examined consecutive brain perfusion studies using double injections of 99mTc-ECD and Acz, and they concluded that 99mTc-ECD washout was minimal during the first 50 minutes after injection and was not affected by Acz. Therefore, the washout of 99mTc-ECD was regarded as not serious for this protocol because the SPECT data acquisition in this study was obtained 9 to ∼26.5 minutes after injection and the total time required for this protocol was within 1 hour.
Acz was reported to demonstrate approximately 30% flow increase in normal controls measured by 133Xe-SPECT studies (Vorstrup et al., 1986; Kreisig et al., 1987; Bonte et al., 1989). In this study, mIR values of 37 unaffected hemispheres of the unilateral stenosis group and of 45 bilateral hemispheres of the patent group were 1.32 ± 0.17 and 1.40 ± 0.15, respectively, which is comparable to the percent increase from resting values in unaffected cerebral cortices measured by 133Xe-SPECT studies. For the placebo study subjects with various cerebral perfusion conditions, not healthy volunteers, were endeavored to be selected, and excellent reproducibility of the placebo study was manifested. Considering these results, the feasibility of this protocol was supposed to be convincing enough for the routinely performed clinical SPECT study to examine the vascular reserve.
From the standpoint of the follow-up studies, objective judgment of Acz-induced CBF response was impossible only for the qualitative SPECT images, and the baseline quantitative images showed almost the same findings between the preoperative and the postoperative SPECT studies of patient no. 38 (case 1 in case presentation). In this patient the post-Acz quantitative images alone showed the recovery from impaired regional vascular reserve. For the evaluation of patient no. 28 (case 2 in case presentation), quantitative rCBF analyses using global ROI were inadequate and those using localized ROI were essential to manifest diminished regional vascular reserve and to evaluate the therapeutic effects. However, almost all of the hemispheric IR values of the patients in this follow-up study (Table 2) were supposed to exceed 1.20 in accordance with postoperative improvement of their clinical symptoms and MRA findings. Considering that mIR values of 45 studies of the patent group were larger than 1.20 except in only 2 studies (Table 5), further follow-up studies would be continued using 1.20 for the threshold IR value of normal Acz response. Meanwhile, as the IR values of the placebo group were 1.00 ± 0.06 (Table 1), a value of IR ≥1.12, or the mean + 2 SD for the placebo group, was by convention taken to indicate a significant effect of this protocol, although there was an insufficient number of subjects for statistical analysis.
In this study using 99mTc-ECD, a simplified noninvasive quantification method to measure resting- and Acz-activated-rCBF is described. A number of studies have suggested recently that 99mTc-ECD is more sensitive to metabolism than to perfusion as compared with 99mTc-HMPAO during the condition of excess perfusion relative to reduced oxygen consumption, so-called luxury perfusion, which is usually observed in subacute stroke (Moretti et al., 1990; Shishido et al., 1994; Tsuchida et al., 1994; Yonekura et al., 1994). As patients with major stroke were excluded from this study, uncoupling of flow and radionuclide distribution was not believed to exert a major influence on the results obtained with this method. Considering other CBF tracers, the Acz-loading test with 99mTc-HMPAO has not been successful because of its flow-limited extraction efficacy (Knop et al., 1992; Hattori et al., 1996) and its inferior radiochemical purity and stability during Acz administration (Léveillé et al., 1992). Meanwhile, the tracer dynamics of 123I-IMP are rather complex, showing continuous release of the tracer from the lung reservoir to the blood stream and gradual washout from the brain, which preclude simple subtraction method as this study (Nishizawa et al., 1995). For these reasons, 99mTc-ECD is an exclusive CBF tracer that works in this readily accessible double-injection 1-day protocol.
Although the results obtained from this protocol have not been directly compared with those of positron emission tomography or 133Xe-computed tomography yet, the aim of this study is not the measurement of true CBF values but the noninvasive appreciation of cerebrovascular responsiveness during Acz administration using quantified CBF values. The results presented in this study are expected to justify the routine clinical application of this readily performable protocol.
In conclusion, consecutive 99mTc-ECD SPECT studies before and after Acz administration with adjunctive radionuclide angiography are easy to perform for routine clinical studies and quite useful for the evaluation of regional vascular reserve and for the improvement of the sensitivity for detecting regional hemodynamic abnormalities.