
Abstract
Neurovascular and neurometabolic coupling help the brain to maintain an appropriate energy flow to the neural tissue under conditions of increased neuronal activity. Both coupling phenomena provide us, in addition, with two macroscopically measurable parameters, blood flow and intermediate metabolite fluxes, that are used to dynamically image the functioning brain. The main energy substrate for the brain is glucose, which is metabolized by glycolysis and oxidative breakdown in both astrocytes and neurons. Neuronal activation triggers increased glucose consumption and glucose demand, with new glucose being brought in by stimulated blood flow and glucose transport over the blood-brain barrier. Glucose is shuttled over the barrier by the GLUT-1 transporter, which, like all transporter proteins, has a ceiling above which no further stimulation of the transport is possible. Blood-brain barrier glucose transport is generally accepted as a nonrate-limiting step but to prevent it from becoming rate-limiting under conditions of neuronal activation, it might be necessary for the transport parameters to be adapted to the increased glucose demand. It is proposed that the blood-brain barrier glucose transport parameters are dynamically adapted to the increased glucose needs of the neural tissue after activation according to a neurobarrier coupling scheme. This review presents neurobarrier coupling within the current knowledge on neurovascular and neurometabolic coupling, and considers arguments and evidence in support of this hypothesis.
Keywords
Introduction
The brain consists of neurons and glial cells that mutually influence each other and collaborate to keep the brain functional and to perform a spectrum of impressively complex tasks. In addition to the neurons and glial cells, there is a third cell partner present, namely, the vascular cells. Blood vessels are linked to neuronal functioning through the process of neurovascular coupling, that is, the coupling of vessel diameter and thus blood flow, to neuronal activity (Harder et al, 1998; Iadecola, 1993; Kuschinsky, 1997; Lou et al, 1987; Villringer and Dirnagl, 1995; Wahl and Schilling, 1993). Neurovascular coupling or functional hyperemia matches the supply of blood and nutrients to the local needs of the brain cells and brings about an increased blood flow after local neuronal activation. Through this process, vascular cells are functionally linked to the neural tissue, making them essential members of the diverse family of brain cells that together constitute the neurovascular unit. This is elegantly illustrated by the recent work of Zonta et al (2003), who demonstrated in acute brain slices from rat cortex that neuronal activation causes vasodilation through a communication chain passing from neurons over astrocytes to the vascular cells. Neuronal activity is determined by the electric and synaptic activity, that is, the rate of action potential firing, the release of neurotransmitter vesicles from the presynaptic ending, and the subsequent postsynaptic chemical and electrical responses. Most of the energy needs of the neural tissue derive from restoration of transmembrane ion gradients that are temporarily disturbed by action potentials and postsynaptic currents (Attwell and Iadecola, 2002). Glucose is under normal circumstances the only useful energy substrate for the brain, being degraded by glycolysis, the tricarboxylic acid (TCA) cycle, and oxidative phosphorylation (Chih and Roberts Jr., 2003). As expected from neurovascular coupling, regional glucose use and consumption in the brain is strongly correlated with the local blood flow (Bryan et al, 1983; Clarke and Sokoloff, 1999; Ginsberg et al, 1986; Hawkins et al, 1985; Sokoloff, 1977), thereby linking neuronal activity, metabolic rate, and blood flow. Work from the group of Magistretti and others has demonstrated that neuronal activity and glucose metabolism are more than just linked and are effectively tied together (Magistretti et al, 1999). According to their hypothesis, which has been critically reviewed recently (Chih and Roberts Jr. 2003), glucose metabolism is compartmentalized in the brain under conditions of activation, with glycolytic breakdown localized in the astrocytes, and TCA processing and oxidative breakdown taking place in the neurons (Pellerin et al, 1998); recent data seem to confirm such a scheme (Kasischke et al, 2004). Glutamate released from glutamatergic synapses is taken up by the astrocytes in cotransport with sodium, thereby increasing intracellular sodium and stimulating the sodium-potassium pump (Pellerin and Magistretti, 1997). This increases the astrocytic ATP consumption and drives glycolysis to back up the cellular ATP content. The product of glycolysis in astrocytes is lactate, a monocarboxylic acid that is assumed to be shuttled to the neurons for further breakdown in the TCA cycle (Bittar et al, 1996; Schurr et al, 1999). This signaling cascade links neuronal glutamate release and astrocytic glucose metabolism in a stoichiometric manner (Magistretti et al, 1999), thereby securing narrow metabolic coupling between neurons and astrocytes, which is called neurometabolic coupling (Magistretti and Pellerin, 1999; other aspects of neuron-astrocyte metabolic interactions are discussed in Deitmer, 2001; Fillenz et al, 1999; Hertz et al, 2000; Tsacopoulos and Magistretti, 1996). In the following discussion, we present a third aspect of coupling that may act in concert with neurovascular and neurometabolic coupling to help furnish an adequate glucose supply to the neural tissue on activation. It concerns the coupling of neuronal activity to the activity of the glucose transporters that shuttle glucose over the blood-brain barrier, a coupling phenomenon we propose to call neurobarrier coupling (Figures 1 and 2).
Blood-Brain Barrier Glucose Transport
The functional players of neurovascular and neurometabolic coupling are neuronal activity, metabolic rate in astrocytes and neurons, and blood flow. In addition to these three, a fourth parameter, which is the transport of glucose from the blood to the brain, needs further consideration. Brain glucose transport involves the breaching of two barriers, including the blood-brain barrier formed by the capillary endothelial cells, which are effectively connected together by tight junctions, and the barrier formed by the plasma membranes of neurons and astrocytes to which glucose must be delivered. Glucose transport over the endothelial blood-brain barrier is mediated by facilitated diffusion via the GLUT-1 transporter, which is located at very high density in both luminal and abluminal plasmamembranes of the endothelial cells (Pardridge, 1991). Transport of glucose into the astrocytes occurs through the same transporter that is present in these cells (although at far lower density) under a less glycosylated form with lower molecular weight (45 kDa) as compared with the endothelial transporter (55 kDa; Dwyer et al, 2002; Vannucci et al, 1997). Neurons consume, in addition to astrocytic lactate, glucose that is transported into these cells through the GLUT-3 transporter (Leino et al, 1997). The relative contribution of glucose and lactate as neuronal energy substrates is currently not fully established (Chih and Roberts Jr., 2003), but neuronal glycolysis (and glucose uptake) is, like astrocytic glycolysis, also tightly coupled to neuronal activity by means of activation of the glycolytic enzymes hexokinase, phosphofructokinase, and pyruvate kinase when the cellular ATP concentration is lowered as a consequence of increased neuronal activity (Magistretti, 2003) (Figure 3).
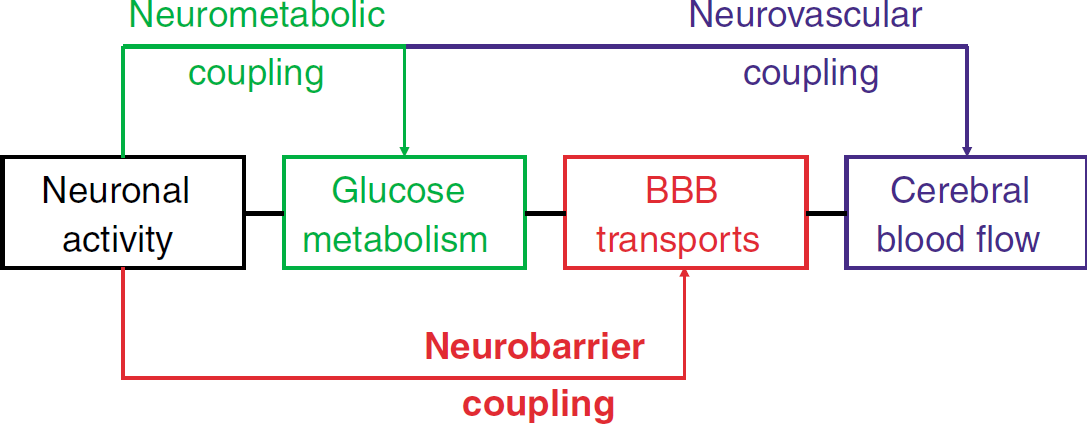
Neuronal activity triggers various responses that act together to adapt the delivery of energy substrate to the local neuronal needs. Neurovascular coupling involves the dilation of blood vessels to increase the local blood flow, while neurometabolic coupling denotes the stimulation of energy metabolism to keep up with cellular ATP consumption. We propose that neuronal activity brings about changes at the level of the blood-brain barrier (BBB), establishing neurobarrier coupling that acts to increase the transport of energy substrate, mainly glucose, over the barrier.
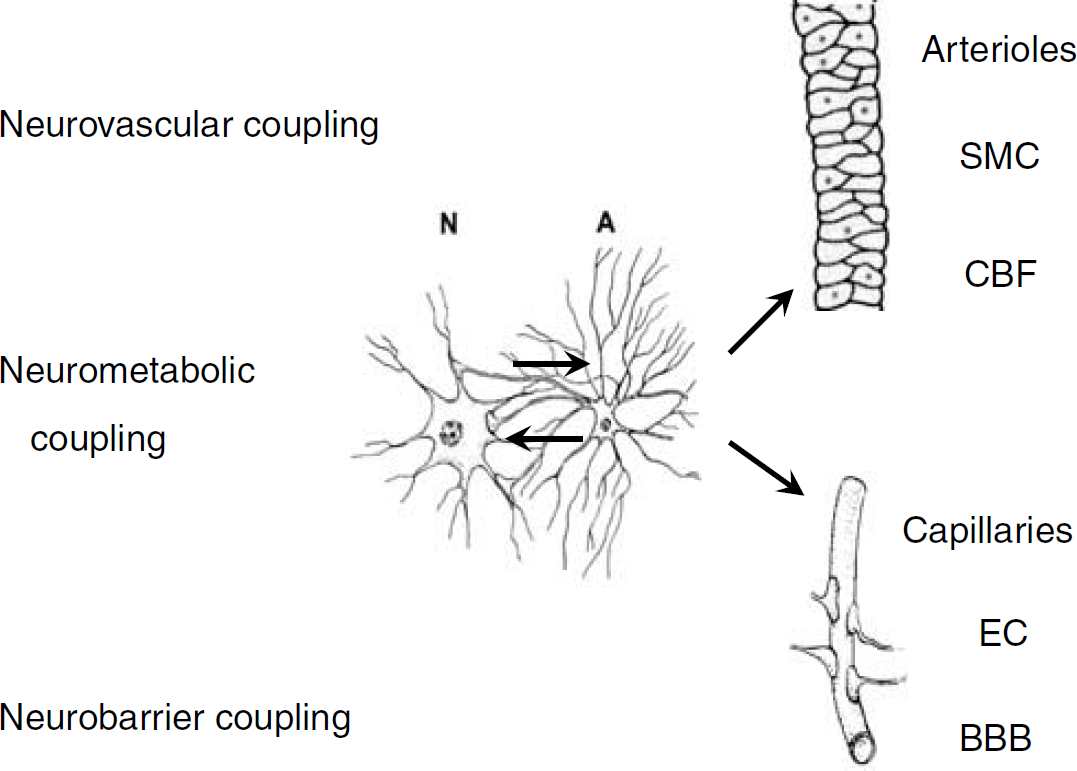
Neurovascular coupling acts to relax smooth muscle cells (SMC) of arterioles to increase the local cerebral blood flow (CBF). Neurometabolic coupling involves interactions (signals and transports) between neurons (N) and astrocytes (A) that trigger the glycolytic breakdown of glucose. The targets of neurobarrier coupling are the endothelial cells (EC) that make up the blood-brain barrier (BBB). Astrocytes form a relay station between neurons and vascular cells and contribute as an intermediate signaling step in neurovascular coupling. Astrocytes are in very close contact with the majority of blood-brain barrier endothelial cells, opening up the possibility that astrocyte-to-endothelial cell communication is involved in neurobarrier coupling.
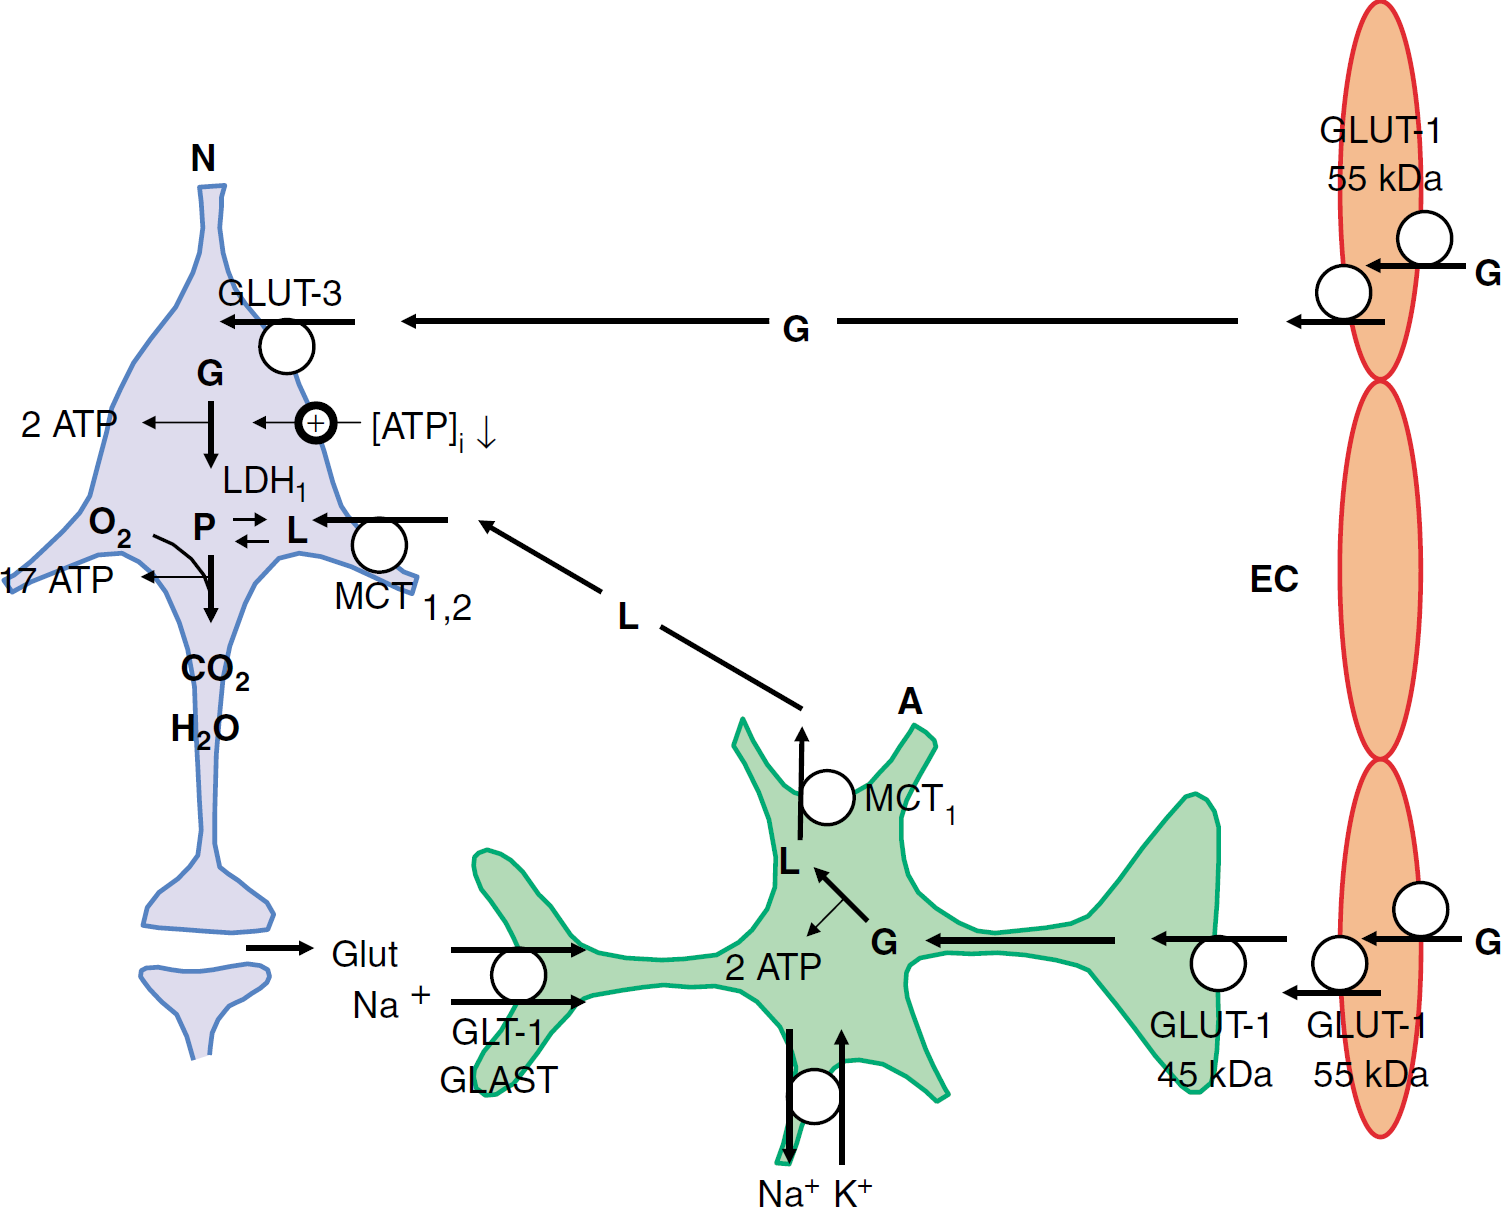
Neurometabolic coupling pathways. Glucose (G) enters the brain interstitium via the 55 kDa GLUT-1 transporter in the luminal and abluminal plasma membranes of blood-brain barrier endothelial cells (EC). Neurons (N) take up glucose via GLUT-3 transporters, convert it to pyruvate (P) via glycolysis (yielding 2 ATP per molecule of glucose) and metabolize it further via the tricarboxylic acid cycle and oxidative phosphorylation (yielding 17 ATP per molecule of pyruvate). On brain activation, the ATP concentration in the neurons ([ATP]i) decreases, thereby releasing the negative feedback of ATP on the glycolytic enzymes hexokinase, phosphofructokinase, and pyruvate kinase, and stimulating glycolysis. Brain activation is associated with increased activity at glutamatergic synapses and the released glutamate is taken up by the astrocytes (A) in cotransport with sodium (via GLT-1 and GLAST transporters). The intracellular sodium load in astrocytes is removed via the Na/K pump that consumes ATP and thereby stimulates astrocytic glycolysis. Lactate (L), the endproduct of glycolysis in astrocytes (by conversion from pyruvate via LDH5), leaves the cells via MCT1 mono-carboxylate transporters and is taken up by the neurons via MCT1 and MCT2 (astrocyte-neuron lactate shuttle hypothesis). In the neurons, lactate is converted to pyruvate via LDH1 and is further degraded oxidatively. Glutamate is recycled via the glutamate-glutamine cycle acting between astrocytes and neurons (not shown). Glucose is delivered to the astrocytes via the 45 kDa GLUT-1 transporter in the plasma membranes of astrocytic end-feet. Astrocytes also contain a small glycogen stock (not shown) that can be mobilized on brain activation and subsequently refilled with blood glucose. References are given in the text. The stoichiometries of glucose breakdown have been omitted for simplicity.
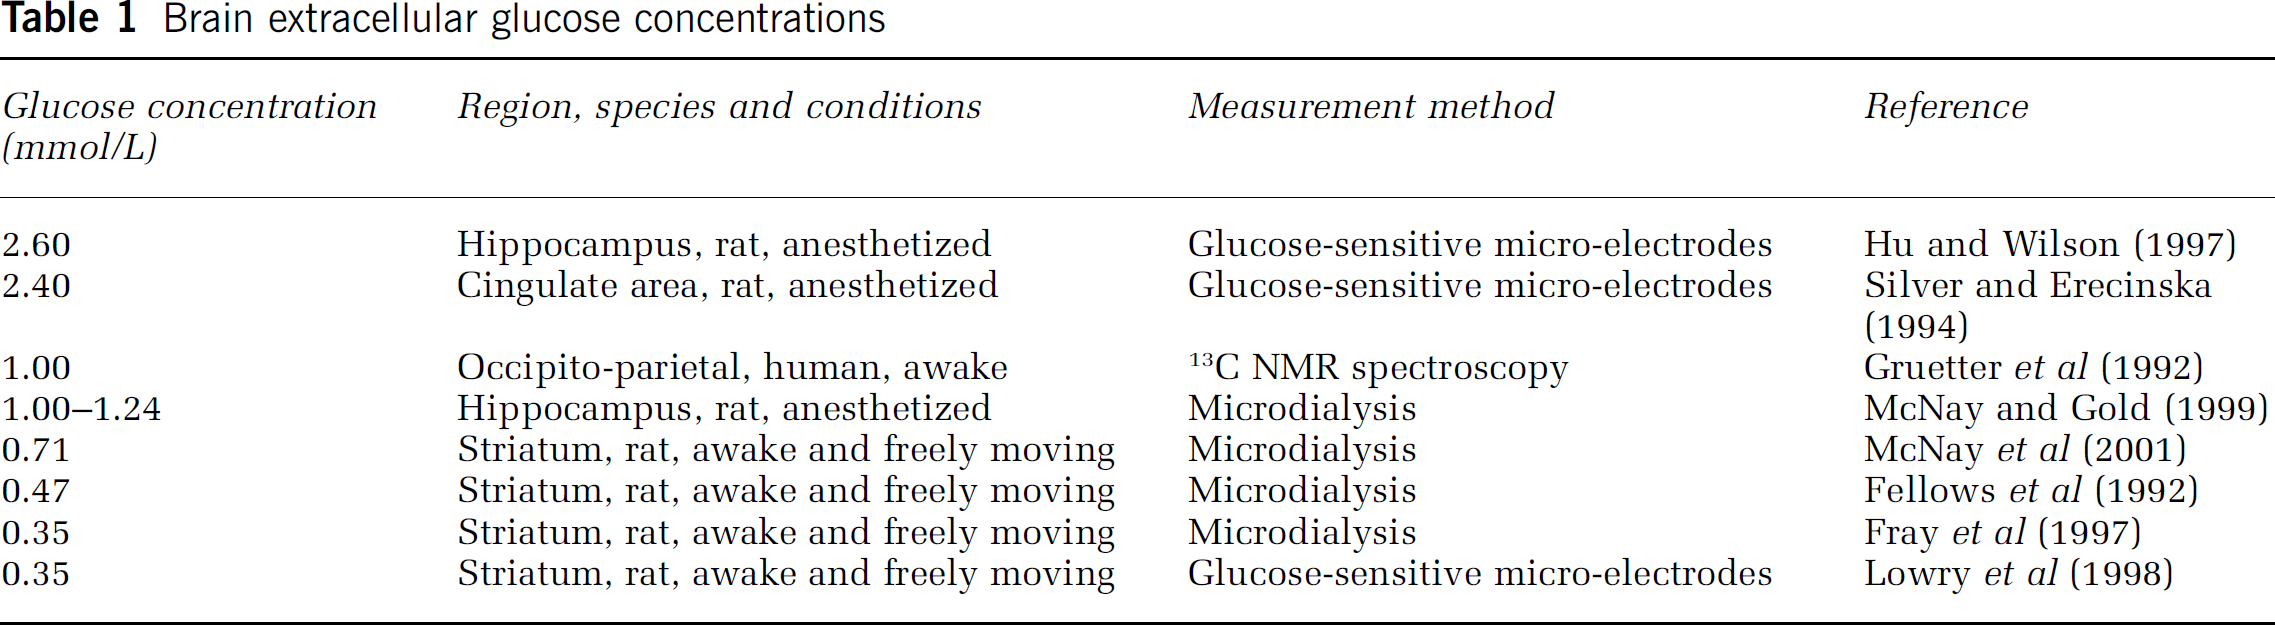
An important question concerning brain glucose transport and metabolism is the localization of the rate-limiting step. From the two barriers referred to, the barrier located at neuronal/astrocytic plasma membranes is the most permeable one because there appears to be no glucose concentration difference between the intra- and extracellular brain compartments (Gjedde and Diemer, 1983; Gruetter et al, 1996; Pfeuffer et al, 2000; Silver and Erecinska, 1994). The blood-brain barrier is less permeable because it separates two spaces with different glucose concentrations: approximately 5mmol/L in the blood plasma at normoglycemia and approximately 1 mmol/L in the brain extracellular space (range 0.35 to 2.6 mmol/L depending on the brain region where the measurement was done, the measurement technique, and the state of wakefulness, as illustrated in Table 1).
Brain extracellular glucose concentrations
Despite its lower glucose permeability, the transport of glucose over the blood-brain barrier is generally assumed to be not rate-limiting for glucose metabolism, because if it was rate-limiting then glucose delivery would become precarious in view of fluctuations in plasma glucose (Davson and Segal, 1996), and brain glucose concentrations would approach zero, which is not observed (Lund-Andersen, 1979). Further arguments are that the 1 mmol/L brain glucose concentration is largely above the Km of the hexokinase (50 μmol/L, Lund-Andersen, 1979), the first enzymatic step in glycolytic glucose degradation, and that the blood-brain barrier glucose transport rate (symbolized by TG) is approximately 50% above the metabolic rate of glucose consumption (symbolized by CMRG) under basal conditions (de Graaf et al, 2001). The first rate-limiting step thus appears to be glucose phosphorylation by the hexokinase (Furler et al, 1991; Robinson and Rapoport, 1986). Blood-brain glucose transport can however become rate-limiting when the blood glucose concentration decreases below 3 mmol/L (hypoglycemia) (Gruetter et al, 1992), in which case the brain glucose concentration will start to decrease (Blomqvist et al, 1998; Choi et al, 2001). In addition, the transport can become rate-limiting as a result of compromised blood-brain barrier transport in Alzheimer's disease (Kalaria and Harik, 1989), after an epileptic insult with associated increased metabolic consumption or in the case of an inherited deficiency in GLUT-1 transporter (De Vivo et al, 1991; Klepper et al, 1999; Siesjo, 1978; Vannucci et al, 1998a; Vannucci et al, 1997).
Adaptation and Regulation of Blood-Brain Barrier Glucose Transport
Transport or reaction steps that are not rate-limiting are, in general, not considered as important regulation points within a transport or reaction cascade. Because blood-brain barrier glucose transport is not rate-limiting, it follows that this transport is not involved in regulating brain glucose metabolism (Gruetter et al, 1996). This does not however exclude the fact that blood-brain barrier glucose transport is adapted under certain conditions. Sustained or repeated decreases or increases of the plasma glucose concentration, as occur in poorly controlled diabetes, are known to upregulate or downregulate, respectively, blood-brain barrier glucose transport, with the aim of providing a constant glucose supply to the brain (Christensen et al, 1981; Gjedde and Crone, 1981; Hasselbalch et al, 2001b, 1995; McCall et al, 1982; Mooradian and Morin, 1991; Pardridge et al, 1990; Pelligrino et al, 1990). In addition, glucose transport over the blood-brain barrier changes in function during development (Bauer et al, 1995; Devaskar et al, 1991) and displays regional variability, with the transport rate being in line with the local metabolic demands (de Graaf et al, 2001; Hawkins et al, 1983) and blood flow (Gjedde and Diemer, 1985; Schrock and Kuschinsky, 1988; Sokoloff, 1978). These examples thus illustrate long-term glucose transport regulation controlled by development, plasma glucose levels, local metabolic needs, and bloodflow.
Glucose Transport and Consumption
In most models currently used, blood-brain barrier glucose transport is described by a Michaelis-Menten function. Determined through various methods, both in rodents and humans, the Km value of the Michaelis-Menten relation, which in the context of blood-brain barrier transport is symbolized by Kt, is in the range of 5 to 10 mmol/L when the data fit is performed using a standard ‘symmetric’ Michaelis-Menten-based model (Gruetter et al, 1996, Gruetter et al, 1998; Lund-Andersen, 1979) and in the order of 1 to 2 mmol/L when modeling is performed with the ‘reversible’ model that includes a product inhibition effect at the brain side (Choi et al, 2001; Cunningham, 1986; Cunningham et al, 1986; Gjedde, 1992; Gruetter et al, 1998; Mason et al, 1992; Rothman, 2001). The Vmax, symbolized by Tmax for barrier transport, is in the order of 1 μmol/g per minute (Gjedde, 1992; Gruetter et al, 1996) with slightly higher values (1 to 1.5 range) obtained with the standard model (Betz and Iannotti, 1983; Pardridge, 1983) and lower values (0.65) with the reversible model (de Graaf et al, 2001; Gruetter et al, 1998). The lower Kt estimates of 1 to 2 mmol/L are close to the Km values for the GLUT-1 transporter (0.5 to 2 mmol/L; Carruthers, 1990) and are therefore considered as the more precise estimate (Gruetter et al, 1998). With a Kt of 1.5 mmol/L and a plasma glucose concentration of 5 mmol/L, the blood-brain barrier glucose transport is calculated to attain 77% of its maximal value with the most simple Michaelis-Menten formulation:
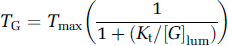
[G]lum in this equation denotes the glucose concentration at the luminal (blood) side of the barrier. This yields a resting (basal) TG value of approximately 0.77 μmol per g wet weight per minute. The calculation can be repeated with a more correct transport equation in which abluminal glucose ([G]ablum) is not assumed to be zero (Aubert and Costalat, 2002; Friedman, 1986; Lund-Andersen, 1979):
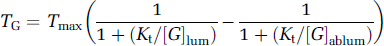
Substitution of the relevant values ([G]ablum = 1 mmol/L; Kt and [G]lum as in the previous calculation) yields a transport of 37% of Tmax, that is, 0.37 μmol/g per minute. These calculated TG values should be contrasted to the CMRG values, which are in the 0.25 to 0.35 μmol/g per minute range for both rodents and humans (cortex or whole brain under basal conditions; Clarke and Sokoloff, 1999; de Graaf et al, 2001; Gruetter et al, 1996; Hasselbalch et al, 2001a; Magistretti, 2003; Ueki et al, 1988). A comparison of the TG and CMRG values indicates that glucose delivery is just enough to keep up with basal glucose consumption (TG/CMRG 1 ≈1), with the most correct calculation based on equation (2), and is about twice the basal glucose consumption (100% above CMRG) when calculated with equation (1). de Graaf et al (2001) have reported a value of 50% above basal CMRG. Physiological levels of brain activation, for example, as triggered in humans by exposure to visual stimuli, bring about a CMRG increase in the range of 23% to 51% above baseline (Fox et al, 1988; Shulman and Rothman, 1998), and much larger increases are observed after direct electrical stimulation of the rat skin (Hyder et al, 1996). We conclude from these considerations that blood-brain glucose transport is not rate-limiting under basal conditions but that it may become rate-limiting in brain regions that experience activation.
Glucose Transport and Neurovascular Coupling
Neurovascular coupling is designed to adapt the glucose and oxygen delivery to the increased metabolic needs after brain activation (Magistretti, 2003). The relation between blood flow and substrate delivery is, however, still a matter of debate and this is true for both glucose and oxygen (Barinaga, 1997; Buxton and Frank, 1997; Mintun et al, 2001; Paulson, 2002; Vafaee and Gjedde, 2000). The cerebral blood flow (CBF) is in the order of 0.57 ml/g per minute in the human gray matter under basal conditions (Clarke and Sokoloff, 1999), bringing 2.85 μmol/g per minute glucose to the brain vessel lumen (5 mmol/L blood glucose). At a CMRG of 0.30 μmol/g per minute, this yields a glucose extraction ratio of approximately 10% (Dirnagl, 1997; Madsen et al, 1995; Paulson, 2002). This contrasts with the much higher extraction ratio of 50% to 70% for oxygen (Dirnagl, 1997; Paulson, 2002). Glucose delivery to the neural tissue can theoretically be elevated by solely increasing the extraction ratio without any change in CBF, but for oxygen there is less extraction reserve and the CBF increase is needed (Paulson, 2002). On brain activation, the CBF increases in proportion to the CMRG, for example, up to 50% above baseline as reported by Fox et al (1988). An increased vascular glucose supply does not, however, automatically result in an increased delivery to the neural tissue: first, because an increased supply is, in view of the low extraction ratio, hardly expected to affect the local luminal glucose concentration and thus the driving force for glucose to enter the brain, and second, because the barrier transport may be close to becoming rate-limiting. There are theoretically three possibilities to modulate the movement of glucose over the barrier: changing the intrinsic properties of the GLUT-1 transporter by modifying its Vmax or Kt, changing the number of GLUT-1 carriers available in the barrier membrane for glucose transport, or changing the driving force for glucose movement over the barrier (Figure 4). The number of functional and accessible GLUT-1 carriers in the barrier membrane can be increased by inserting new transporter protein or by increasing the number of perfused capillaries in response to increased blood flow (Davson and Segal, 1996). Both result in an increased Tmax of transbarrier glucose transport because individual carrier proteins act in parallel to sum their Vmax.
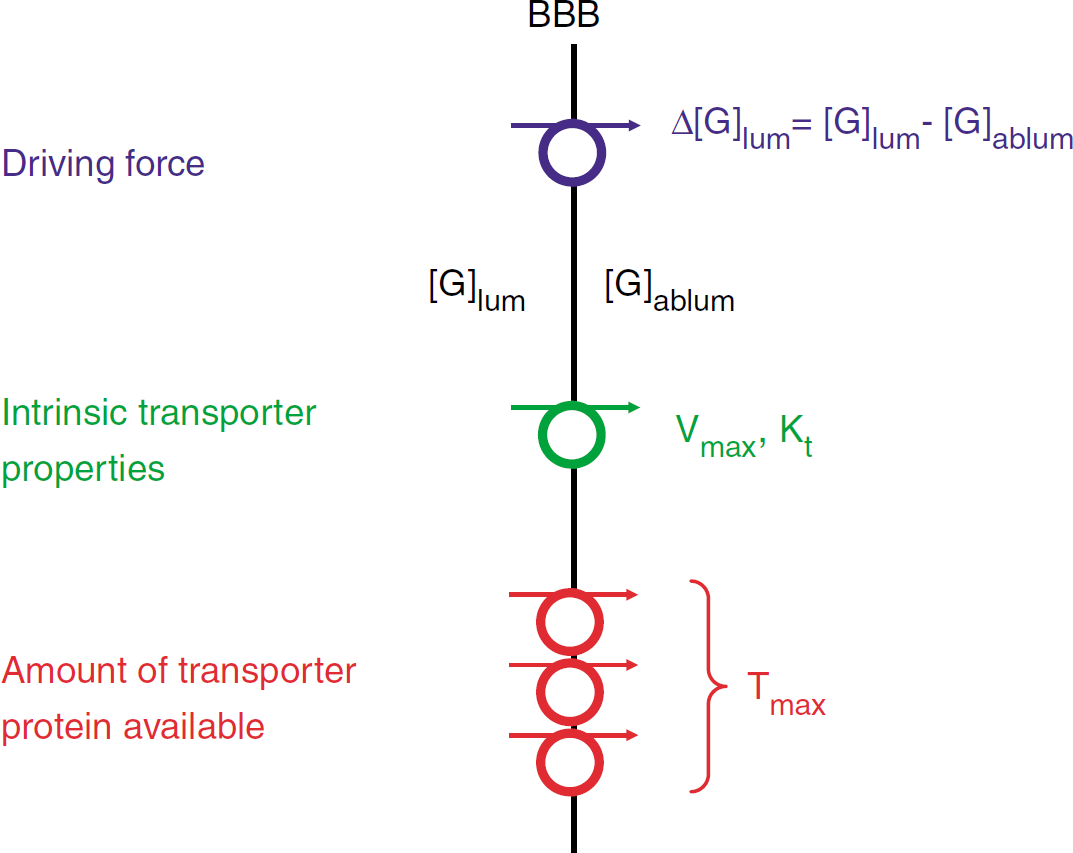
Glucose transport across the blood-brain barrier (BBB) can, in principle, be stimulated by increasing the glucose concentration gradient (Δ[G]; [G]lum is the luminal and [G]ablum the abluminal glucose concentration) over the barrier, thereby stimulating the driving force for glucose movement, by increasing the intrinsic activity of the GLUT-1 transporter through changes in Vmax or Kt, or by increasing the number of GLUT-1 carriers available for glucose transport thereby affecting Tmax. The number of functionally available GLUT-1 carriers in the barrier membrane can be increased either by inserting new transporter protein or by increasing the capillary surface area available for facilitated glucose entry.
The capillaries in the brain cortex all appear to receive at least some perfusion under resting conditions, making capillary recruitment (as observed in muscle) an unlikely option in the brain (Gobel et al, 1989; Kuschinsky and Paulson, 1992; Villringer et al, 1994). It is now accepted that neuronal activation triggers a transition of low-flow capillaries to high-flow capillaries, thereby causing a more homogeneous distribution in the flow pattern of the capillary bed (Kleinfeld et al, 1998; Vogel and Kuschinsky, 1996), a condition that has been described as functional recruitment (Akgoren and Lauritzen, 1999; Kuschinsky and Paulson, 1992; Paulson, 2002). Currently, there is no quantitative data available to estimate the impact of functional recruitment on the magnitude of the glucose transport over the barrier.
Glucose transport across the blood-brain barrier is generally interpreted in terms of the permeability-surface product (Davson and Segal, 1996) whereby the transport is modulated either by changes in the permeability or by changes in the capillary surface area available for facilitated glucose movement. Permeability 2 changes are the consequence of changes in the Tmax, Vmax, or Kt parameters whereas surface area changes are related to functional recruitment at the level of capillaries. The third possibility to affect blood-brain barrier glucose transport relates to the driving force and thus the glucose concentration gradient across the barrier. Glucose concentrations in the brain interstitium are indeed reported to decrease over 10% to 34% in response to activation (Chen et al (1993), Fellows et al (1992), Fray et al (1997), Hu and Wilson (1997), McNay et al (2000), McNay et al (2001), Merboldt et al (1992) and Silver and Erecinska (1994); Lowry et al (1998) reported a more extreme decrease over 52% with veratridine), thereby increasing the transbarrier concentration difference and thus the driving force for glucose entry into the brain interstitium. Substitution of a [G]ablum value of 0.8 mmol/L (corresponding to an average 20% decrease) in equation (2) increases TG from 0.37 (at 1 mmol/L) to approximately 0.42 μmol/g per minute, giving an estimated increase of approximately 14% above baseline. This effect is effectively a law of mass action effect whereby an increased glucose sink (metabolic degradation) stimulates the movement of the molecule over the barrier (Figure 3). We retain from these considerations that blood-brain barrier glucose transport can be affected at several levels, of which neurovascular coupling is only one of the possible adaptations that may be involved during brain activation.
Defining the Field for Neurobarrier Coupling
Neurobarrier coupling denotes adaptations in the properties of glucose transport across the blood-brain barrier after brain activation and thus implies changes that are not related to neurovascular coupling. In principle, neurobarrier coupling includes changes in Tmax due to increased GLUT-1 incorporation or increased Vmax, and alterations in Kt. Adjustments at the level of functional recruitment belong, in contrast, to the domain of neurovascular coupling. Changes in the driving force for glucose movement over the barrier could in principle be incorporated under the term neurobarrier coupling, but because these changes are the direct result of increased metabolism and glucose shifts obeying the law of mass action, we suggest the sorting of this aspect under neurometabolic coupling (Table 2). The time scale of neurobarrier coupling is expected to be in the order of the time scale for neurovascular coupling, that is, in the order of sec after activation (Malonek et al, 1997). However, because there is a limited glycogen stock available in the astrocytes (estimates of the size of this stock can be found in Brown et al, 2004; Gruetter, 2003), the time course may be somewhat extended if the increased glucose transport is used to back up the glycogen stores that have been mobilized in response to increased metabolic demand (Fillenz et al, 1999; Shulman et al, 2001; Swanson, 1992; Swanson et al, 1992). Evidence for an increased GLUT-1 activity on activation has recently become available from the work of Cornford et al (2000), who demonstrated that seizure induction in rats triggers an acute increase, within 3 min, of the Tmax of blood-brain barrier glucose transport in the forebrain cortex. This effect was not related to an increased capillary surface area for facilitated glucose transport (based on measurements of the insulin distribution volume) and is thus probably the result of either an increase in the Michaelis-Menten parameters of the GLUT-1 protein or a stimulated GLUT-1 incorporation into the barrier membrane. Earlier studies from Cremer et al (1983) had already demonstrated increased Tmax values with seizures, but the time course of these changes was not investigated. A study of Gronlund et al (1996) demonstrated increased GLUT-1 expression in response to chronic seizures that peaked after a delay of 3 days; these authors also described increased expression of the GLUT-3 transporter that peaked after 8 hours. By contrast, the work of Cornford et al (2000) demonstrates acute adaptations within min and is suggestive of the involvement of a signal acting at this time scale. The Cornford et al (2000) study is thus an example of neurobarrier coupling, although that brain activation was brought about by a pathological stimulus. Further investigations will be needed to determine the involvement of neurobarrier coupling under physiological levels of brain activation.
Neurobarrier coupling in relation to neurovascular and neurometabolic coupling
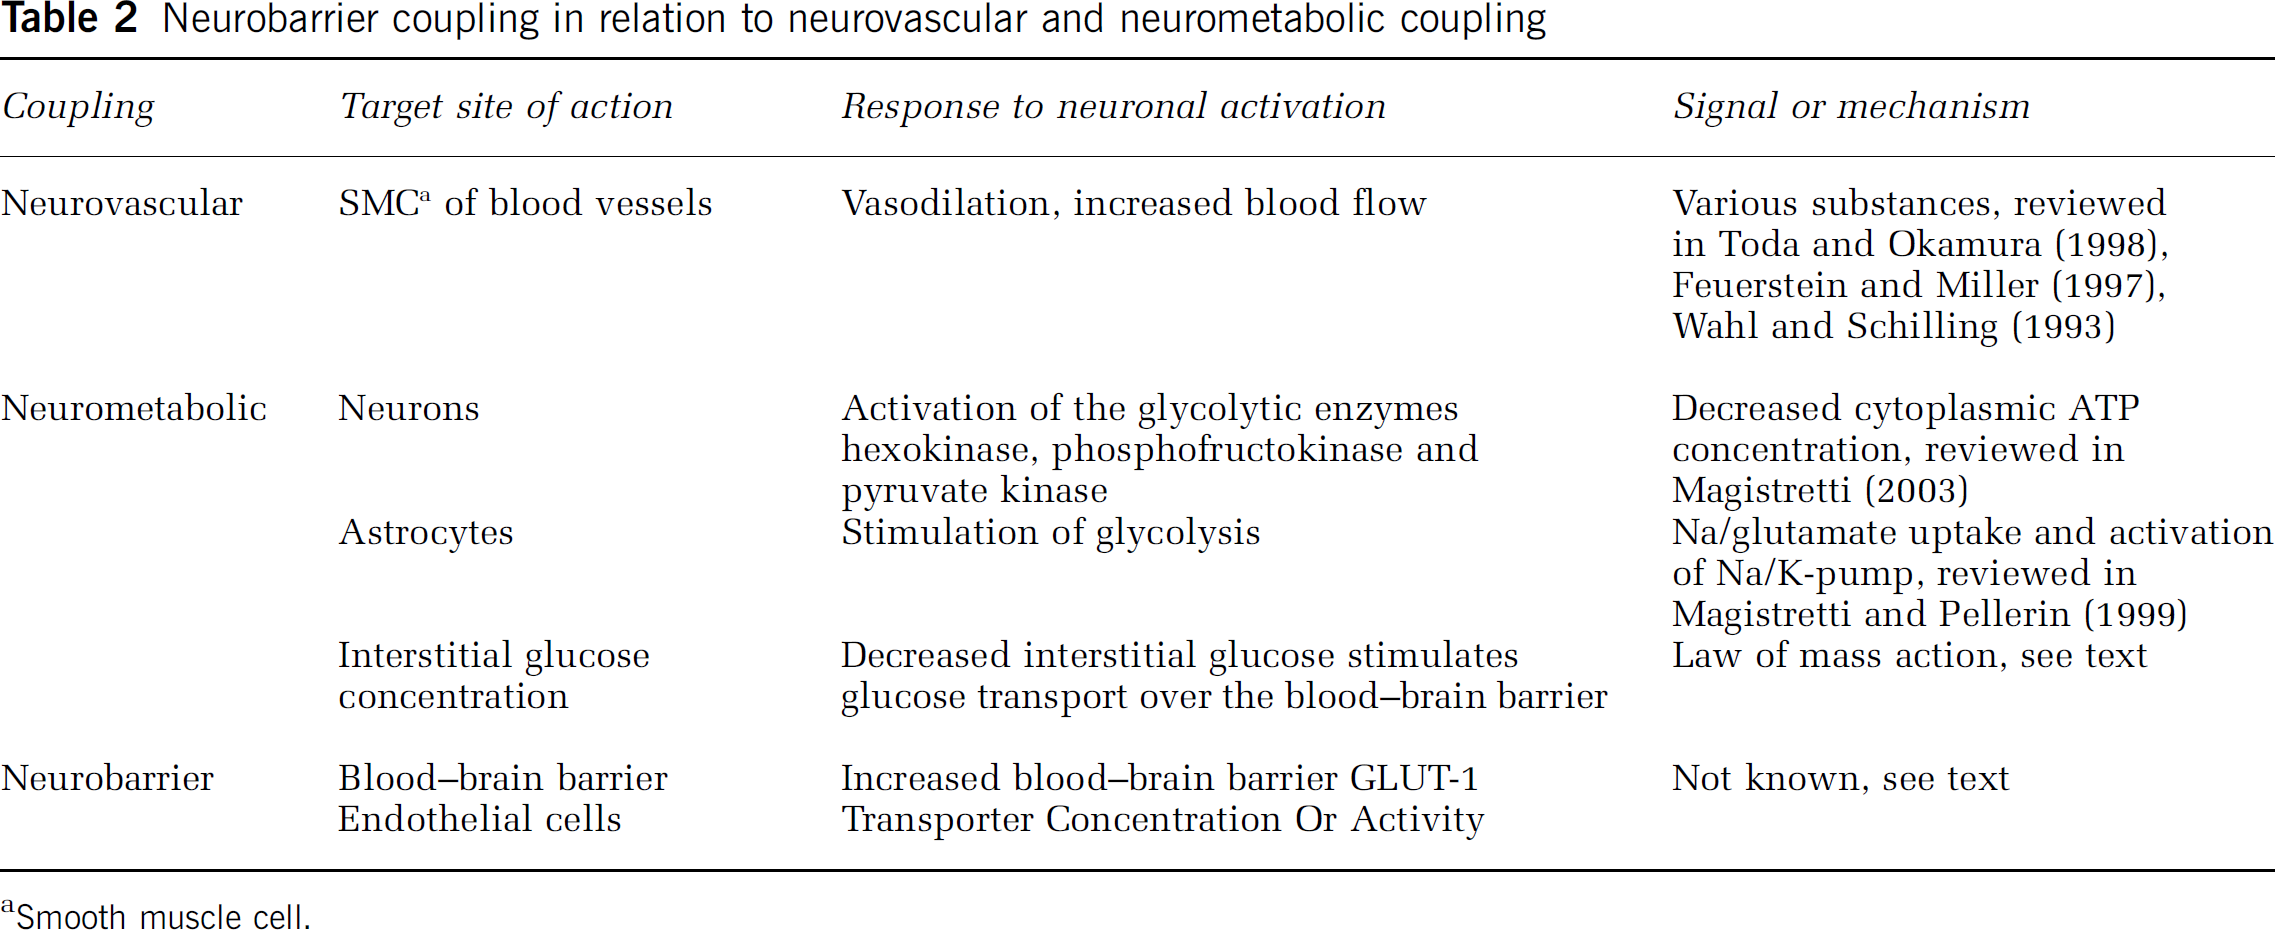
aSmooth muscle cell.
Signals Influencing GLUT-1 Activity or Incorporation
Neurobarrier coupling as demonstrated in the Cornford et al (2000) study probably involves a signal that is released from the neural tissue and acts at the level of blood-brain barrier endothelial cells to trigger changes in GLUT-1 activity or incorporation. Increased GLUT-1 incorporation into the endothelial plasma membranes can be accomplished by increased transporter expression, by increased stability of the GLUT-1 mRNA, or by translocation of the transporter from a preexisting intracellular pool. Blood-brain barrier endothelial cells contain a large intracellular GLUT-1 pool of approximately 40% of the total cellular content, with the other 60% being symmetrically (Simpson et al, 2001) or asymmetrically (luminal to abluminal ratio of approximately 1:4; Dobrogowska and Vorbrodt, 1999; Farrell and Pardridge, 1991) distributed over the luminal and abluminal plasma membranes. GLUT-1 redistribution towards the plasma membrane has previously been suggested as a possible scenario to rapidly increase glucose transport in response to neuronal activation (Drewes, 1998). Modulation of the GLUT-1-mediated transport, either by effects on the intrinsic transporter activity or its incorporation into plasma membranes, can be brought about by numerous and diverse substances including growth factors, mitogens, hormones, neurotransmitters and intracellular messengers and also by pathologic stimuli involving cell stress, metabolic inhibition, hypoxia, and ischemia. Table 3 summarizes the modulatory, mostly stimulating, effect of various of these substances or conditions and specifies the mechanism involved, that is, through alterations in protein expression, mRNA stability, translocation of the transporter, or changes in the intrinsic transporter activity. The most prevalent mechanism is increased expression, which acts at a time scale of hours, but rapid effects occurring within min or even sec have also been reported and are often associated with subsequent changes in expression (Thomson and Gould, 1997).
Overview of modulatory influences on the GLUT-1 glucose transporter
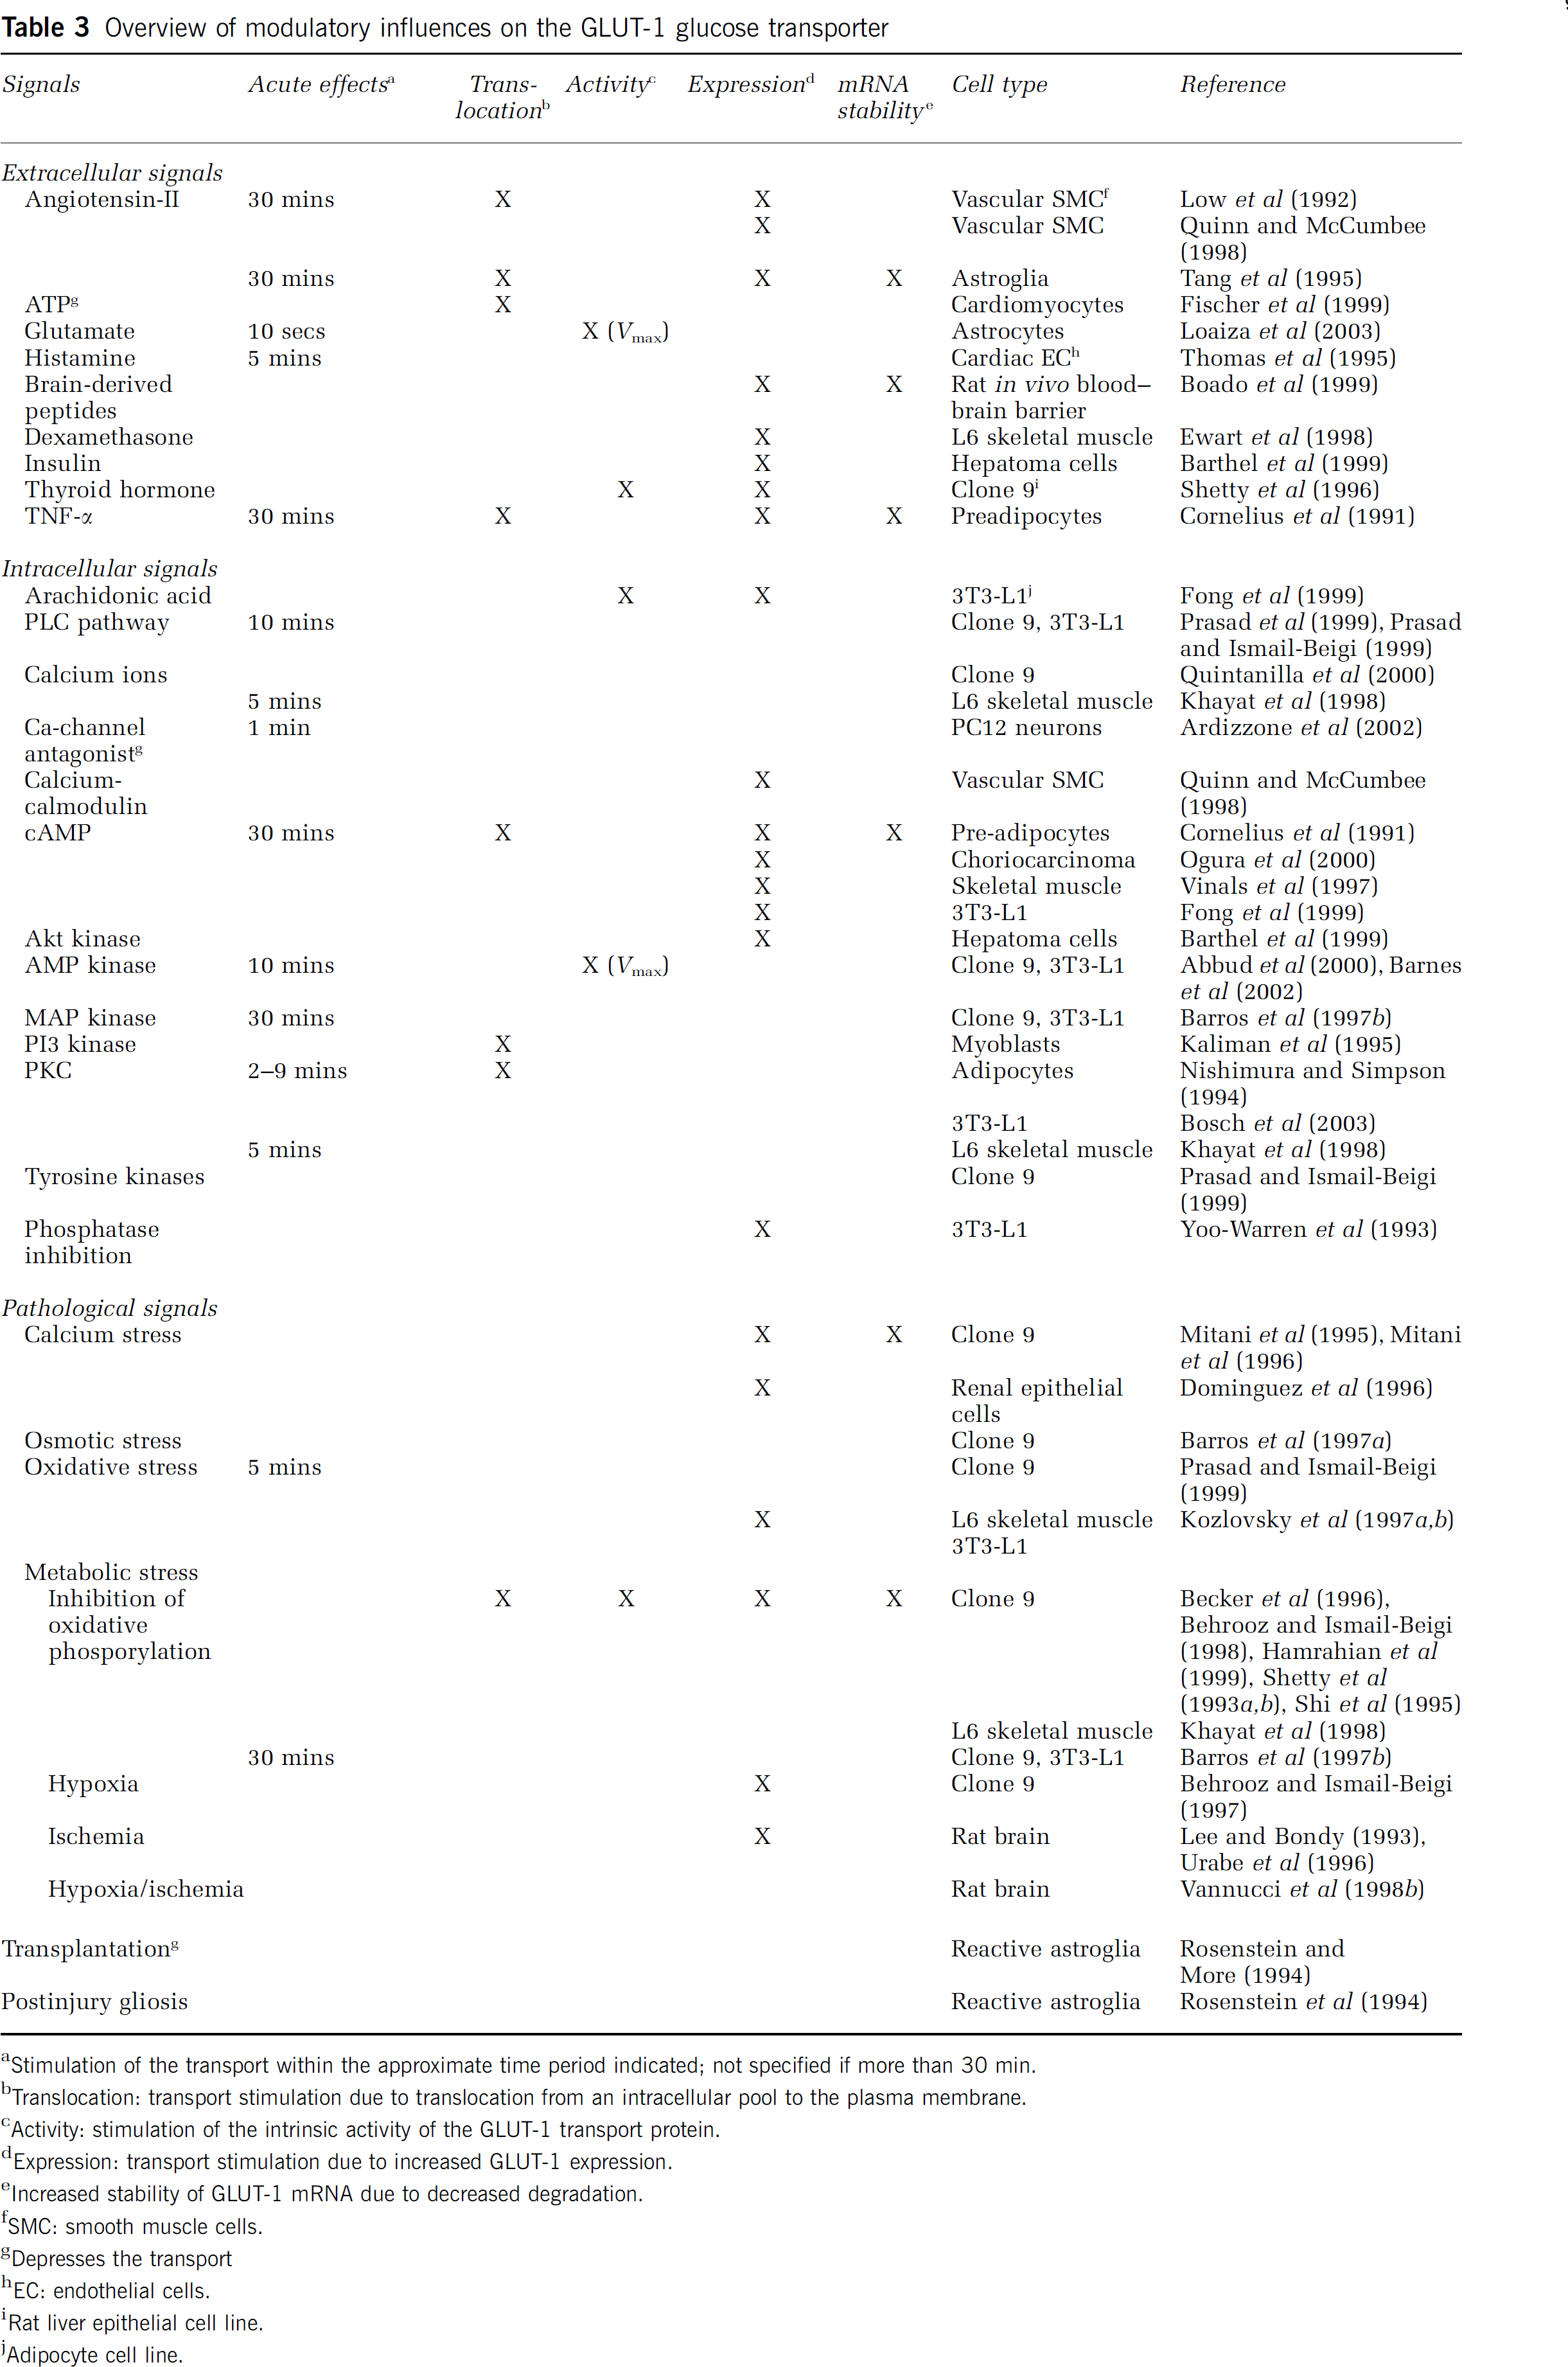
aStimulation of the transport within the approximate time period indicated; not specified if more than 30 min.
bTranslocation: transport stimulation due to translocation from an intracellular pool to the plasma membrane.
cActivity: stimulation of the intrinsic activity of the GLUT-1 transport protein.
dExpression: transport stimulation due to increased GLUT-1 expression.
eIncreased stability of GLUT-1 mRNA due to decreased degradation.
fSMC: smooth muscle cells.
gDepresses the transport
hEC: endothelial cells.
iRat liver epithelial cell line.
jAdipocyte cell line.
Most relevant in the context of neurobarrier coupling are the rapid effects, at a time scale of sec to min, of angiotensin-II, glutamate, histamine, and of some of the intracellular signals like PLC, cAMP, calcium, and PKC. The role of the PLC pathway has been documented in several reports (Prasad et al, 1999; Prasad and Ismail-Beigi, 1999) with downstream cytoplasmic calcium changes playing a permissive role in GLUT-1 activation (Khayat et al, 1998; Quintanilla et al, 2000) and PKC either stimulating (Khayat et al, 1998; Nishimura and Simpson, 1994; Tang et al, 1995) or inhibiting GLUT-1-mediated glucose transport (Bosch et al, 2003). Previous work of our group has demonstrated astrocyte-to-endothelial cell communication of inositol trisphosphate (InsP3)-triggered calcium signals and we have put forward the hypothesis that the PLC pathway, at the level of InsP3, calcium, diacyl glycerol, or PKC, may be an endothelial signal involved in neurobarrier coupling (Braet et al, 2001; Leybaert et al, 1998). On the same lines, Simard et al (2003) have recently speculated on astrocyte-endothelium calcium signal communication as a message influencing metabolic trafficking over the blood-brain barrier.
Calcium changes brought about by calcium influx induced by ionophores are also known to trigger increased GLUT-1 expression, but because the applied exposure times are in the order of hours these effects are likely to be mediated by cellular calcium stress (Dominguez et al, 1996; Mitani et al, 1995). Calcium ionophore exposure also triggers rapid changes (within 2 min) in GLUT-1 mRNA indicating that this response is not solely related to calcium stress (Mitani et al, 1996). The most rapid effect has been reported for glutamate, which in astrocytes triggers an increase of GLUT-1-mediated transport within several sec (Loaiza et al, 2003). Glucose transport was elegantly measured in this study by confocal imaging of the cellular uptake of fluorescent glucose derivatives, allowing the resolution of glucose transport dynamics at a high temporal definition. The specificity of these fluorescent reporters is, however, not fully established and the glutamate concentrations used were in the high range (0.5 mmol/L). The importance of this work is that it suggests that the activity of glutamatergic neurons, and the consequent synaptic spillover of glutamate (Dzubay and Jahr, 1999), may stimulate the activity of glucose transport across the astrocytic plasma membrane, thereby coupling neuronal activity to astrocytic glucose uptake. Coupling at this level is, however, expected to be less important, because there is little evidence for a glucose concentration gradient over the astrocytic (and neuronal) plasma membranes (Gjedde and Diemer, 1983; Gruetter et al, 1996; Pfeuffer et al, 2000; Silver and Erecinska, 1994). It remains to be determined whether glutamate also affects glucose transporter activity at the level of blood-brain barrier endothelial cells. Blood-brain barrier endothelial cells appear to express glutamate receptors but there is some controversy about whether these receptors couple to functional responses (Krizbai et al, 1998; Morley et al, 1998; Parfenova et al, 2003). Next to glutamate, other transmitter substances with somewhat slower effects on glucose transport should also be considered. Histamine, acting with a time scale of min, is in principle too slow to accommodate an instantaneous change in glucose flux. A delayed elevation of the glucose transport over several min may however be useful to back up depleted astrocytic glycogen stores after their mobilization in response to increased metabolic demands (Swanson, 1992; Swanson et al, 1992; Gruetter, 2003). This is an especially interesting possibility because monoamine messengers like histamine, noradrenaline, and serotonin are known to have glycogenolytic actions in the brain (Fillenz et al, 1999; Magistretti, 2003; Magistretti et al, 1993; Medrano et al, 1992). Preliminary work from our group indicates that histamine stimulates the uptake of glucose into endothelial cells. In addition to histamine, ATP also appeared to stimulate endothelial glucose uptake (Braet and Leybaert, 2000a, b ). However, Simard et al (2003) have recently reported that there is no immunocytochemical evidence for P2Y2 and P2Y4 ATP receptors in endothelia of acutely isolated rat brain slices, making ATP a less likely candidate messenger. Further studies focusing on the effect of various candidate extra- and intra cellular messengers on endothelial glucose uptake and transendothelial transport at a second-to-minute time scale will be needed to determine the role of various other candidate signaling molecules. In situ confocal and multiphoton imaging should be the standard procedure for such investigations to come to valid and realistic conclusions. Finally, it should be taken into account that only small changes in transport activity will be needed to prevent blood-brain barrier glucose transport from becoming rate-limiting on neuronal activation.
Concluding Remarks
In conclusion, glucose transport across the blood-brain barrier is not rate-limiting under basal conditions but is expected to become so after activation. Glucose transport thus needs to be increased on activation, an increase that can be brought about by increased blood flow and consequent functional (capillary) recruitment (through neurovascular coupling), by an increased driving force for facilitated glucose transport (a consequence of increased glucose consumption brought about by neurometabolic coupling), and possibly also by changes in the transport parameters of blood-brain barrier glucose transport (through neurobarrier coupling). Arguments for a coupling effect at the level of the blood-brain barrier are based on experimentally observed rapid changes in the Michaelis-Menten parameters of glucose transport in response to seizure induction, on the fact that a large variety of intra- and extracellular messengers modulate GLUT-1-mediated transport, and on the notion that astrocyte-to-endothelial cell communication may constitute the pathway through which neuronal activity exerts its effects on the blood-brain barrier. We presented the case for neurobarrier coupling based on glucose transport and metabolism. The barrier, however, controls the passage of many other substances including monocarboxylic acid fuels (lactate, acetate, pyruvate, ketone bodies), precursors of amine neurotransmitters, ions (sodium, potassum, chloride) and water, all of which can be speculated to be adapted in function of neuronal activity. Further work will be needed to document the case for neurobarrier coupling in the in vivo setting and to delineate candidate messengers in in vitro assays and experiments, so as to establish whether it is really a partner of neurovascular and neurometabolic coupling. Looking from two different angles to the neurovascular unit, with molecular imaging at the microscopic level and functional magnetic resonance imaging to look at the greater picture will hopefully bring us a step closer.
Footnotes
Acknowledgements
This manuscript is dedicated to I Leusen, Professor Emeritus of Physiology at Ghent University and to G Dupont, Professor at the Université Libre de Bruxelles, in an effort to describe some recently suggested modeling ideas in a more precise manner.
1
This ratio should not to be confused with Tmax/CMRG, which attains higher values in the order of 3 (Choi et al, 2001; de Graaf et al, 2001).
2
Permeability is used in this context in a rather broad sense and not in its strict meaning of membrane property equaling the diffusion constant divided by the membrane thickness. Permeability does not appear as such in the Michaelis-Menten equation but the diffusion constant is part of a term expressing Vmax or Tmax.