
Abstract
The development of neuroimaging methods to characterize flow-metabolism coupling is crucial for understanding mechanisms that subserve oxygen delivery. Functional magnetic resonance imaging (fMRI) using blood-oxygenation-level-dependent (BOLD) contrast reflects composite changes in cerebral blood volume (CBV), cerebral blood flow (CBF), and the cerebral metabolic rate of oxygen consumption (CMRO2). However, it is difficult to separate these parameters from the composite BOLD signal, thereby hampering MR-based flow-metabolism coupling studies. Here, a novel, noninvasive CBV-weighted MRI approach (VASO-FLAIR with 3D GRASE (GRadient-And-Spin-Echo)) is used in conjunction with CBF-weighted and BOLD fMRI in healthy volunteers (
Introduction
Understanding the relationship between neuronal activity, hemodynamic response, and energy metabolism is central to relating functional neuroimaging findings to underlying neuronal processing. The majority of functional neuroimaging is conducted noninvasively using blood-oxygenation-level-dependent (BOLD) magnetic resonance imaging (MRI) (Ogawa et al, 1990). Although the BOLD signal is a surrogate marker of neuronal activity through composite adjustments in cerebral blood flow (CBF), cerebral blood volume (CBV), and the cerebral metabolic rate of oxygen consumption (CMRO2) (Buxton et al, 1998; van Zijl et al, 1998), it is unclear how each of these components influences the BOLD response and to what extent the BOLD effect reflects neuronal activity.
It is possible to better understand the processes that drive BOLD contrast by separately measuring CBF and CBV changes, and using these measures together with the BOLD response to estimate CMRO2 (Lu et al, 2004b). In this way, the temporal dynamics of individual hemodynamic parameters can be investigated and the relationship between hemodynamic and metabolic response assessed. However, such an approach requires accurate CBF and CBV measurements over a large spatial volume, in addition to a model relating BOLD signal changes to CBF, CBV, and CMRO2. The emergence of novel MRI approaches such as CBF-weighted (CBFw) arterial spin labeling (ASL: (Williams et al, 1992)) and CBV-weighted (CBVw) vascular-space-occupancy (VASO: (Lu et al, 2003)) has made this approach, in principle, possible.
Here, using a novel 3D GRadient-And-Spin-Echo (GRASE) acquisition, we propose a whole-brain MRI protocol for measuring CBF, CBV, and BOLD reactivity in sequence without the use of intravascular contrast agents. The CBVw, CBFw, and BOLD dynamics in response to simultaneous visual stimulation (8 Hz flashing checkerboard) and motor stimulation (1 Hz unilateral joystick movement) are investigated and specific CBF, CBV, and CMRO2 contributions to BOLD contrast reported. The proposed technique should expand on the available approaches for studying neurovascular and flow-metabolism coupling.
Materials and methods
Arterial-Spin-Labeling and Vascular-Space-Occupancy Magnetic Resonance Imaging
CBFw ASL has emerged as a technique for generating quantitative CBF measurements without the use of contrast agents (Williams et al, 1992). In ASL, blood water outside an imaging region is magnetically tagged with a radiofrequency pulse, after which blood water flows into the imaging region, exchanges with tissue water, and a ‘tag’ image is acquired. A CBFw image is generated by subtracting the above tag image from a ‘control’ image (no blood water tagged). Whole-brain ASL has been difficult because of a timing discrepancy in the so-called blood water ‘inversion time’ (TI), defined as the time between the labeling of the inflowing blood water and the acquisition of the image. As different slices are acquired at separate time points in standard 2D MRI acquisition routines, each slice corresponds to a different TI, complicating quantification. Recently, it was shown that whole-brain ASL measurements can be obtained by following the ASL blood labeling preparation with a 3D GRASE readout (Fernandez-Seara et al, 2005; Gunther et al, 2005). In 3D GRASE, a single excitation pulse is used, followed by a sub-second acquisition of the entire 3D volume simultaneously. Therefore, 3D GRASE ASL maintains an equal TI for all slices.
Vascular-space-occupancy has been proposed as a method for obtaining CBVw contrast without the use of a contrast agent (Lu et al, 2003). In VASO, the intravascular blood signal is nulled and the resulting image is derived from extravascular tissue. Vasodilatory CBV changes associated with increased neuronal activity are inferred from reductions in the detectable tissue signal. Whole-brain coverage with VASO remains problematic (Lu et al, 2004c; Scouten and Constable, 2007) as image acquisition in VASO must be performed at the precise null point of blood water, which is not possible in 2D routines that excite different imaging slices at different times. Therefore, this shortcoming is similar to the above-mentioned TI problem in ASL. As the 3D GRASE readout uses a single excitation pulse for the entire imaging volume, it may be possible to append the 3D GRASE readout to the VASO blood nulling preparation.
Quantification of Cerebral Blood Volume from Vascular-Space-Occupancy-Based Signal Changes
When BOLD, ASL-measured CBF, and VASO-measured CBV changes are obtained, it is possible to estimate CMRO2. This approach has been largely outlined in the literature (Gu et al, 2006; Lu et al, 2004b); the salient aspects are reproduced here.
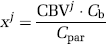
CBV change between baseline and an activated state can be estimated from the blood-nulled VASO signal change (Lu et al, 2003), or from VASO-Fluid Attenuation Inversion Recovery (VASO-FLAIR) images (blood water and CSF water both nulled simultaneously after double inversion) (Donahue et al, 2006). The VASO (V) or VASO-FLAIR (VF) spin-echo signal for an activated (act) or baseline (base) state can be written:
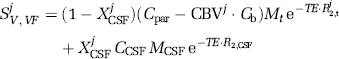
Here,
We use a VASO-FLAIR preparation for simultaneous blood water and CSF nulling, as this approach is found (see Results) to have higher contrast-to-noise ratio (CNR) than conventional VASO. One important advantage of the VASO-FLAIR preparation is that CSF magnetization is nulled (

The signal change between baseline and activation can therefore be written:
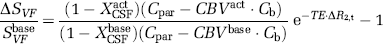
It is then possible to solve explicitly for

As intravascular blood water is nulled in VASO-FLAIR experiments, only extravascular BOLD effects may cause a change in
Cerebral Metabolic Rate of Oxygen Consumption and Oxygen Extraction Fraction Quantification from Blood-Oxygenation-Level-Dependent, Vascular-Space-Occupancy, and Arterial Spin Labeling Signal Changes
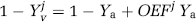
A parenchymal voxel can be divided into a tissue (
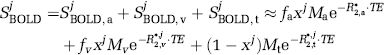
Assuming a healthy
Using Equation 5, the BOLD signal change (ΔSBOLD/SBOLDbase) between baseline and an activated state can be written explicitly:

where Δx=(
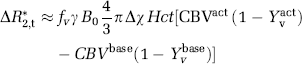
Here, γ=42.58 MHz/T is the water proton gyromagnetic ratio, B0=3.0T is the field strength, Δχ=0.3 ppm (Zhao et al, 2007) is the susceptibility difference between fully oxygenated and fully deoxygenated blood, Hct≈0.37 is the approximate hematocrit in the microvasculature (Zhao et al, 2007), and
Therefore, once
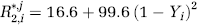
This calculated OEF can be written in terms of the CMRO2 and CBF according to:
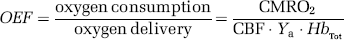
where
Therefore, knowledge of the OEF change (ΔOEF/OEFbase) used in conjunction with the ASL-measured ΔCBF/CBFbase can be used to calculate ΔCMRO2/CMRO2base.
Experiment
All subjects (
Gradient echo BOLD contrast cannot be isolated with the 3D GRASE imaging module. Therefore, an EPI module was used for BOLD measurements. In VASO, a single inversion pulse was used to null blood water (Lu et al, 2003), whereas in VASO-FLAIR a second inversion pulse was added to null blood water and CSF water simultaneously (Donahue et al, 2006). Note that with VASO-FLAIR, a TR≥5 s is required to maintain an adequate signal-to-noise ratio (SNR), as steady-state tissue magnetization is small (∼12% of M0) at the time of excitation. Therefore, a long TR=5 s VASO-FLAIR sequence (double inversion) provides a similar residual tissue magnetization as a short TR=2 to 3 s VASO (single inversion) experiment. Common scan parameters were TE=40 ms, bandwidth=2004 Hz/pixel, FOV=240 × 240 mm, imaging matrix=64 × 64, 22 slices, slice thickness=3.8 mm, spatial resolution=3.8 × 3.8 × 3.8 mm3. Sequence-specific scan parameters were BOLD 2D EPI: TR=3000 ms; ASL 3D GRASE: pulsed ASL with background suppression, TR/TI=2500/1600; VASO 3D GRASE: TR/TI=5000/1054 ms; VASO-FLAIR 3D GRASE: TR/TI1/TI2=5000/2256/737 ms. TI for VASO and VASO-FLAIR was chosen assuming a blood T1=1624 ms. It is well known that blood T1 will vary with oxygenation and Hct (Lu et al, 2004a). A recent study found that the T1 variation over a Hct range of 0.37 to 0.42 and an oxygenation range of 0.69 to 0.92 produced approximately a 10% variation in blood T1 and 8% variation in TI choice at TR=5 s, and led to no statistical difference in the VASO-quantified CBV change (Donahue et al, 2009b). Therefore, to be consistent with previous VASO studies, we have used a blood T1=1624 ms.
The functional paradigm consisted of a 60s/30 s off/on flashing blue-yellow checkerboard (
Post-Processing
Data were corrected for motion and baseline drift. Spatial resolution and slice orientation were matched across scans; BOLD images (2D EPI) were co-registered and warped to the 3D GRASE images using FSL routines (Jenkinson and Smith, 2001). Subsequently, time courses in voxels meeting activation from a statistical
For CMRO2 quantification, CBF, CBV, and BOLD changes were recorded for all voxels meeting the activation criteria in the visual or motor cortex for each volunteer, and CMRO2 was calculated on a subject-by-subject basis.
Results
Experiment
Figure 1 shows representative activation maps for CBVw VASO (a) and CBVw VASO-FLAIR (b) using the whole-brain 3D GRASE acquisition. VASO-FLAIR activation was found to be well localized to the visual and motor cortex, whereas VASO activation was less specific. More activated voxels were found using VASO-FLAIR (2193±461) than VASO (1616±272); however, this finding was not statistically significant (
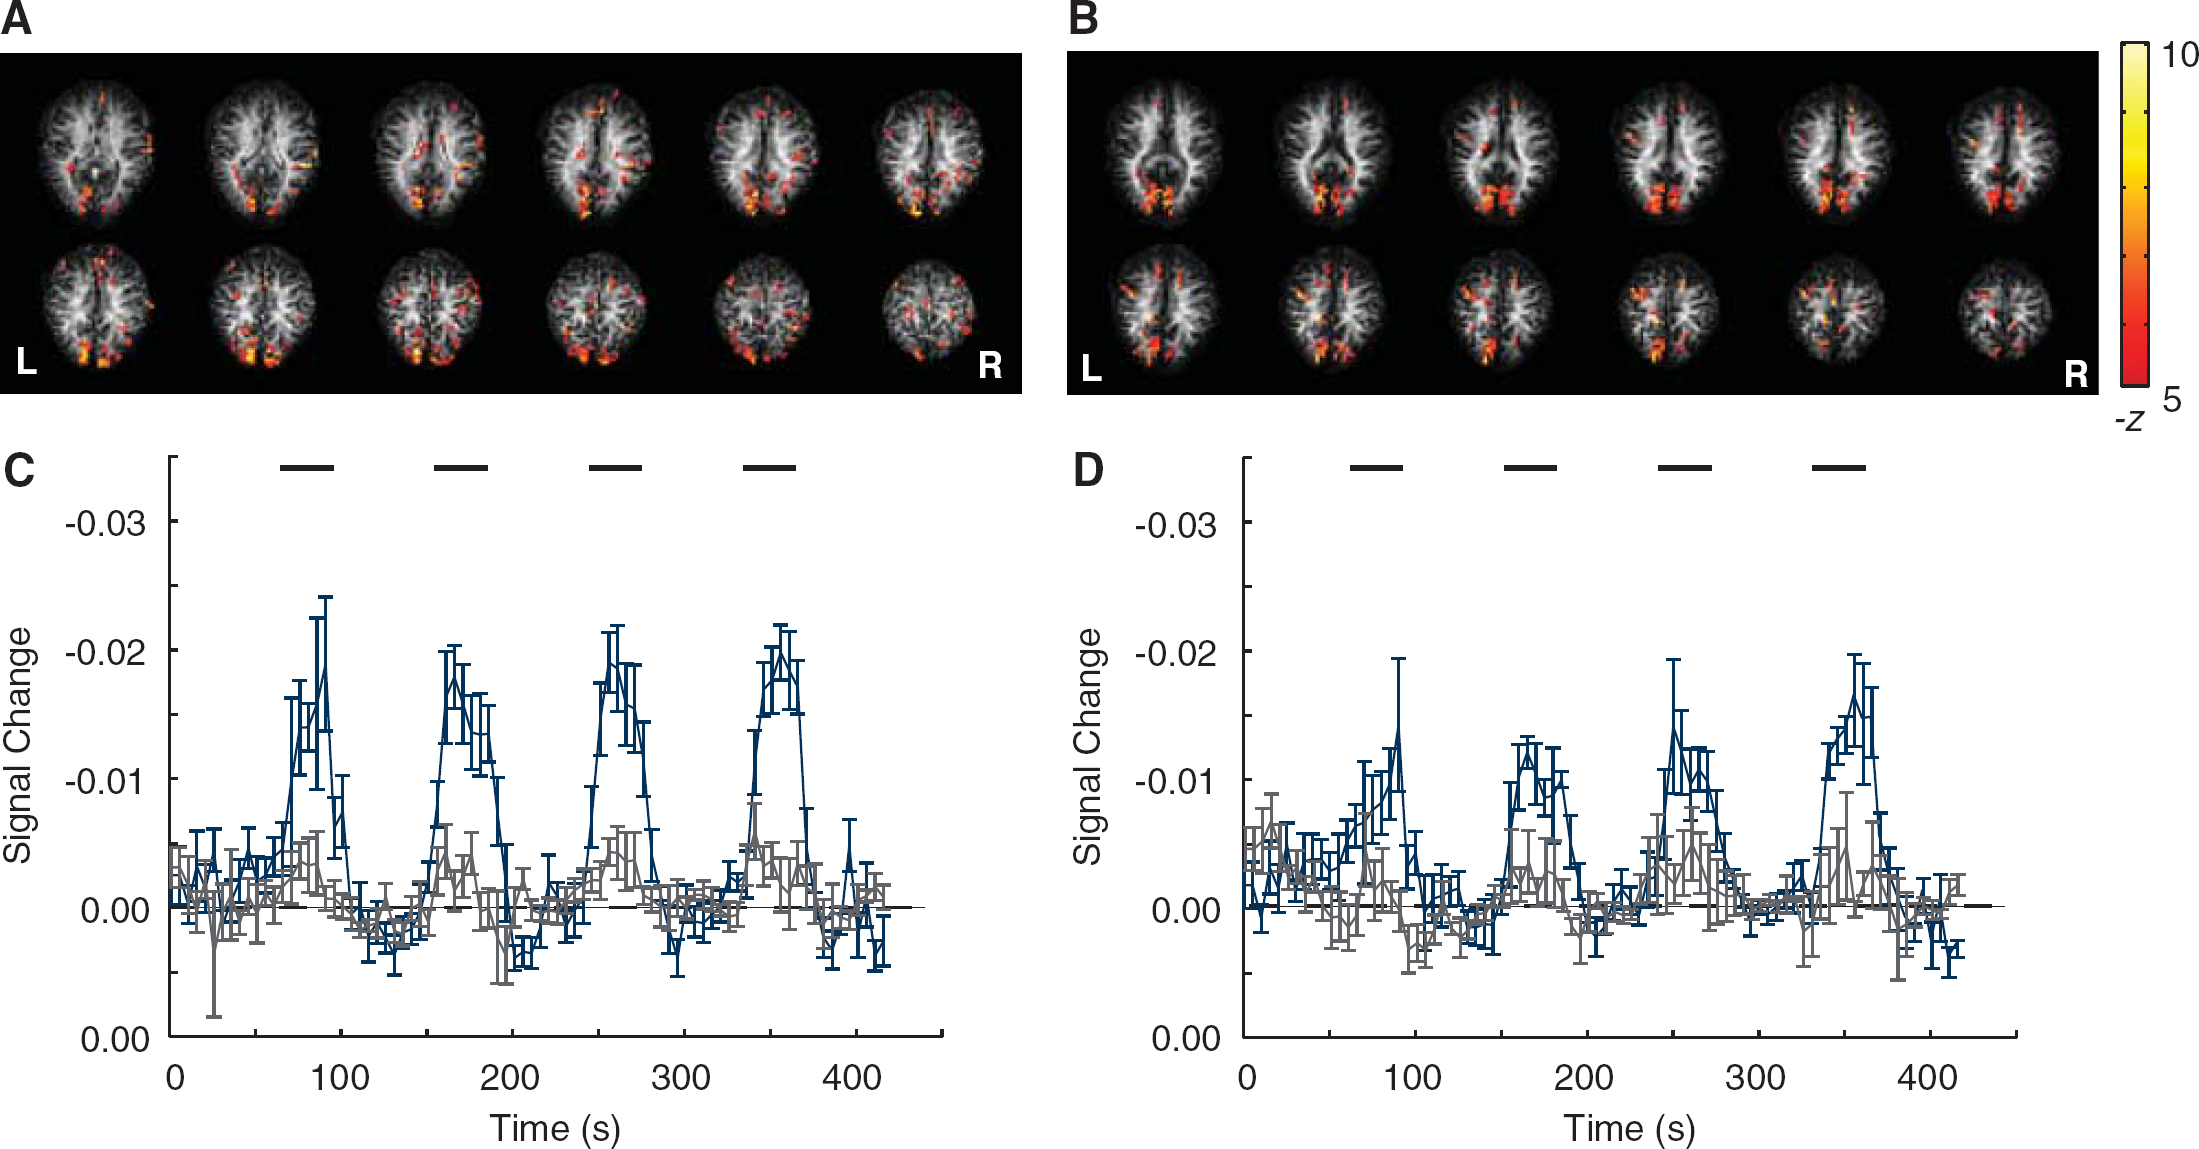
Representative VASO 3D GRASE (
Figure 2 shows representative BOLD (a), CBFw ASL (b), CBVw VASO-FLAIR (c), and overlapping voxel (d) activation maps for a representative subject (central 12 slices shown). Note that BOLD, CBFw, and CBVw maps show good localization to the visual cortex and left motor cortex as expected for the task. Corresponding visual and motor time courses were calculated for the subgroup of voxels meeting the activation criteria in all three scans (Figure 2D). The BOLD (Figure 2E), CBVw (Figure 2F), and CBFw (Figure 2G) responses are consistently smaller in the motor cortex compared with the visual cortex (BOLD:
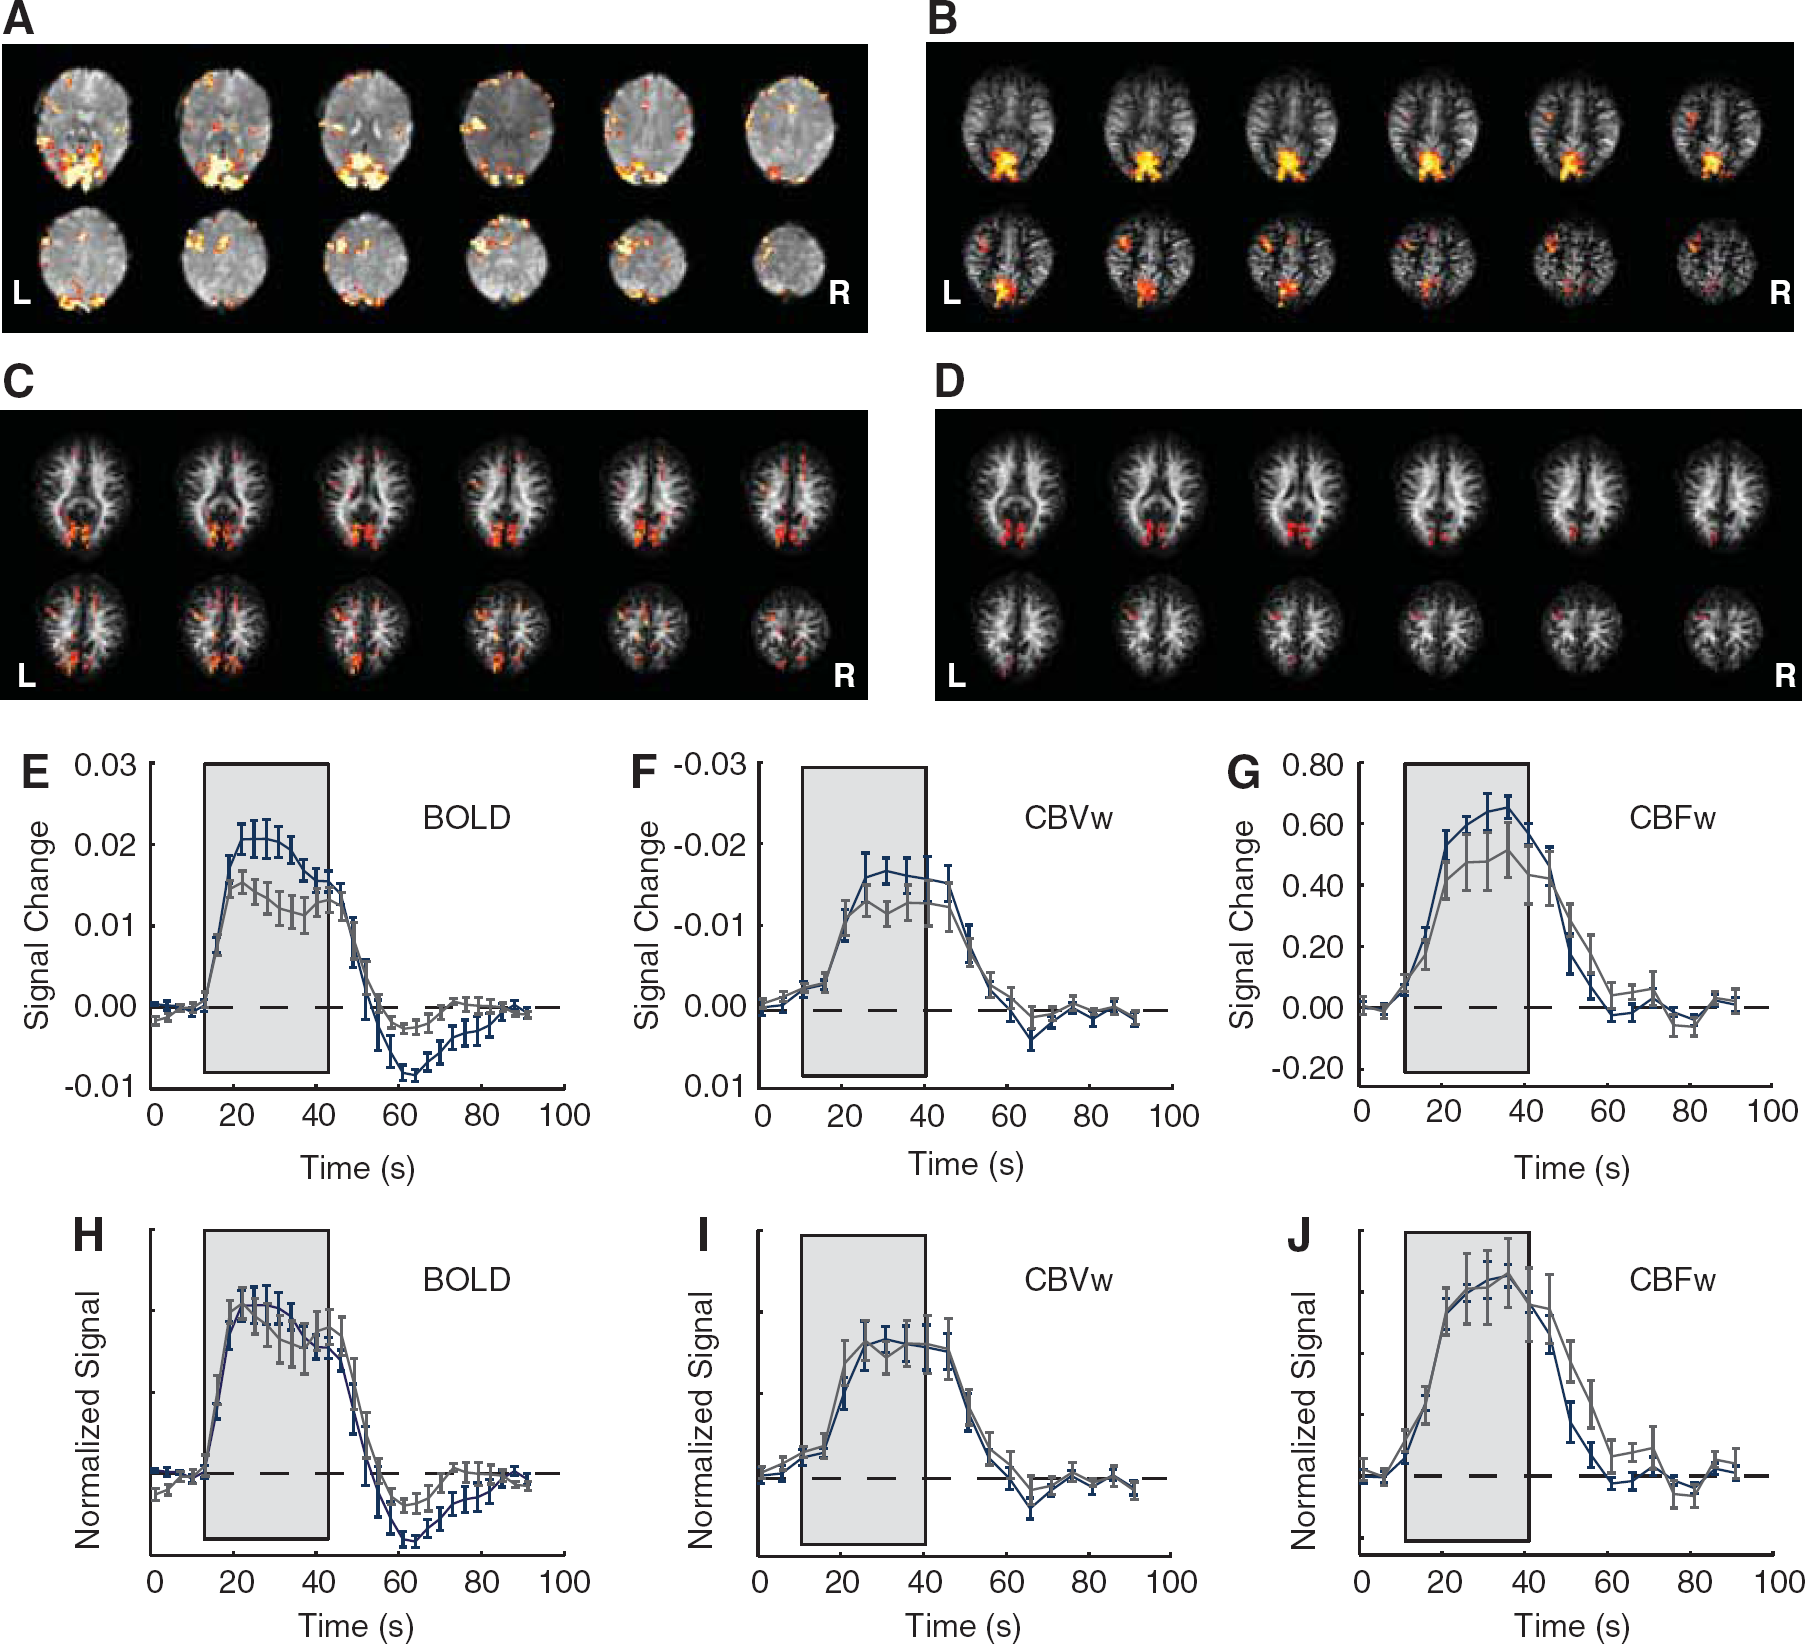
Representative BOLD (
Table 1 shows the SNR, CNR, and signal changes for each scan. In addition,
SNR, CNR, and signal changes in multi-modal fMRI
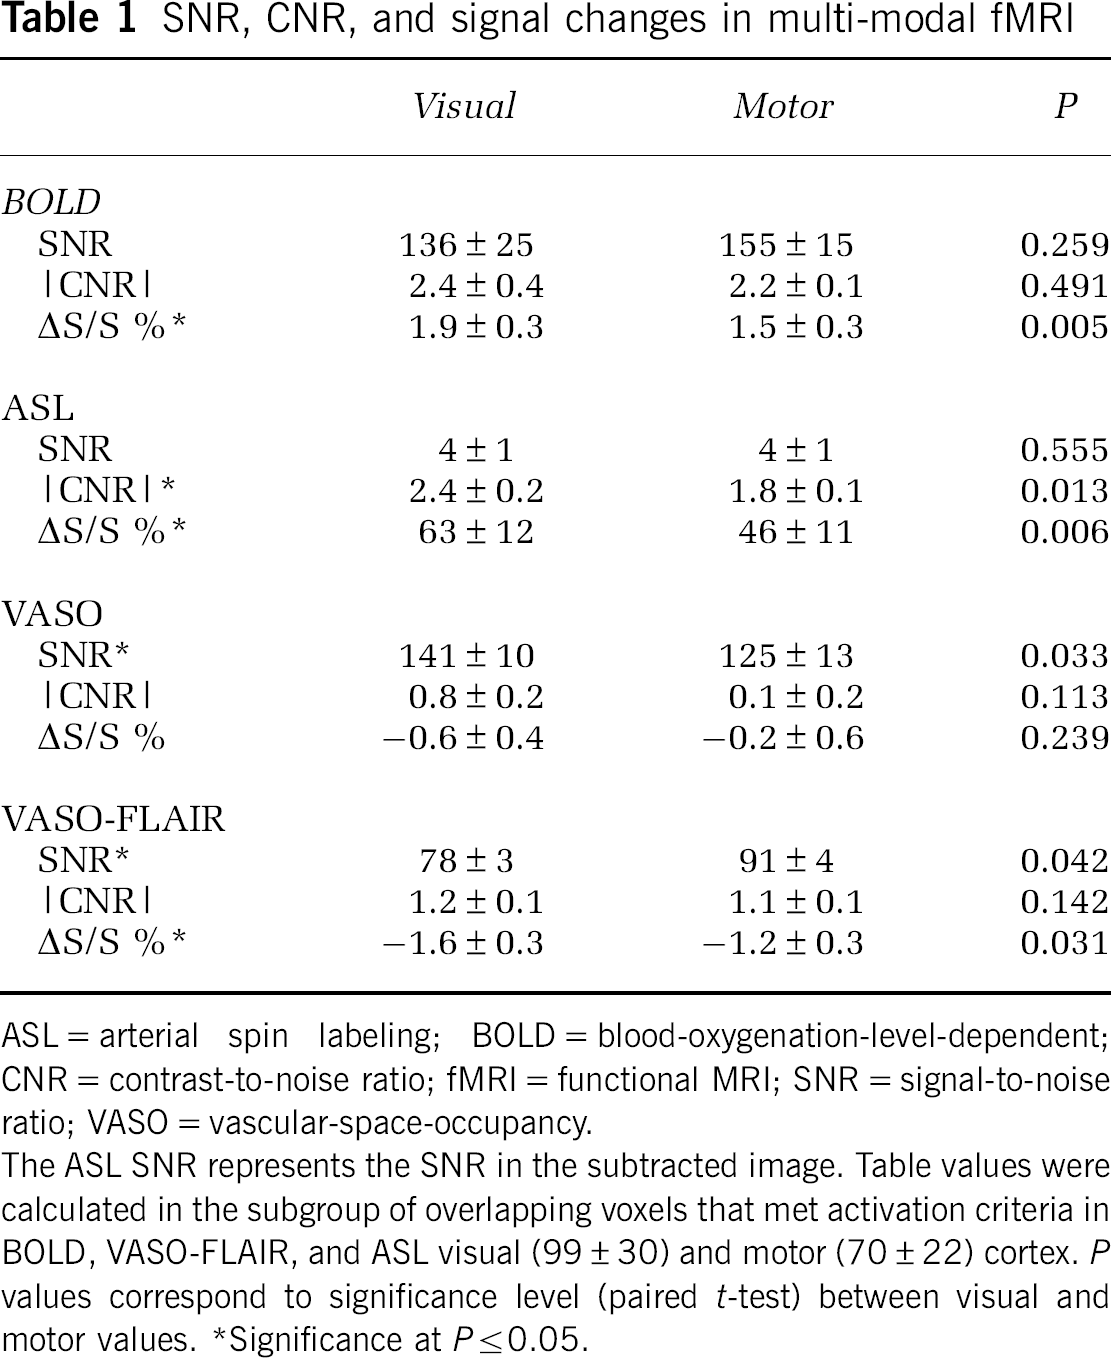
ASL=arterial spin labeling; BOLD=blood-oxygenation-level-dependent; CNR=contrast-to-noise ratio; fMRI=functional MRI; SNR=signal-to-noise ratio; VASO=vascular-space-occupancy.
The ASL SNR represents the SNR in the subtracted image. Table values were calculated in the subgroup of overlapping voxels that met activation criteria in BOLD, VASO-FLAIR, and ASL visual (99±30) and motor (70±22) cortex.
CBF changes in the visual and motor cortex were (mean±s.d.) 63%±12% and 46%±11%, respectively. The CBV changes in the motor and visual cortex were (mean±s.d.) 17%±7% and 8%±3%, respectively. Hemodynamic changes were found to be significantly higher in the visual cortex compared with the motor cortex for both CBF (
Cerebral Metabolic Rate of Oxygen Consumption and Oxygen Extraction Fraction Quantification
The above results show the relationship between CBF, CBV, and BOLD, which when combined can be used to estimate CMRO2.
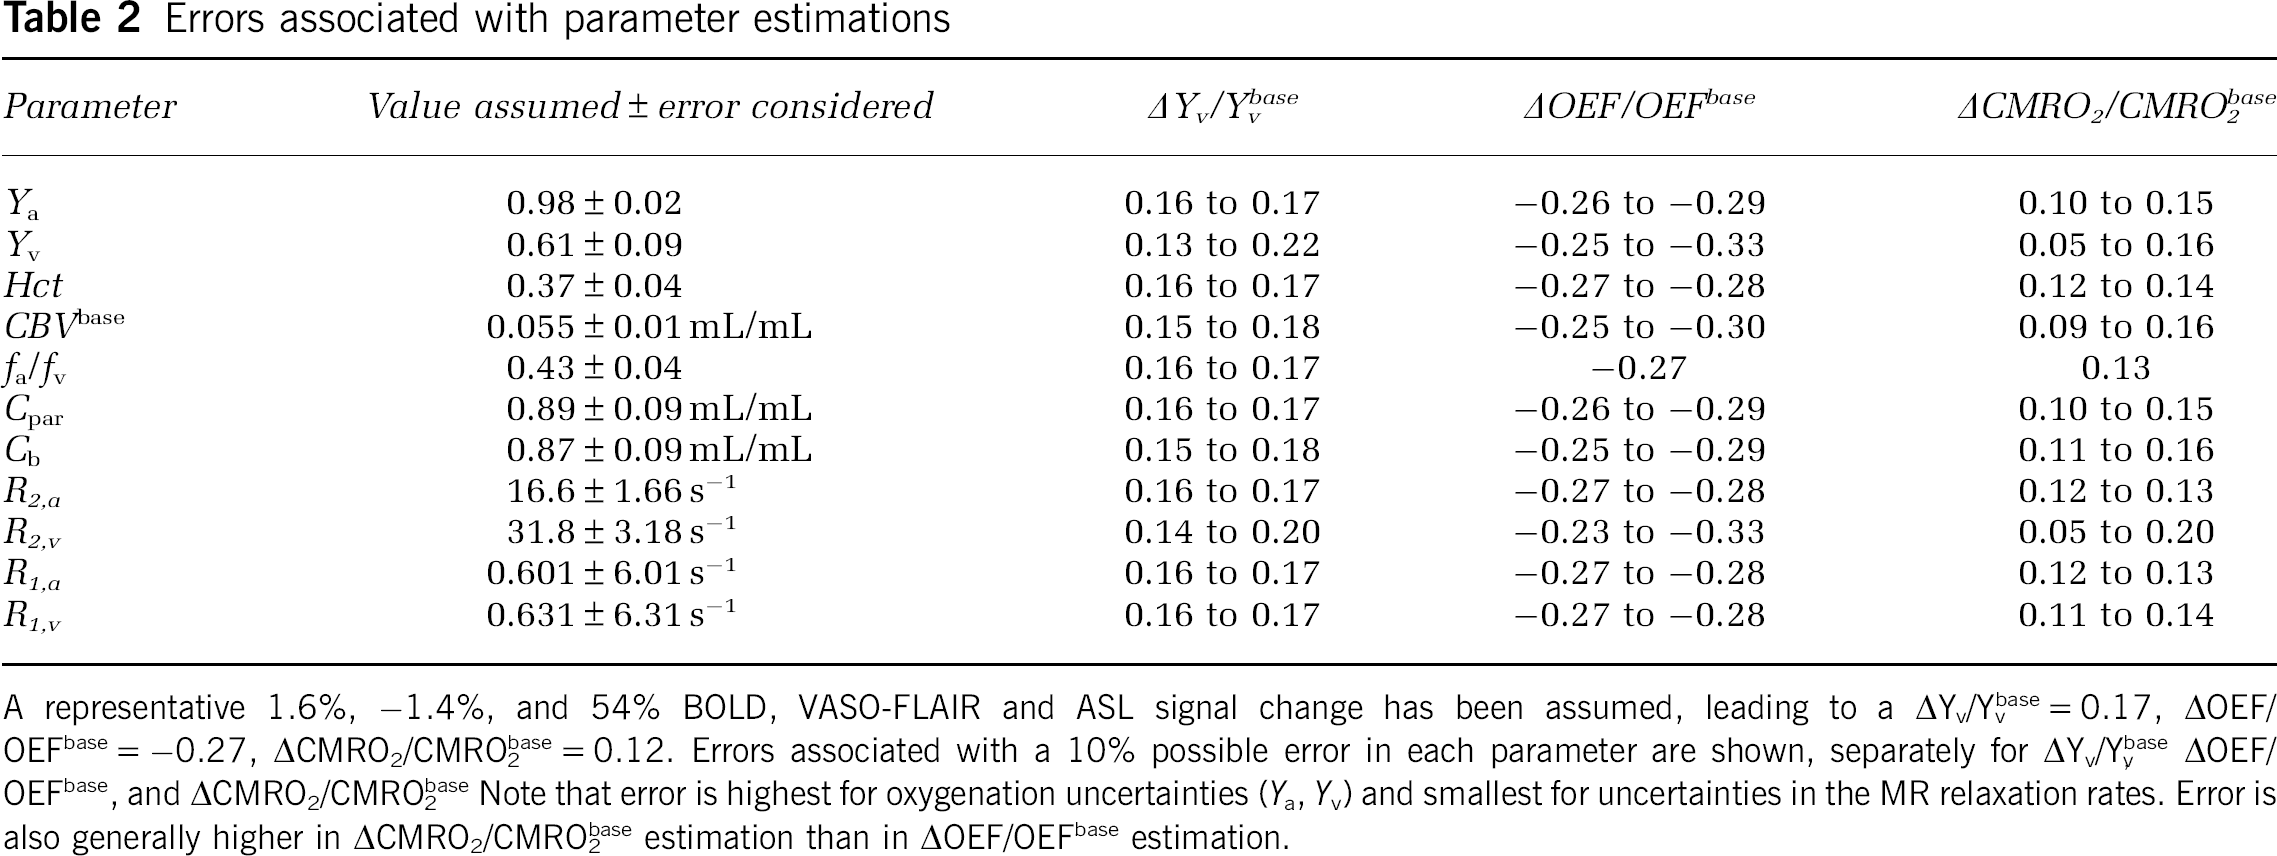
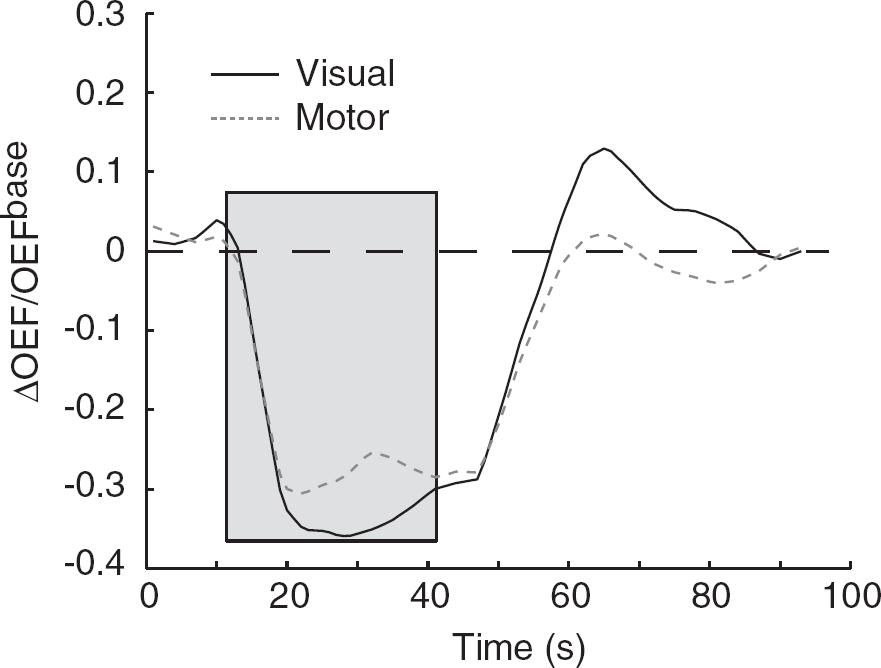
Simulations were performed to show how changes in CBF and CBV would influence OEF, CMRO2, and
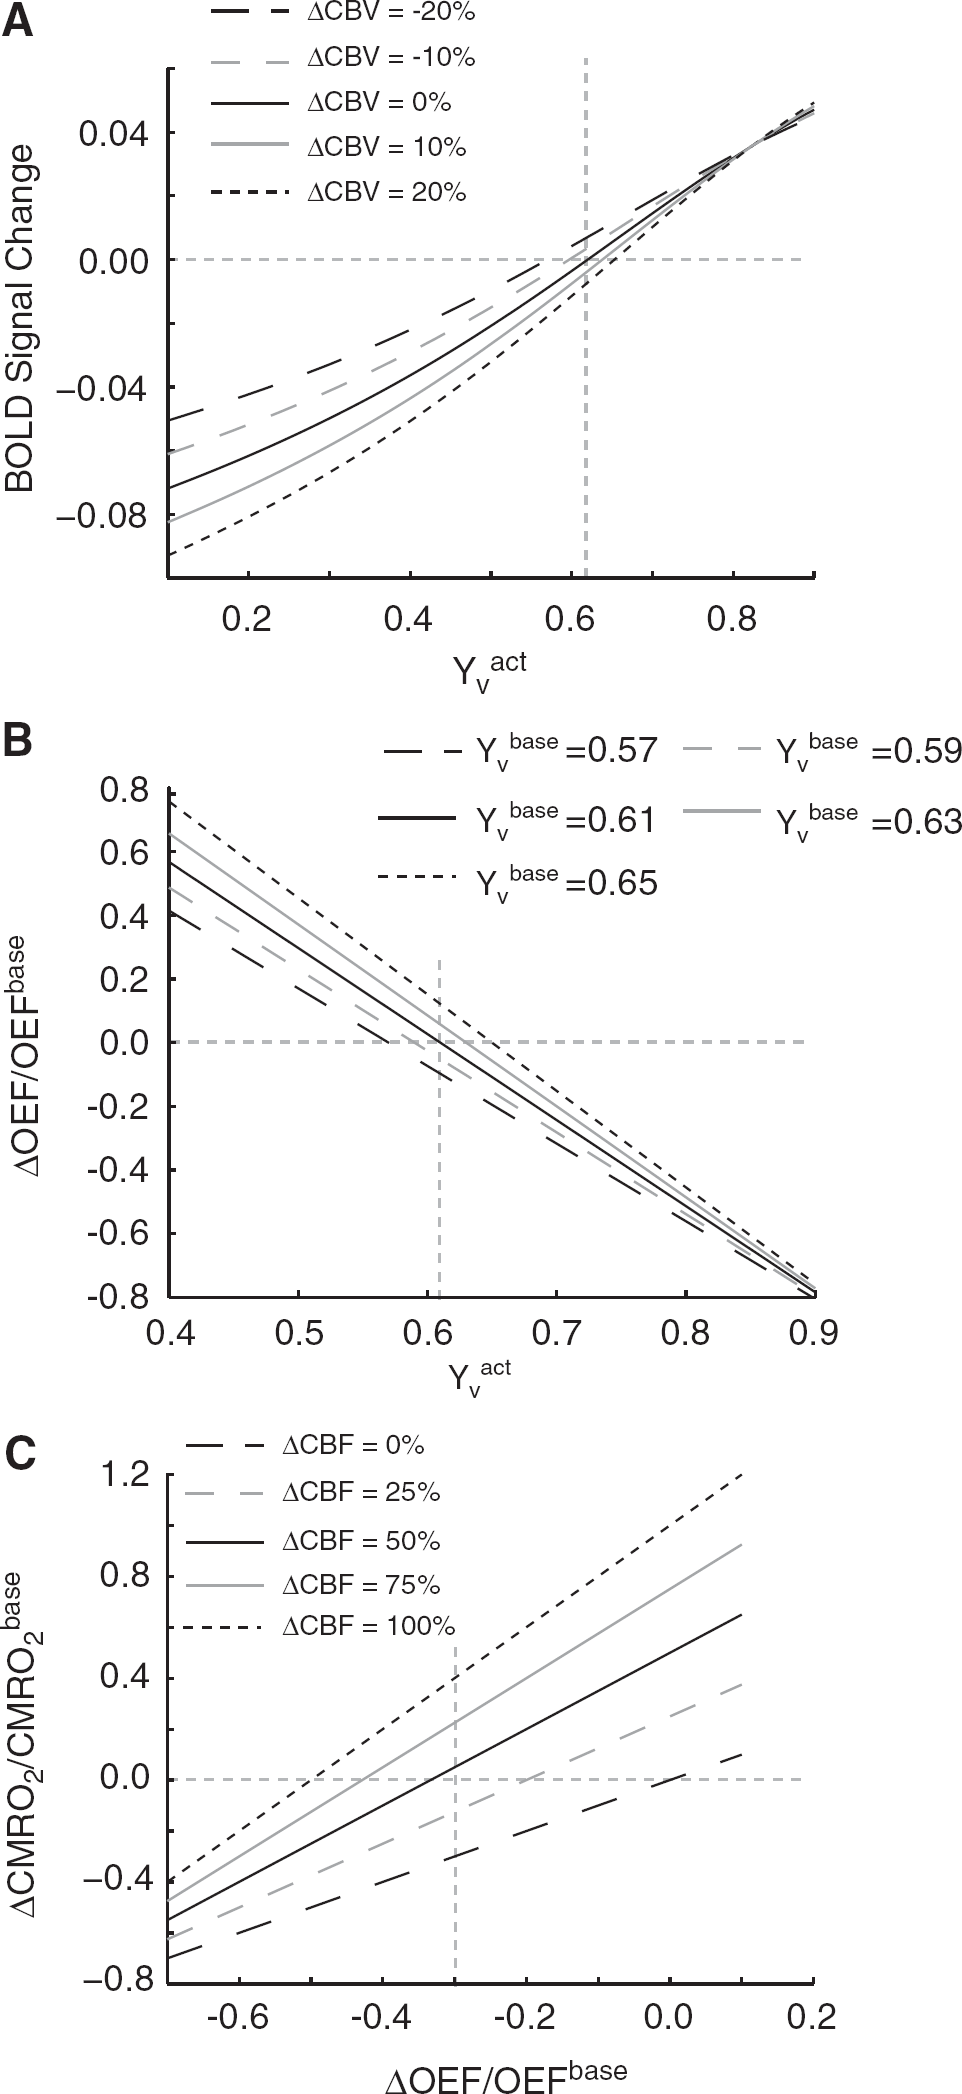
Simulations performed to show how changes in CBF and CBV will influence OEF, CMRO2, and
The quantification procedure incorporates the above model with the BOLD, VASO-FLAIR (CBVw), and ASL (CBFw) data and relies on several assumed parameters. Table 2 shows how the calculated OEF and CMRO2 values will vary for a realistic error in each of the assumed parameters. The error range surrounding a
Errors associated with parameter estimations
A representative 1.6%, −1.4%, and 54% BOLD, VASO-FLAIR and ASL signal change has been assumed, leading to a ΔYv/Yvbase=0.17, ΔOEF/OEFbase=−0.27, ΔCMRO2/CMRO2base=0.12. Errors associated with a 10% possible error in each parameter are shown, separately for ΔYv/Yvbase, ΔOEF/OEFbase, and ΔCMRO2/CMRO2base. Note that error is highest for oxygenation uncertainties (
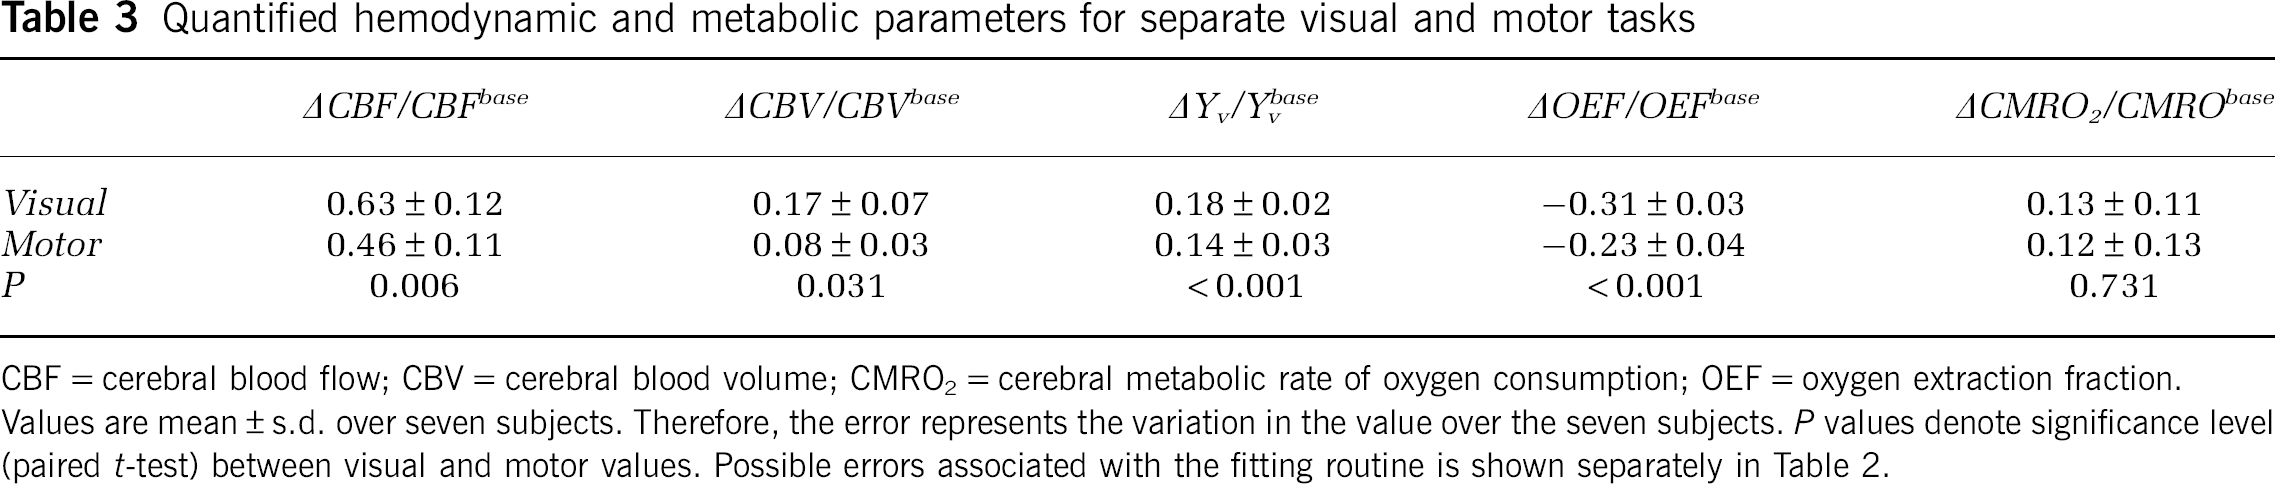
ΔOEF/OEFbase is found to be −0.31±0.03 (visual) and −0.23±0.04 (motor); ΔCMRO2/CMRO2base is found to be 0.13±0.11 (visual) and 0.12±0.13 (motor). Following neuronal activity, during the maximal period of the BOLD undershoot, ΔCMRO2/CMRO2base=0.11±0.07 (visual) and ΔCMRO2/CMRO2base=0.03±0.04 (motor). Figure 4 shows the OEF change versus time. Note that following cessation of the applied stimulus, the OEF change in the visual cortex becomes positive, whereas the OEF change in the motor cortex approaches its baseline level. During this period, the CBF and CBV have returned to baseline as well.
The calculated ΔOEF/OEFbase time course for the visual and motor cortex. The gray box demarcates the task period. Note that following cessation of the task, the OEF change becomes positive in the visual cortex. During this period, the CBF and CBV have returned to baseline levels (Figure 2).
Table 3 shows the quantified hemodynamic and metabolic parameters for separate visual and motor tasks.
Quantified hemodynamic and metabolic parameters for separate visual and motor tasks
CBF=cerebral blood flow; CBV=cerebral blood volume; CMRO2=cerebral metabolic rate of oxygen consumption; OEF=oxygen extraction fraction.
Values are mean±s.d. over seven subjects. Therefore, the error represents the variation in the value over the seven subjects.
Discussion
We explored the individual hemodynamic constituents of the BOLD signal by performing whole-brain CBFw and CBVw functional MRI (fMRI) in combination with BOLD fMRI. The results show that the CBV changes measured using VASO 3D GRASE with CSF suppression (VASO-FLAIR) are consistent with the independently measured CBF and BOLD changes.
Vascular-Space-Occupancy-FLAIR 3D GRadient-And-Spin-Echo
The primary goal of this study was to assess whether CBVw VASO-FLAIR with the 3D GRASE readout could be used to assess CBV adjustments in different brain regions simultaneously. We found larger CBV adjustments in the visual cortex (ΔCBV=17%±7%) compared with the motor cortex (ΔCBV=8%±3%), consistent with a range of previous studies (Vafaee and Gjedde, 2000; Vafaee and Gjedde, 2004). Using 11CO PET in humans, ΔCBV=21%±5% in response to an 8 Hz flashing checkerboard was reported, which is consistent within the error of this study (Ito et al, 2001). Using iron oxide contrast media in alpha-chloralose-anesthetized rats, van Bruggen
The CBVw VASO sequences without CSF nulling showed poor sensitivity to the functionally eloquent regions associated with the task (Figure 1). As this sensitivity improved considerably with VASO-FLAIR (simultaneous blood and CSF nulling), we attributed this to CSF contamination in the voxel in the case of VASO. This CSF contamination is especially detrimental in the 3D GRASE readout, as the long refocusing train will lead to artifacts in voxels that partial volume with tissues of significantly different
Several technical advantages of the CBVw VASO-FLAIR 3D GRASE approach should be considered. First, as the 3D GRASE readout module uses a single excitation radiofrequency pulse per TR, an identical TI is maintained in all slices of the 3D volume, thereby maintaining blood water nulling throughout the long echo train. Second, the 3D GRASE readout is fundamentally a spin-echo sequence. Extravascular BOLD effects arising from large diameter veins are reduced in spin echo, and therefore BOLD sensitivity in 3D GRASE ASL and VASO-FLAIR sequences is reduced relative to gradient echo. Third, the VASO-FLAIR sequence does not require the injection of contrast agents and is therefore entirely noninvasive. This could make VASO-FLAIR 3D GRASE a useful approach for tracking CBV reactivity over time where restrictions on intravascular contrast agent doses may disallow invasive approaches.
Several technical drawbacks of the proposed CBVw approach should also be considered. First, as VASO-FLAIR uses two inversion pulses, the residual tissue magnetization at the time of imaging is lower than in VASO. This observation was reflected in the lower SNR of VASO-FLAIR compared with VASO. However, CNR of VASO-FLAIR 3D GRASE was higher than that of VASO 3D GRASE. Second, the 3D GRASE readout contains a long echo train (∼400 ms) that leads to some signal smearing in the slice direction. This effect is not likely to confound the results in this study as we took care to orient the slices such that the motor and visual cortexes were in different planes. These smearing phenomena can be reduced by using shorter echo train readout times (e.g., fewer slices), refocusing pulses with <180° flip angle, or by incorporating parallel imaging (Feinberg et al, 2009). Furthermore, the reduction in readout time associated with parallel imaging will likely offset any reduction in SNR attributed to the parallel imaging module. Regarding the ASL measurements, both CBF and arterial transit time (ATT), defined as the time for the labeled blood water to reach the capillary exchange site in the imaging slice, can influence quantification (Gonzalez-At et al, 2000). We assumed that ATT did not change between baseline and the activated period. This assumption was based on separate functional ASL measurements in the visual and motor cortex performed at multiple TI values (250 to 2250 ms). We found only a small change in ATT of ∼3% and a similar CBF value to those reported in this single TI study. At the relatively long TI=1600 ms where experiments in this study were performed, an ATT reduction of 3% will have only a small influence on the CBF change (<4%), which is within the error of the values we report.
The OEF and CMRO2 quantification procedure shows promise, yet possible errors in the assumptions do influence the absolute numbers (Table 2). However, arterial oxygenation (
Blood-Oxygenation-Level-Dependent Time-course Dynamics
Following elevated neuronal activity, VASO-FLAIR-measured CBV and ASL-measured CBF return to baseline at approximately the same time, irrespective of the two functional regions studied (Figure 2F and 2G). During this period, the BOLD post-stimulus undershoot is larger and endures longer in the visual than in the motor cortex. This observation is consistent with a persisting change in OEF and CMRO2 (Figure 4).
There is considerable debate in the MR literature regarding the physiological origins of the BOLD post-stimulus undershoot. This undershoot has been attributed to a slow return to baseline of venous CBV (Buxton et al, 1998), as well as to persisting elevated CMRO2 (Donahue et al, 2008; Frahm et al, 2008; Harshbarger and Song, 2008; Lu et al, 2004b). The majority of studies that relate elevated metabolism to the BOLD undershoot were conducted in the visual cortex, whereas much of the literature linking elevated CBV with the undershoot was conducted in the somatosensory and motor cortex where metabolic increases may be smaller (Donahue et al, 2008; Frahm et al, 2008; Harshbarger and Song, 2008; Jin and Kim, 2008; Lu et al, 2004b; Mandeville et al, 1999; Uludag, 2008). Therefore, it is possible that CBF/CBV and CMRO2 mismatches following elevated neuronal activity are more detectable in brain regions that are very energetically demanding (e.g., the visual cortex). In addition, Yacoub
It should be noted that both the CBFw and CBVw time courses return to baseline after 15 to 20 s regardless of the magnitude of the CBF and CBV change. Conversely, the BOLD post-stimulus undershoot returns to baseline more quickly in the motor cortex than in the visual cortex, and this return is equivalent to the CBF and CBV return. Therefore, the BOLD post-stimulus undershoot clearly varies regionally in the brain in response to these two separate tasks, and yet the post-stimulus CBF and CBV responses are largely unchanging. The CBV weighting in VASO may be more sensitive to pre-capillary CBV changes than to post-capillary CBV changes. This is due to blood/tissue water exchange influencing the nulling of blood water in the veins. Therefore, it is possible that small CBV adjustments in the venous vasculature are less detectable with VASO. However, the VASO signal changes are consistent with the BOLD signal changes during neuronal activity and the BOLD contrast is clearly derived from capillary and post-capillary blood oxygenation changes. Therefore, VASO is likely sensitive to some venous CBV effects.
Finally, an ability to measure flow-metabolism coupling and individual CBF, CBV, and CMRO2 reactivity may have a role in the clinical management of patients with cerebrovascular disease; however, this has not yet been shown conclusively. Rossini
Conclusion
By combining the CBVw VASO-FLAIR magnetization preparation with a 3D GRASE readout, we show that it is possible to obtain whole-brain CBVw functional images without the use of intravascular contrast agents. Furthermore, the CBV values obtained from this new approach were consistent with separately measured CBF and BOLD changes. The goal of this study, to generate a whole-brain imaging protocol for identifying the different hemodynamic constituents of BOLD contrast, has been tested by identifying known CBV adjustments and flow-metabolism variations in the visual and motor cortices.
Footnotes
Acknowledgements
We are grateful to Steven Knight, Charlotte Stagg, and Jacinta O'Shea for experimental assistance. This work was made possible by a grant from the Dunhill Medical Trust and the Oxford NIHR Biomedical Research Centre. The Dunhill Medical Trust and The Oxford NIHR Biomedical Research Centre, NIH NINDS 5R44NS063537.
The authors declare no conflict of interest.