
Abstract
Functional neuroimaging is most commonly performed using the blood-oxygenation-level-dependent (BOLD) approach, which is sensitive to changes in cerebral blood flow (CBF), cerebral blood volume (CBV), and the cerebral metabolic rate of oxygen (CMRO2). However, the precise mechanism by which neuronal activity elicits a hemodynamic response remains controversial. Here, visual stimulation (14 secs flashing checkerboard) and breath-hold (4 secs exhale + 14 secs breath hold) experiments were performed in alternating sequence on healthy volunteers using BOLD, CBV-weighted, and CBF-weighted fMRI. After visual stimulation, the BOLD signal persisted for 33 ± 5 secs (n = 9) and was biphasic with a negative component (undershoot), whereas CBV and CBF returned to baseline without an undershoot at 20 ± 5 and 20 ± 3 secs, respectively. After breath hold, the BOLD signal returned to baseline (23 ±7 secs) at the same time (
Introduction
Functional magnetic resonance imaging (fMRI) using the blood-oxygenation-level-dependent (BOLD) technique (Ogawa et al, 1990) has emerged as a leading research tool for detecting brain activity. Blood-oxygenation-level-dependent contrast is derived from magnetic susceptibility changes consequential to alterations in the blood oxygenation level and therefore provides an indirect reflection of neuronal activity. Such oxygenation changes arise from the hemodynamic response to neuronal activity, which consists of ensemble changes in cerebral blood flow (CBF), cerebral blood volume (CBV), and the cerebral metabolic rate of oxygen (CMRO2; Buxton et al, 1998; Leenders et al, 1990; Ogawa et al, 1993; van Zijl et al, 1998). Despite a significant body of experimental data, the relationship between neuronal activity and the hemodynamic response is not well characterized (Buxton et al, 2004; Frahm et al, 2008; Hillman et al, 2007; Lu et al, 2004; Mandeville et al, 1999; Yacoub et al, 2006).
Two general pathways have been proposed to describe this relationship between neuronal activity and the hemodynamic response. In the metabolic pathway, hemodynamic changes are induced by vasodilatory metabolites (CO2 and H+) released during increased aerobic metabolism; changes in CBF and CBV are thus a direct reflection of local tissue energy demands and are coupled to changes in CMRO2. Alternatively, the neurotransmitter pathway proposes that molecules released at the synapse during neuronal activity, such as glutamate, trigger the release of vasodilatory mediators (e.g., nitric oxide), which then increase CBF and CBV (Attwell and Iadecola, 2002); according to this view, changes in CBF and CBV are not directly coupled to changes in CMRO2.
Efforts to understand which of these pathways provides the best account of hemodynamic responses to brain activation have proven difficult. An important reason for this is that the changes in neuronal activity, oxygen metabolism, neurotransmitter release, and CBF are often in the same direction and are proportional. One approach is to compare the time-dependent changes in CBF, CBV, and CMRO2 induced during and after cortical activation. The typical BOLD fMRI time course consists of an increase in signal intensity corresponding to increases in capillary and venous blood oxygenation, followed by a decrease in MR signal to subbaseline intensity. The origin of this phase of reduced oxygenation, referred to as the poststimulus undershoot, is still under discussion. Initially, it was hypothesized that the undershoot results from continued oxygen metabolism in the absence of changes in CBF (Frahm et al, 1996). Subsequent experiments on anesthetized mammals (Mandeville et al, 1998, 1999) suggested that the BOLD undershoot could be due to continued elevated venular CBV, described by the so-called delayed venular/venous compliance model (Buxton et al, 1998). However, more recent human studies show an uncoupling of CBV, CBF, and BOLD responses during the undershoot period (Frahm et al, 2008; Lu et al, 2004; Tuunanen et al, 2006), which, under the assumption of negligible changes in hematocrit, point to a persisting increase in tissue oxygen metabolism. In another study, using near infrared spectroscopy in conjunction with BOLD fMRI, deoxyhemoglobin concentration remained elevated during the BOLD poststimulus undershoot, providing more evidence for persisting tissue hypermetabolism after neuronal stimulation (Schroeter et al, 2006). Recently, using BOLD and bolus tracking, it was shown that the BOLD poststimulus undershoot persisted after CBV had already returned to baseline (Frahm et al, 2008). Collectively, these data indicate that activity-elicited changes in CMRO2 can occur in the absence of changes in CBF and CBV, with the preserved coupling of responses during stimulus onset potentially being coincidental rather than causal. Moreover, the uncoupling of metabolic and hemodynamic activity during the poststimulus undershoot would tend to refute the need for increased blood flow during and after a transient increase in metabolism, thereby indirectly supporting the neurotransmitter account.
In this study, BOLD, CBV-weighted (CBVw), and CBF-weighted (CBFw) fMRI were performed using both visual stimulation and a mild hypercapnic stimulus (breath hold), under normoxic conditions. In both of these physiologic perturbations, CBV and CBF increase; however, contrary to visual activation where CMRO2 increases, CMRO2 is known to remain largely unchanged during a brief breath hold (Fox and Raichle, 1984; Mintun et al, 2001; Siesjö, 1978). Therefore, the comparison of breath hold and visual stimulation may yield insight concerning the relationship between CBF, CBV, and CMRO2. We hypothesized that if the BOLD poststimulus undershoot is due to a persisting oxygen metabolism, it will disappear in brief BOLD breath-hold experiments.
Materials and methods
Experiment
A total of 10 healthy participants (5 women; 5 men) provided informed, written consent in accordance with local IRB requirements. All volunteers were placed in a supine position and scanned in a 3.0 T MRI scanner (Philips Medical Systems, Best, The Netherlands). To prevent unwanted motion, the head was secured with a hook-and-loop fastener and foam padding. Heart rate, arterial oxygen saturation fraction
Two BOLD, CBVw, and CBFw scans were performed for each participant in a single slice centered on the visual cortex. The readout technique and spatial resolution were identical in all scans, namely a gradient echo single-shot echo planar imaging sequence (SENSitivity Encoding, SENSE, factor 2.5) with field of view (FOV) = 240 × 240 mm2 and voxel size = 3 × 3 × 3 mm3. Scan parameters for BOLD were TR/TE = 3,000/45 ms, 112 image acquisitions (dynamics). Cerebral blood flow-weighted imaging was achieved with the transfer-insensitive labeling technique for arterial spin labeling, TILT-ASL (Golay et al, 1999): FOV = 240 × 240 mm2, voxel size = 3 × 3 × 3 mm3, gradient echo single-shot echo planar imaging, TR/TI/TE = 2,000/1,500/13 ms, 168 combined control, and label image acquisitions. TILT-ASL parameters were optimized for CBF sensitivity (Donahue et al, 2006b). Cerebral blood volume-weighted imaging was achieved with the vascular space occupancy (VASO) approach (Lu et al, 2003): TR/TI/TE = 5,000/1,054/13 ms and 68 image acquisitions. The TR and TE values for the two methods were chosen to optimize the desired contrast for each technique. For instance, for BOLD fMRI a TR of 3,000 ms was used to avoid inflow effects and the interference of stimulated echoes, whereas a TR of 5,000 ms was needed for VASO to optimize for CBV sensitivity (Donahue et al, 2006a), which was not done in earlier work when the VASO contrast mechanism was less well understood. The TR discrepancy (ASL TR = 2,000 ms, VASO TR = 5,000 ms, and BOLD TR= 3,000 ms) should be kept in mind when interpreting results, and time course differences that are less than 3,000 ms may be insignificant. The CBVw signal change is fundamentally negative owing to the nature of the VASO contrast mechanism (Lu et al, 2003), however the time courses have been inverted here to make direct comparison with BOLD and CBFw time courses more straightforward.
Recent work has shown that, in addition to CBV, the VASO contrast is sensitive to other parameters, such as CBF, water exchange between compartments, blood inflow, and CSF partial volume contributions (Donahue et al, 2006a; Scouten and Constable, 2008). Fortunately, although short TR experiments are affected by all of these effects, long TR VASO is predominantly sensitive to CBV (Donahue et al, 2006a). Early VASO experiments in humans (Donahue et al, 2006a; Lu et al, 2003), as well as high-resolution independent experiments in cats at high magnetic field (Jin and Kim, 2006, 2008) have shown that the VASO effects are well localized within the microvasculature, consistent with the presumed CBV origin.
Blood-oxygenation-level-dependent, CBVw, and CBFw hemodynamic responses were measured in each participant using two experimental paradigms. In the first, a visual task consisting of 56 sec cross-hair fixation, followed by 14 sec blue/yellow flashing (frequency = 8 Hz) checkerboard stimulation, was repeated four times. In the second, a breath-hold task consisting of 52 secs normal breathing, 4 secs exhalation, and 14 secs breath holding, was repeated four times. Each subject had 56 secs of resting/normal breathing at the beginning of each scan to become accustomed to scanner noise and for magnetization to reach steady state; data acquired during this time were not analyzed. During the initial experimental planning, longer breath holds (20 to 30 s) were attempted, but it was found that these were followed by mild hyperventilation, which will cause a negative BOLD response and could be erroneously interpreted as a poststimulus undershoot. Therefore, to prevent this unwanted compensatory response, the breath-hold task was reduced to 14 secs, which was short enough to minimize unwanted respiratory compensation. Participants were instructed to refrain from using hemodynamic stimulants (coffee, tea, chocolate, licorice) for 6 h before their participation, and also to arrive at least 15 mins before the start of the study to rehearse the paradigms.
Data Analysis
First, images were corrected for motion and coregistered using the Oxford Centre for Functional Magnetic Resonance Imaging of the Brain Linear Image Registration Tool (Jenkinson and Smith, 2001). As a gradient echo single-shot echo planar imaging readout was used in all scans, distortions were comparable in BOLD, CBVw, and CBFw scans. Next, images were corrected for baseline drift using a cubic-spline interpolation algorithm written in MATLAB (The MathWorks, Natick, MA, USA).
A z-test was used to identify activated voxels. Voxel selection criteria for activation were z-score>2.5 (BOLD, ASL), z-score ≤ −2.5 (VASO), signal-to-noise ratio ≥ 20 (BOLD, VASO), and cluster size ≥ 4 (BOLD, CBVw, and CBFw). A paired
Two methods were applied for activation map selection. In Method 1, comparison of signal changes within imaging modalities (e.g., BOLD, CBVw, or CBFw) was designed. This was achieved by calculating time courses only in voxels meeting activation criteria in visual and breath-hold experiments for each imaging modality. In Method 2, to compare signal changes between imaging modalities, BOLD, CBVw, and CBFw visual or breath-hold activation maps were combined to yield a new activation map that described only the voxels meeting activation criteria in all modalities, separately for each task (visual or breath hold). Note that Method 1 allows for comparison between tasks for each imaging modality; Method 2 allows for comparison between imaging modalities for a single task.
Notice that it is not a good approach to use all activated BOLD voxels as a template and subsequently compute CBVw and CBFw changes in these voxels. This approach is problematic as BOLD effects also occur in draining veins, leading to inaccurate localization of activation.
Results
A total of 10 healthy participants were scanned in this study. However, one of the participants was not able to perform all tasks and was excluded. Table 1 shows mean physiologic values acquired both before and immediately after the task periods. Vital signs were not found to deviate significantly (
Physiological parameters (n = 9) measured before and after visual stimulation (above) and breath hold (below)
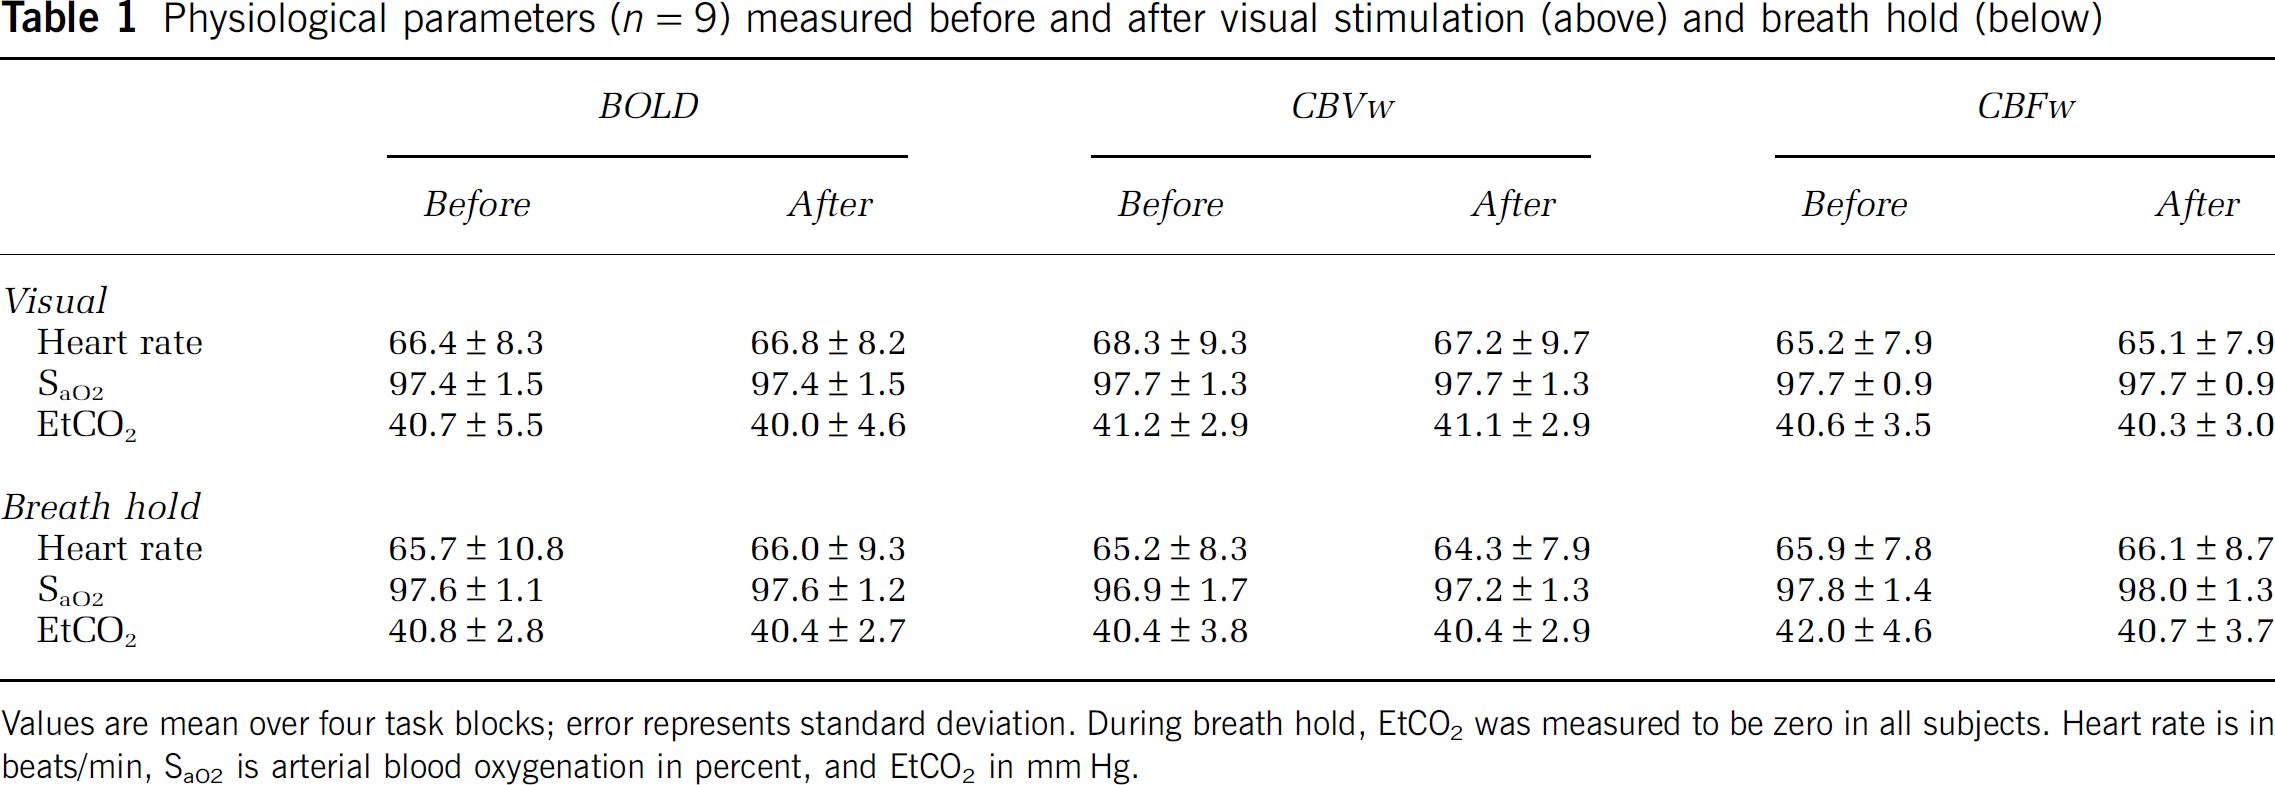
Values are mean over four task blocks; error represents standard deviation. During breath hold, EtCO2 was measured to be zero in all subjects. Heart rate is in beats/min, SaO2 is arterial blood oxygenation in percent, and EtCO2 in mm Hg.
Figure 1 shows the averaged hemodynamic responses for the visual and breath-hold stimuli for voxels analyzed according to Method 1. Recall that in Method 1, comparison between visual and breath-hold stimuli can be drawn within imaging modalities, but not between imaging modalities. The data show that onset of signal changes differs between visual and breath hold, but it is important to notice that this is not because of a physiologic effect but because of the paradigm design. For visual stimulation, a 56 secs baseline was followed by a 14 secs flashing-checkerboard presentation. For breath hold, 52 secs of baseline was followed by 4 secs for exhale and then 14 secs breath hold. Therefore, although the lengths of the visual and breath-hold tasks were defined equally, the baseline period varied between tasks. It was observed that in most volunteers, BOLD, CBVw, and CBFw signals already increased during the exhale period. Consequently, the actual breath-hold task was slightly longer than the visual task, with the precise length depending on how quickly volunteers exhaled. The volunteers practiced exhaling before scanning, however performance varied slightly. As the goal of the study was to investigate the poststimulus events, this was not an overwhelming complication.
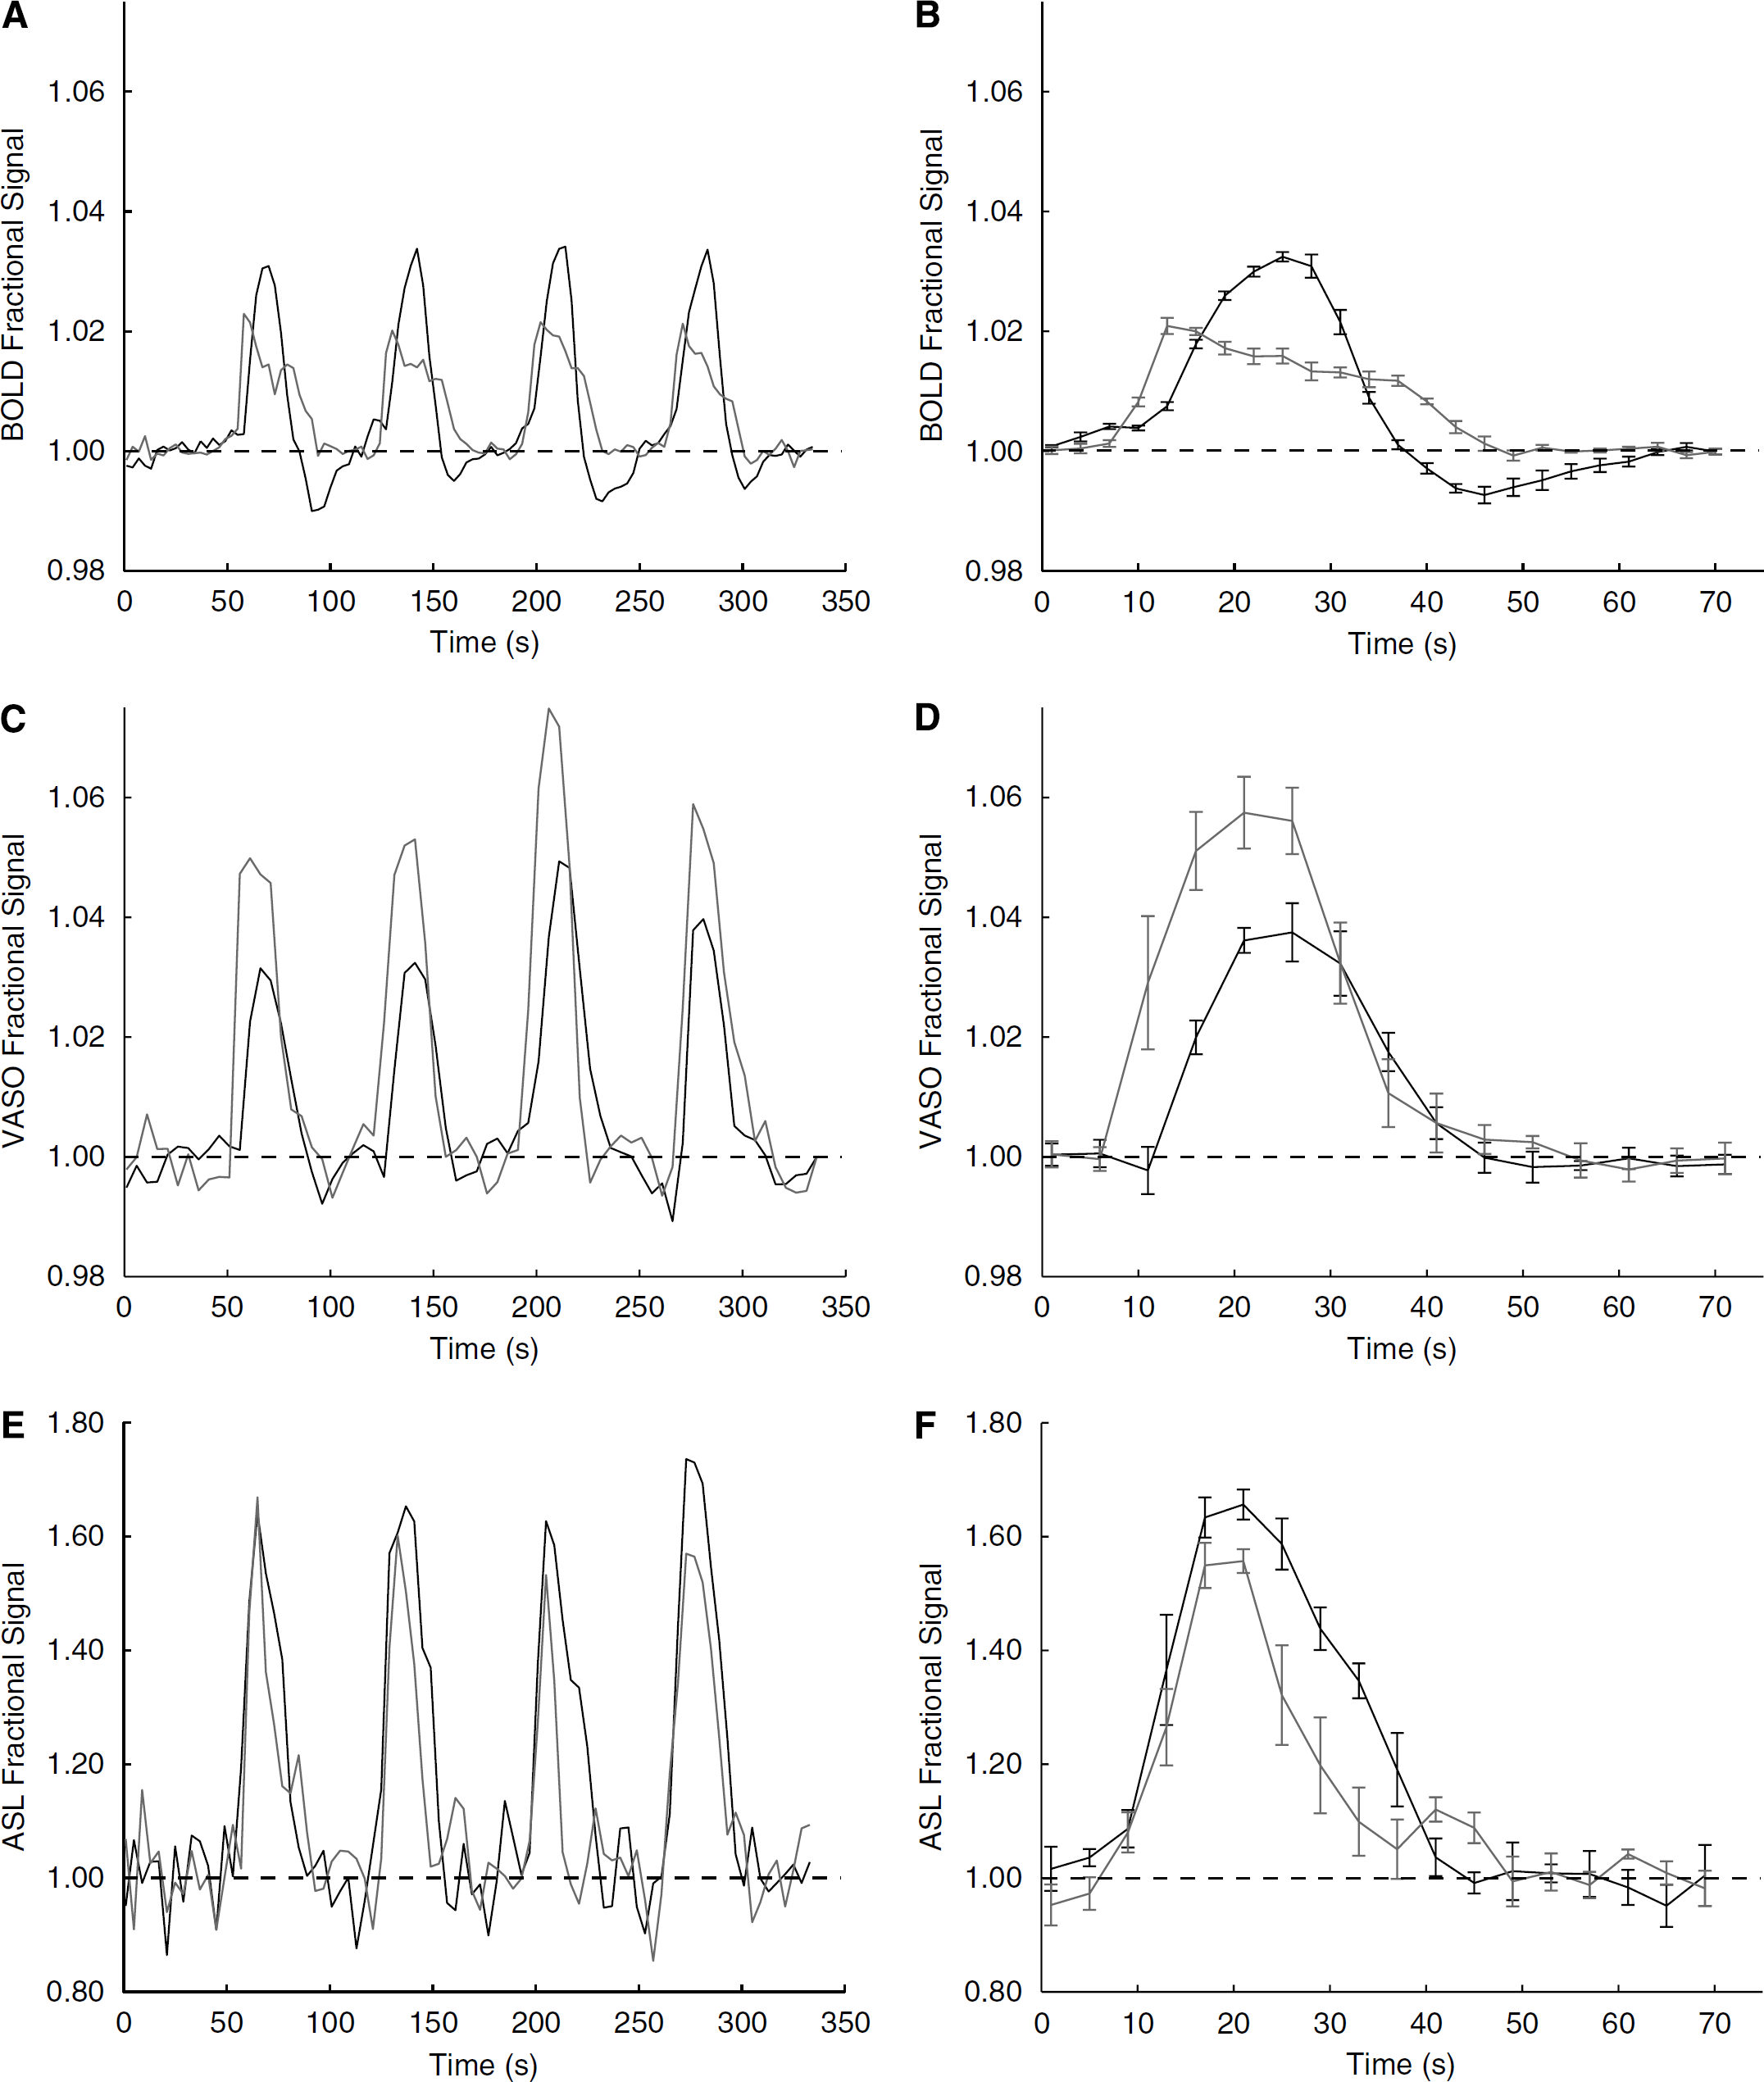
Visual (black) and breath-hold (gray) time courses for voxels analyzed according to Method 1 voxel selection. On the left, the subject-averaged (
The data in Figure 1 show two clear trends. First, the BOLD signal change between baseline and visual stimulation (3.4% ± 0.8%) is larger than between baseline and breath hold (2.3% ± 0.3%), whereas the opposite effect is found in the CBVw scans (3.8% ± 1.1% versus 5.6% ± 1.0%, respectively). In the CBFw experiments, the signal changes did not differ significantly (
The BOLD, CBVw, and CBFw hemodynamic responses for visual and breath-hold stimuli analyzed according to Method 2 are compared in Figure 2. The quantitative signal changes for each volunteer are shown in Table 2 and baseline return times are shown in Table 3. Recall that in the Method 2 voxel selection, comparison between BOLD, CBVw, and CBFw time courses can be made for a single task (either visual or breath hold). After visual stimulus, the BOLD response, while crossing the baseline more rapidly, is delayed in its ultimate return to baseline (33 ± 5 secs) when compared to the CBVw response (20 ± 5 secs) and CBFw response (20 ± 3 secs). This difference, because of the long poststimulus undershoot, is highly significant (
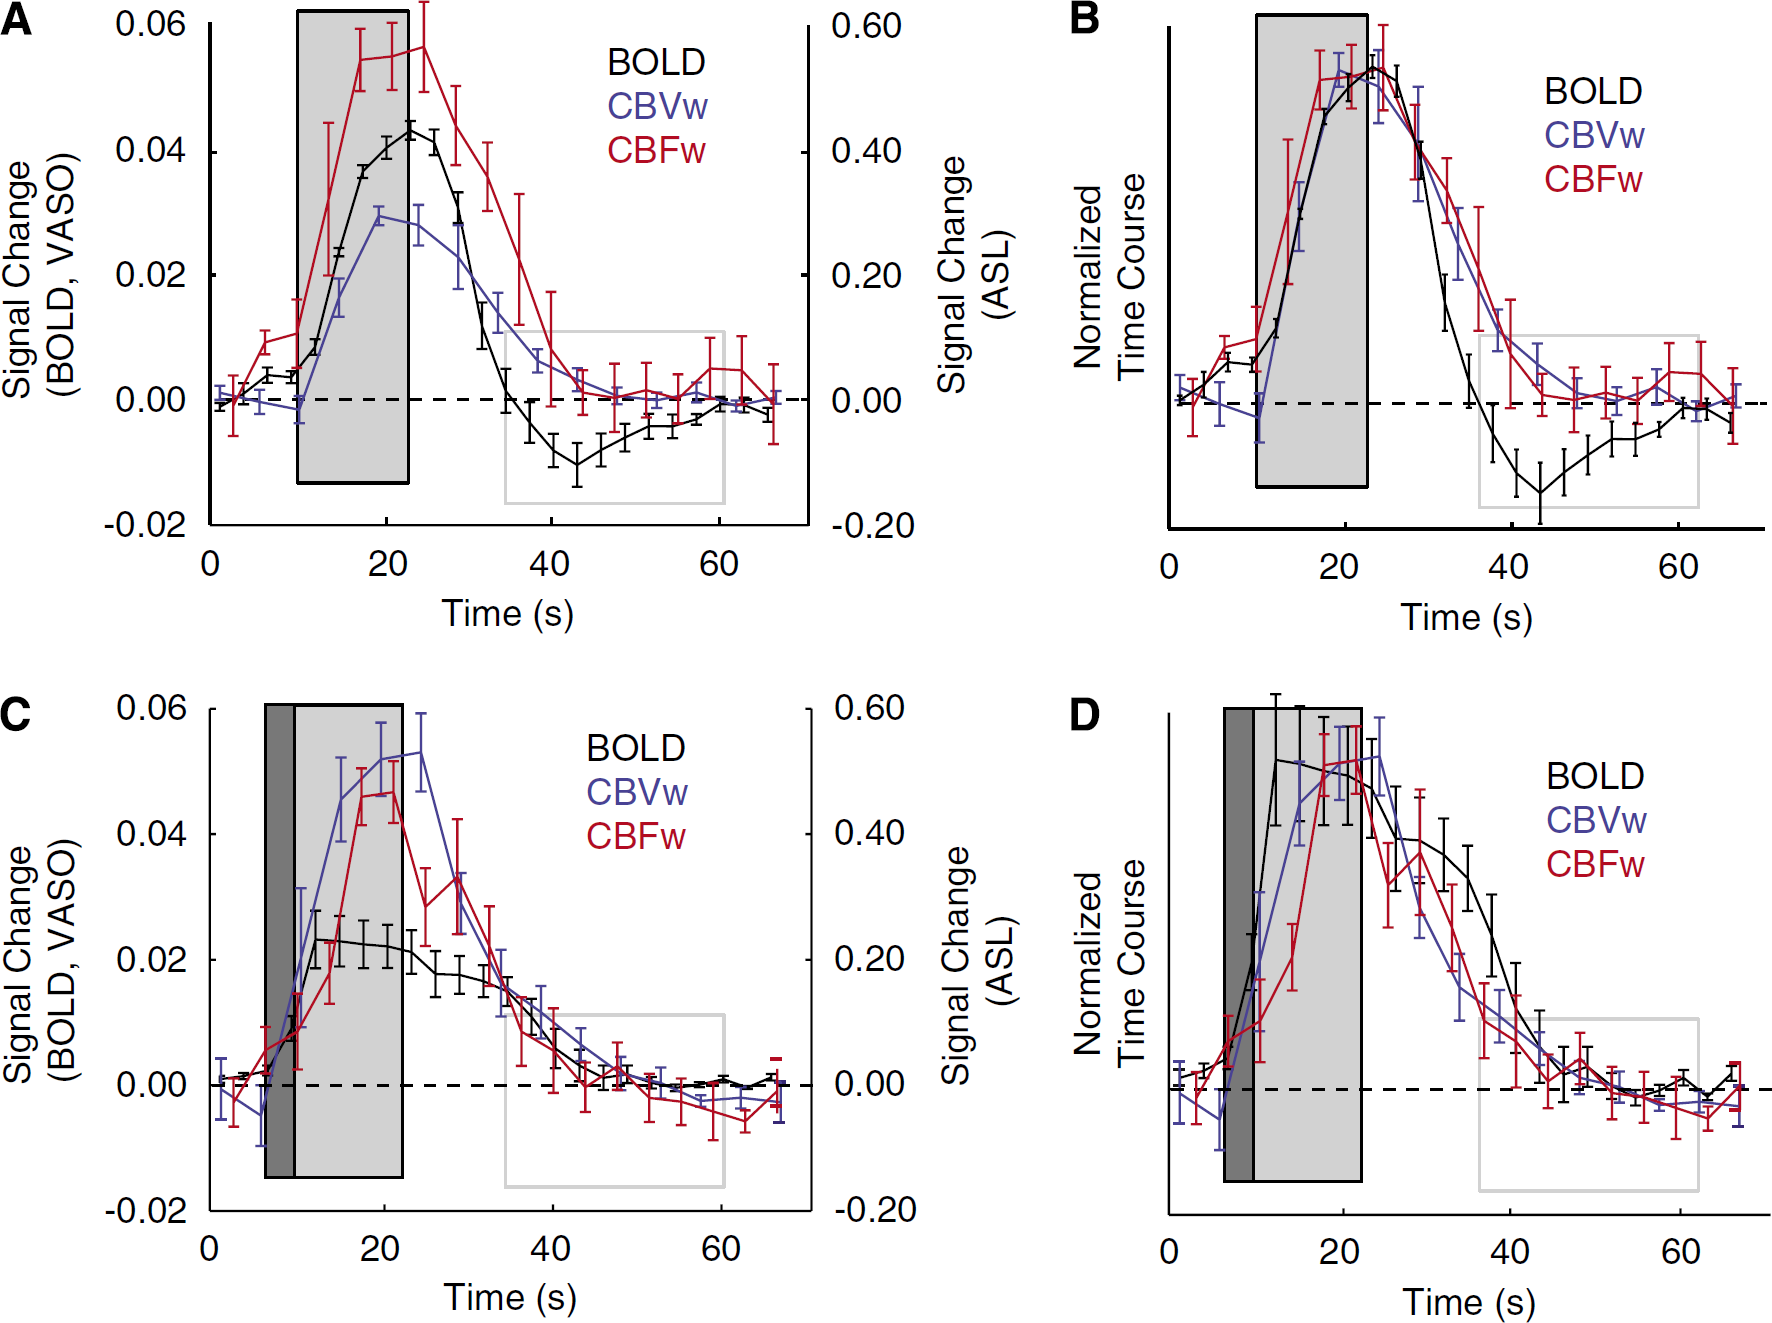
BOLD, CBVw, and CBFw time courses for voxels analyzed according to Method 2 voxel selection. Here, the four-block stimulus paradigm has been averaged to make direct comparison among modalities clearer. The dark gray box shows the duration of the exhale period, the light gray box shows the duration of the stimulus (visual or breath hold), and the gray-lined box demarcates the location of the BOLD visual poststimulus undershoot. (
Individual signal changes (absolute % versus baseline) for BOLD, CBV-weighted (CBVw), and CBF-weighted (CBFw) hemodynamic responses
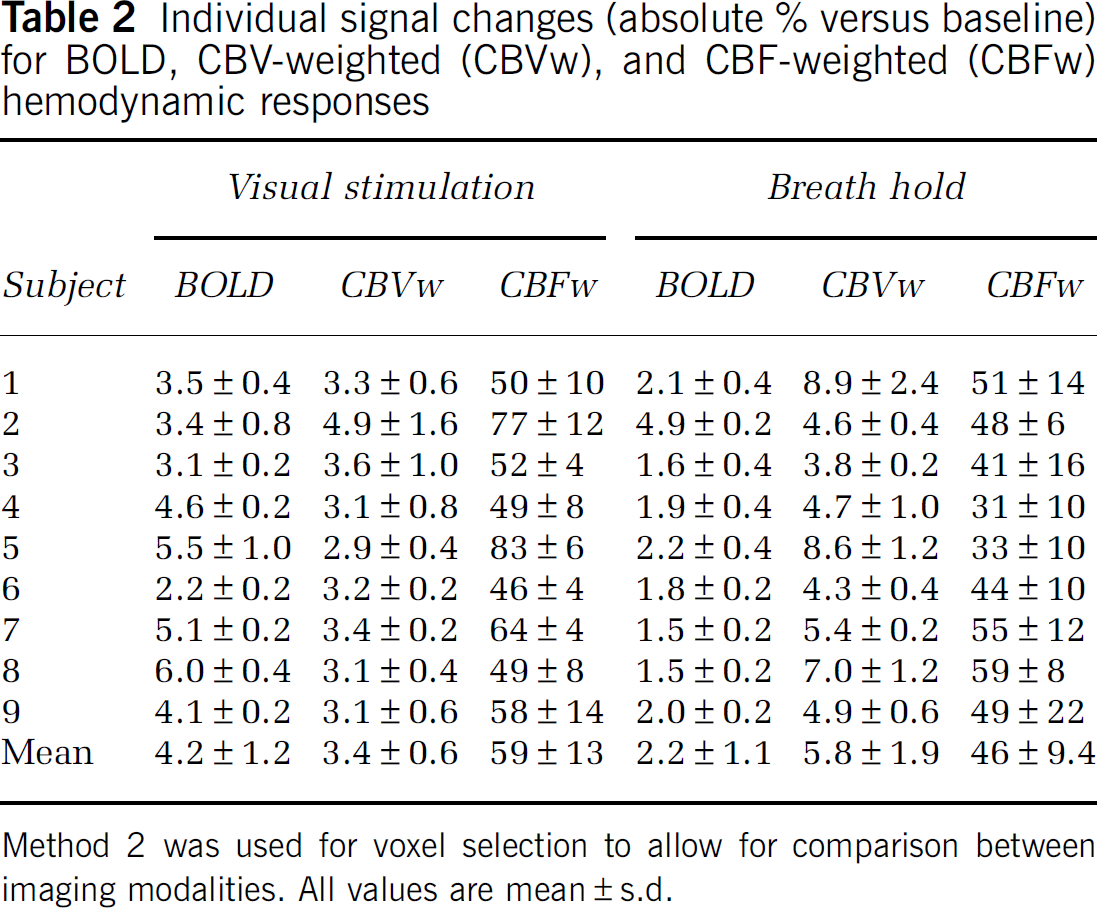
Method 2 was used for voxel selection to allow for comparison between imaging modalities. All values are mean ± s.d.
Hemodynamic response times for ultimate return to baseline (BOLD, CBVw, and CBFw) and first touching (CBVw, CBFw) or crossing baseline (BOLD) following cessation of stimulus
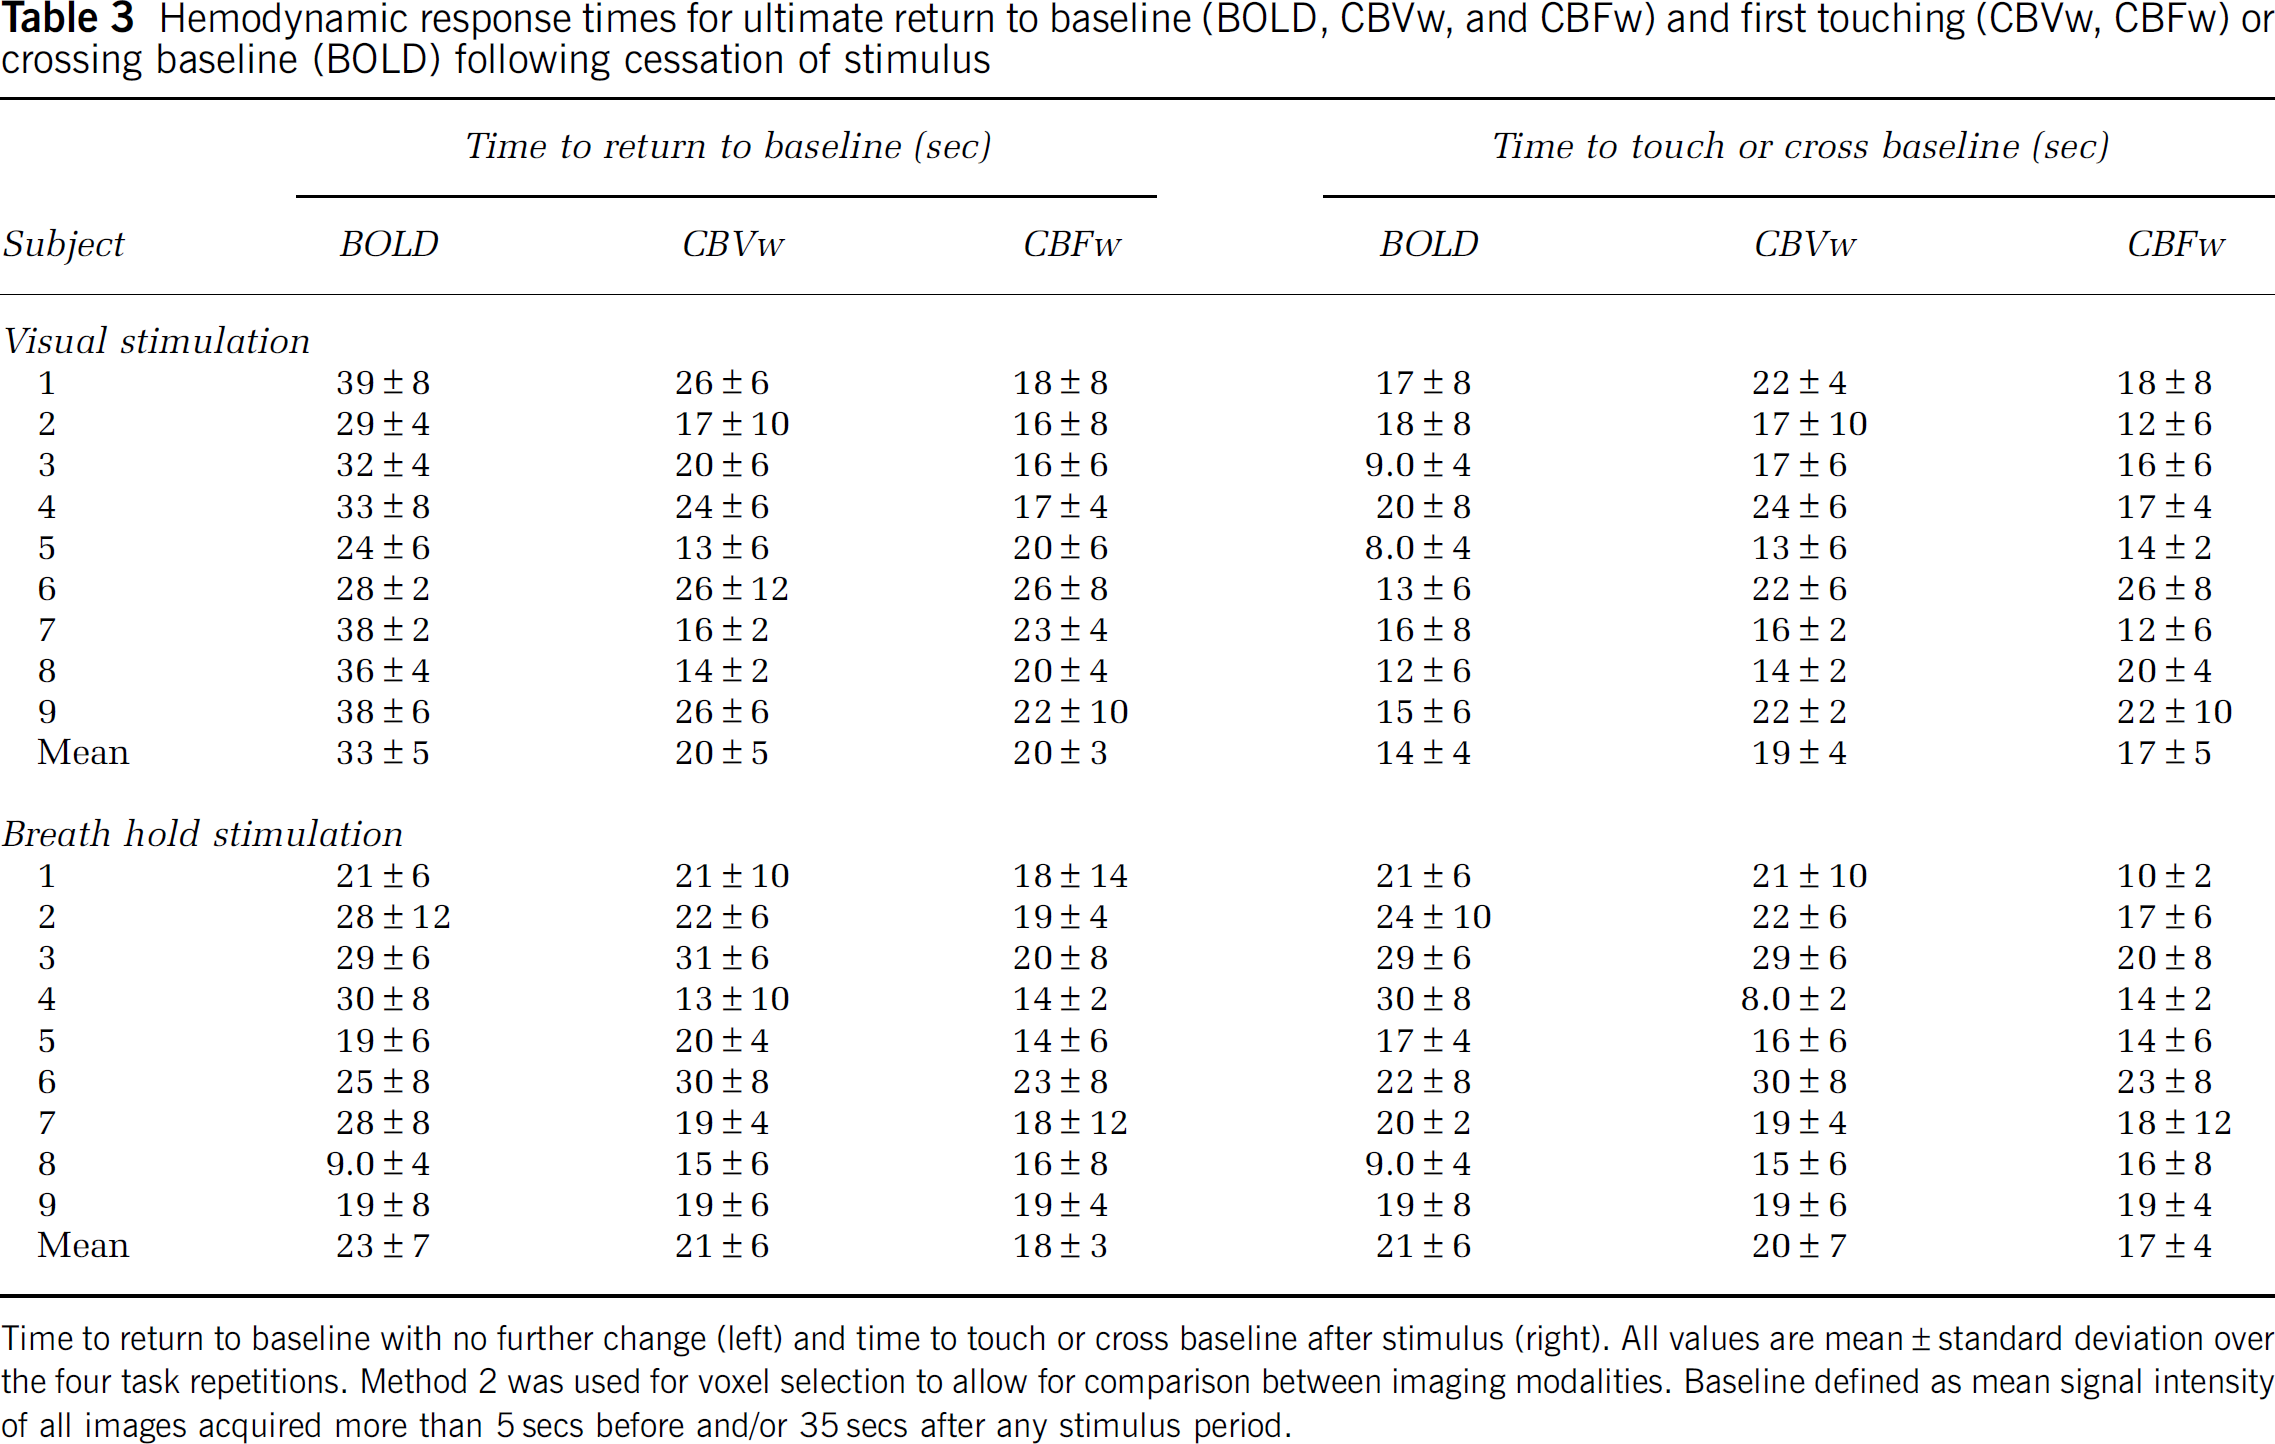
Time to return to baseline with no further change (left) and time to touch or cross baseline after stimulus (right). All values are mean ± standard deviation over the four task repetitions. Method 2 was used for voxel selection to allow for comparison between imaging modalities. Baseline defined as mean signal intensity of all images acquired more than 5secs before and/or 35secs after any stimulus period.
As with the Method 1 analysis, voxels analyzed according to Method 2 (Figure 2; Tables 2 and 3) yield a higher CBVw response (
Discussion
The BOLD data presented here show a clear poststimulus undershoot after visual stimulation and no undershoot after breath hold. Although the CBVw and CBFw hemodynamic responses returned to baseline at approximately the same time as the BOLD response after a breath-hold task, there was a clear discrepancy among responses after visual stimulation, where a poststimulus BOLD undershoot occurred that continued for approximately 13 secs after the CBVw and CBFw responses had returned to baseline. This provides clear evidence that the BOLD signal can change in the absence of changes in CBV and CBF.
The data reported here support our hypothesis that the BOLD undershoot observed after visual stimulation is not present in breath-hold experiments if the undershoot is due to persisting increases in oxygen metabolism. Oxygen metabolism has been well documented to remain unchanged during short breath holds (Siesjö, 1978) which is consistent with negligible changes in tissue pO2. The changes in blood oxygenation causing a positive BOLD response during breath hold are because of a vascular response based on a change in blood flow, under conditions of limited changes in arterial oxygenation but increased capillary and venous oxygenation. The reason is that the BOLD effect originates predominantly from changes in the concentration ratio of deoxyhemoglobin to total hemoglobin ([Hb]/[HbT]) in the capillaries, venules, and veins (Ogawa et al, 1993; van Zijl et al, 1998). Taking into account the changes in arterial oxygenation fraction (Ya = SaO2/100), the venous fraction of deoxyhemoglobin [Hb] relative to the total hemoglobin [HbT], is (van Zijl et al, 1998):
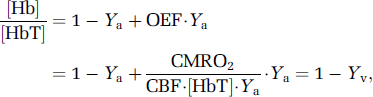
in which the oxygen extraction fraction (OEF) is the ratio of the rate of cerebral oxygen metabolism (CMRO2) and delivery. The oxygen delivery is the product of arterial oxygen content ([HbT]Ya) and CBF. During brain activation, there is a mismatch between increases in CMRO2 and CBF, leading to a decrease in [Hb]/[HbT] and a corresponding increase in venous oxygenation (Yv), ultimately yielding an MRI signal increase. Notice that a similar expression applies to capillary BOLD effects, where capillary oxygenation fraction (Yc) varies as a function of distance between arterioles and venules.
Equation (1) underlies both BOLD intra- and extravascular signal effects and shows that an increase in oxygenation reduces the deoxygenated Hb concentration, which amounts to a reduction in a paramagnetic MR contrast agent and thus an increase in MRI signal. Intra- and extravascular effects contribute to the total BOLD relaxation rates in an approximate 40/60 ratio at 3T (Lu and van Zijl, 2005). For signal changes, this ratio depends on the echo time TE. At the echo time (TE = 45 ms) used here, it can be assumed that the BOLD signal change is predominantly of extravascular origin because there is limited venular and venous blood signal left at 3.0T. A convenient expression describing most of the venular extravascular BOLD signal changes has been given by (Yablonskiy and Haacke, 1994):

in which R'2, Hb is the deoxyhemoglobin contribution to the MRI relaxation rate and the subscript v denotes venular/venous as based on oxygenation. Combining Equations (1 and 2a) under conditions of normoxia (Ya≈ 1) gives:
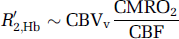
Thus, although an increase in blood flow reduces the relaxation rate, leading to a signal increase, any increase in CBV reduces the extravascular BOLD effect. Interestingly, the hematocrit-based term ([HbT]) vanishes in this extravascular term, indicating that hematocrit influences predominately intravascular BOLD effects. Equation (2b) indicates that, under normoxic conditions, the poststimulus undershoot must be due to either a continued increase in CMRO2 or continued expansion of the postcapillary/venular space. A BOLD poststimulus undershoot was not detected in breath-hold experiments, whereas a vascular compliance similar to neuronal activation would be expected. This suggests that the BOLD undershoot after visual stimulation is not due to delayed venular/venous compliance as suggested earlier (Buxton et al, 1998). This accords with recent high-resolution optical imaging data showing that most vasodilation occurring during neuronal activation is due to arteriolar and capillary expansion (Hillman et al, 2007), whereas venous vessel size does not change appreciably. In principle, delays in capillary compliance could contribute to a poststimulus undershoot, but this would also be reflected in CBVw or CBFw changes, which are absent.
We therefore conclude that the poststimulus undershoot is because of continued oxygen metabolism after changes in CBF and CBV have ceased. Such continued oxygen metabolism might reflect energy-dependent cellular mechanisms after neuronal stimulation (e.g., restoration of ionic balance and adenosinetriphosphate (ATP)). It has been suggested that gray matter energy expenditure during neuronal signaling is largely devoted to restoring cell membrane ion concentration gradients resulting from both the transmission of action potentials and the excitatory postsynaptic currents (Attwell and Laughlin, 2001; Jueptner and Weiller, 1995; Sibson et al, 1998). In humans, the large number of synapses per neuron and high fraction of mitochondria in dendrites (Wong-Riley, 1989) leads to a predicted proportional increase in energy consumption in postsynaptic neurons. Using knowledge of the synapse density in primates combined with data from energy budget experiments in rodents, it is believed that approximately 74% of signaling-related energy consumption in primates occurs in postsynaptic neurons (Attwell and Laughlin, 2001). Therefore, a persistent increase in CMRO2 could be required to restore Na+ and K+ concentration gradients across the cell membrane via the adinosinetriphosphate-dependent Na+ /K+ pump. Similarly, energy may be required to restore Ca2+ concentrations across the cell membranes via the Na+/Ca2+ exchanger (Attwell and Iadecola, 2002). Other smaller energy demanding processes consist of reversing ion gradients generated from the transmission of action potentials, maintaining neural resting potential and recycling neurotransmitters, the sum of which are expected to consume less energy than the above-mentioned postsynaptic ion processes, however.
It is useful to consider these results in light of previous studies using contrast agents. First VASO-measured CBV changes after visual stimulation returned to baseline before the BOLD undershoot returned to baseline (20 ± 5 secs for CBVw versus 33 ± 5 secs for BOLD;
One unexpected result of this study was the finding of smaller BOLD breath-hold signal changes (2.3% ± 0.3%) compared with the BOLD visual signal changes (3.4% ± 0.8%; Method 1). This was especially surprising in view of the lack of a significant difference in CBFw changes between the two tasks and the expectation that there is an increase in oxygen metabolism during neuronal stimulation. As shown in Equation 2, the only explanation for such a reduced BOLD signal during breath hold could be CBV increasing more during breath hold than during visual stimulation, which was in fact observed in the CBVw time courses (Figure 2C). Notice that this is not necessarily counterintuitive, because oxygenation is low in capillaries compared with tissue, and a larger CBV change would decrease the magnitude of the extravascular BOLD effect. It is plausible that CBV reactivity would increase more during breath holding than during visual stimulation because of the larger strain breath-holding places on the vasculature. As no significant discrepancy in CBF change between visual and breath hold was observed, which would be expected in view of the large CBVw change and the often-used Grubb relationship (Grubb et al, 1974) between CBV and CBF, it seems that the additional CBV change during breath hold is occurring in vasculature that may not be spatially related to CBF changes. Thus, the relationship between CBF and CBV in breath hold may not be identical to the relationship that is generally found in visual or motor stimulation. Discrepancies in the relationship between CBV and CBF responses have even been reported for hypercapnia versus hypocapnia experiments (Fortune et al, 1995). Therefore, when calibrating the BOLD effect, it may be necessary to perform a CBV calibration in addition to a CBF calibration.
Contrary to previous studies where the CBVw time course returned to baseline quickly (~ 10 secs) after cessation of stimulus (Lu et al, 2004), we found that the CBV response is somewhat more delayed (~ 20 secs). A likely explanation for this new finding is the longer TR, which was used in the current experiments, which sensitizes the sequence specifically to CBV. At short TR (TRr 3,000 ms), CBF and inflow likely influence the CBVw time course. This delay may be in line with somewhat slow capillary compliance, similar to the tissue results by Yacoub
Finally, several limitations of this study should be noted. First, a different scan repetition time, TR, was used for each imaging modality, which may in principle complicate comparison and interpretation of the signal changes. Specifically, the temporal resolution at which CBF, CBV, and CMRO2 coupling can be interpreted is limited by the TR of the longest (CBVw) scan (TR = 5 secs). However, as the BOLD undershoot persisted for approximately 10 secs after return of CBFw and CBVw signal to baseline, it was possible to reliably identify the uncoupling of CMRO2 from CBF and CBV. Second, as with most fMRI paradigms, there is always the possibility of variability in volunteer compliance. We attempted to minimize variations by having volunteers practice the paradigm before entering the magnet and also by monitoring respiratory rate and EtCO2 during the scan. However, different volunteers will perform the task, especially the breath hold, slightly differently. Finally, BOLD, CBVw, and CBFw reactivity were recorded for identical tasks, but not simultaneously. It is possible that volunteers could have performed different tasks differently, especially toward the end of the experiment when fatigue may have been an issue. We randomized the order of the scans in each volunteer, and therefore any compliance trend over time should not be present in the averaged data.
In conclusion, BOLD, CBVw, and CBFw experiments were performed at 3.0 T in humans to study the dynamics of CBV, CBF, and CMRO2 after both visual stimulation and breath holding. First, it was found that the ultimate return of the BOLD signal to baseline is faster after breath holding than after visual stimulation, where a poststimulus negative signal change occurs. As changes in CMRO2 have been reported to be negligible during short breath holds, the discrepancy in the visual and breath hold poststimulus changes was attributed to CMRO2 changes. This observation is consistent with the BOLD visual poststimulus signal being attributable to continued oxygen metabolism. Second, it was found that the BOLD poststimulus undershoot persisted during a period where the CBVw and CBFw signal returned to baseline, suggestive of changes in CMRO2 in the absence of changes in CBV and CBF. Therefore, CMRO2 may become uncoupled from CBV/CBF after, and potentially during, neuronal activity. An additional finding comparing visual and breath-hold activation showed that even CBV and CBF can be decoupled depending on the stimulation used. This indicates that both CBF and CBV knowledge may be necessary for BOLD calibration experiments using hypercapnia.
Footnotes
Acknowledgements
The authors are grateful to Joe Gillen, Terri Brawner, Katheen Kahl, and Ivana Kusevic for experimental and technical assistance.
The National Center for Research Resources (NCRR) is a component of the National Institutes of Health (NIH). The contents of the paper are solely the responsibility of the authors and do not necessarily represent the official view of NCRR or NIH. Dr van Zijl is a paid lecturer for Philips Medical Systems and is the inventor of technology that is licensed to Philips. This arrangement has been approved by Johns Hopkins University in accordance with its conflict of interest policies.