
Abstract
We investigated vascular changes after stroke using magnetic resonance imaging (MRI) microvascular density (MVD) measurement. T2 and T2 were measured in eight rats before and after injecting an intravascular superparamagnetic iron oxide contrast agent to derive the corresponding transverse relaxation shift. Reliability of MRI for measurement of MVD was compared with corresponding sections immunostained with von Willebrand factor (vWF) 2 weeks after stroke. The intracorrelation coefficient (ICC) and its 95% lower bound (LB) was high in the ischemic recovery region (ICC = 0.753), moderate in the contralateral area of normal brain tissue (ICC = 0.70), and low in the ischemic core (ICC = 0.24). A very good agreement (ICC = 0.85) and correlation (r = 0.90) were observed using only the recovery region and normal contralateral hemisphere (ICC = 0.85; 95% LB = 0.78; P < 0.05). The mean MRI MVD in the center of the core lesion (26 ± 9 per mm2) was lower than in the recovery region (209 ±60 per mm2) or contralateral normal hemisphere (313 ± 32 per mm2). However, large errors in MRI MVD were encountered in the ischemic core. Our data demonstrate that MRI MVD measurements can quantitatively evaluate microvascular changes in the brain tissue after stroke, if the MVD is not extremely low as in the ischemic core.
Introduction
Recent studies in rats have demonstrated that treatment of stroke with pharmacologic and cell-based neurorestorative therapies increases levels of vascular endothelial growth factor, which in turn enhances angiogenesis (Chen et al, 2003; Jiang et al, 2005; Li et al, 2002, 2000; Zhang et al, 2002). Angiogenesis is a primary factor associated with improved neurologic recovery after stroke (Cramer et al, 1997; Jiang et al, 2005; Weiller et al, 1993). Our current understanding of the ischemic cerebral tissue response after restorative treatment has been derived mainly from regional histologic and immunohistologic measurements (Zhang et al, 2005, 2003). However, these methods do not allow dynamic assessment after restorative treatment, as only one measurement can be performed in a given animal.
Magnetic resonance imaging (MRI) permits noninvasive long-term monitoring of tissue and affords superior soft-tissue contrast compared with other imaging modalities. Although contrast can be manipulated by changing the pulse sequence parameters, contrast media are extremely valuable for enhancing image detail. By combining MRI with three-dimensional laser scanning confocal microscopy, we and others have demonstrated that restorative therapy of stroke in rats promotes angiogenesis (Wang et al, 2004; Zhang et al, 2005, 2003), causing a transient elevation of the blood-to-brain transfer constant (Ki) for Gd-DTPA during the early phase of angiogenesis and increasing cerebral blood flow and volume (CBV; Jiang et al, 2005). However, although these MRI measurements may help in locating and staging angiogenesis, they offer only an indirect means of detecting newly formed vessels. Angiogenesis evokes an increase in microvessel density (MVD). Several authors have used MRI to estimate vessel size, and this can be correlated with blood volume as a means of inferring MVD (Wu et al, 2004). The ratio of changes in gradient-echo to spin-echo relaxation rate (ΔR*2/ΔR2) induced by a high molecular weight intravascular contrast agent may provide an indication of average vessel size in a voxel under certain conditions related to echo time (TE), contrast concentration, and main magnetic field (Boxerman et al, 1995; Dennie et al, 1998). ΔR*2/ΔAR2 is a dimensionless ratio, and its expression in terms of tissue model parameters depends not only on vessel size distribution, but also on contrast concentration and the water diffusion coefficient (Jensen and Chandra, 2000). To avoid strong dependency on contrast concentration, Jensen and Chandra (2000) suggested using the quantity Q = ΔR2/(ΔR*2)2/3 an analytic parameter that involves only intrinsic properties of the vascular network, which is sensitive to vessel density but not size. Thus far MRI measurement of MVD has focused on tumor research and has not been applied to angiogenesis during recovery from stroke. In the current study, we measured Q and microvascular density in the ischemic brain using MRI, and validated the data by histologic measurement of MVD. We found that both Q and MVD measurements were useful for evaluating the status of the microvasculature in ischemic brain tissue after stroke, if MVD is not extremely low.
Materials and methods
All studies were performed in accordance with institutional guidelines for animal research under a protocol approved by the Institution Animal Care and Use Committee of Henry Ford Hospital.
Animal Model and Experiment
Male Wistar rats weighing 300 to 450 g (n = 8) were subjected to embolic stroke and investigated using a 7T MRI system. The method we used to induce embolic stroke has been described previously (Zhang et al, 1997). Briefly, an aged white clot (prepared 24 h before ischemia) was slowly injected into the internal carotid artery to block the middle cerebral artery (MCA). This rat model of embolic focal cerebral ischemia provides a reproducible and predictable infarct volume localized to the territory supplied by the MCA (Jiang et al, 1998; Zhang et al, 1997).
Magnetic Resonance Imaging Measurements
Magnetic resonance imaging measurements were performed using a 7 T, 20-cm bore superconducting magnet (Magnex Scientific, Abingdon, UK) interfaced to a console. A 12-cm bore actively shielded gradient coil set capable of producing magnetic field gradients up to 20 G/cm was used. Magnetic resonance imaging images were obtained with two radio frequency coils; a 30-mm surface receiver coil and a 65-mm saddle transmitter coil, actively decoupled by a PIN diode switch. Stereotaxic ear bars were used to minimize movement. Anesthesia was maintained using a gas mixture of N2O (70%), O2 (30%), and isoflorane (1%). Rectal temperature was kept at 37 ± 0.5°C using a feedback-controlled water bath. A tri-pilot scan of the imaging sequence allowed reproducible positioning of the animal in the magnet for each MRI session. A complete set of MRI images was obtained 1 h, 24 h, and 2 weeks after embolization. Each set included diffusion-weighted images, T1-weighted MRI, multiecho T2 and T*2 measurements. Contrast-enhanced T1-weighted MRI was performed after injecting Gd-DTPA at 2 weeks to check for leakage. Contrast-enhanced T2 and T*2 measurements were performed after injecting 20 mg Fe/kg Feridex at 24 h and 2 weeks after onset of embolization.
Measurement of T2
T2 measurements were obtained using standard two-dimensional Fourier transform multislice (13 slices) multiecho (6 echoes) MRI. Six sets of images (13 slices per set) were obtained using TEs of 15, 30, 45, 60, 75, and 90 ms and a repetition time of 5 secs. Images were produced using a 32-mm field of view, 1-mm slice thickness, and 128 × 64 image matrix. The total sequence time was approximately 5 mins.
Measurement of T*2
T*2 measurements were obtained using a multislice (13 slices) multiecho (6 echoes) gradient echo (GE) sequence. Six sets of gradient echoes were obtained using TEs of 4.5, 9, 13.5, 27, 31.5, and 36 ms and a repetition time of 5 secs. Images were produced using a 32-mm field of view, 1-mm slice thickness, and 128 × 64 image matrix. The total sequence time was approximately 5 mins.
Measurement of Diffusion Coefficient of Water
The trace apparent diffusion coefficient of water (ADC) was obtained from the diffusion weighted images, which were obtained using the method described by LeBihan et al (1986) with diffusion gradients in the x, y, and z directions. A two-dimensional Fourier transform multislice spin-echo sequence (13 slices, 32-mm field of view, 128 × 64 matrix, 1.5 secs repetition time, and 40 ms TE) was modified to include two 10-ms diffusion-weighting gradient pulses separated by 18 ms, one on either side of the refocusing 180° radio frequency pulse. The diffusion-weighting gradient was increased in a nonlinear manner from 0 to 74 and 105 mT/m to obtain three images with gradient b-values of 0, 600, and 1,200 secs/mm2. Each set of images in one diffusion gradient direction required a scan time of 5 mins, and the total time needed for the entire three-directional trace map sequence was approximately 15 mins. All MR images were reconstructed using a 128 × 128 matrix. The ADC map was produced on a pixel-by-pixel basis using a least-square fit to the plot of the natural logarithm of normalized image intensity versus gradient b-values.
Measurement of T1
Multislice T1-weighted images were obtained using multislice (13 slices) spin-echo sequences (500-ms repetition time, 8-ms TE, and 4 averages) with a 1-mm slice thickness, 32-mm field of view, and 128 × 128 matrix. Imaging time for the T1-weighted image sequences was approximately 1 min for each sequence. The measurement included two sets of T1-weighted spin-echo images; one set was acquired before an intravenous bolus of 0.1-mmol/kg Gd-DTPA contrast agent and the other after contrast injection.
Tissue Preparation and Histologic Assessment
After the final MRI measurement, animals were deeply anesthetized with ketamine (44 mg/kg intra-peritoneal) and xylazine (13 mg/kg intraperitoneal) and the vascular system was transcardially perfused with heparinized phosphate-buffered saline followed by 4% paraformaldehyde in phosphate-buffered saline. The brain was immersed in 4% paraformaldehyde in phosphate-buffered saline for 2 days, then cut into 7 equally spaced coronal blocks 2-mm thick which were embedded in paraffin for histologic processing. Three adjacent coronal sections 6-um thick from each block were stained with a rabbit polyclonal antibody against von Willebrand factor (vWF; 1:300; DAKO, Carpinteria, CA, USA) to identify blood vessels (Zhang et al, 2002). The brain sections were digitized under a × 40 objective of a light microscope (Olympus B × 40), using a 3-CCD color video camera (Sony DXC-970MD) interfaced with a microcomputer image device analysis system (Imaging Research, St Catharines, ON, Canada). Morphologically intact cerebral vessels (capillaries and other small vessels) were counted in three regions: core lesion, recovery region, and contralateral normal tissue. In each region, 5 nonoverlapping fields on the same region of interest (ROI) were digitized under a light microscope at × 40 magnification in the center of each region, and MVD data were recorded as average number of vessels per square millimeter. A fixed reference histologic section for each animal that matched the MRI slice was also measured (Wang et al, 2004; Zhang et al, 2002). Microvessel counts were determined by a pathologist who was masked to the MRI findings.
Magnetic Resonance Imaging Data Analysis
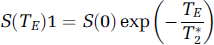
Magnetic resonance imaging data were transferred to a SUN workstation (SUN Microsystems, Santa Clara, CA, USA) for off-line processing. Images were corrected for baseline and reconstructed with in-house software. All postprocessing of the reconstructed images was performed with Eigentool image analysis software (Peck et al, 1992; Windham et al, 1988). Before analysis, the processed T2 and T2 images were smoothed with a 3 × 3 Gaussian filter and a uniformity correction algorithm (Peck et al, 1992; Windham et al, 1988) that corrects for image inhomogeneities. T*2 maps were generated by a least squares fit to a straight line plot of the natural logarithm of image intensity versus the TE-values from the gradient echo images.
Then ΔR*2 maps were computed according to
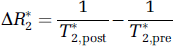
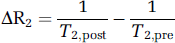
where T*2,pro and T*2,post are the pre- and postinjection relaxation times. Similarly, ΔR2 maps were calculated from pre- and post-T2 values generated by a least squares fit to a straight line plot of the natural logarithm of image intensity versus the TE-values from the spine echo images:
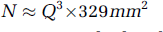
In the normal brain, the relationship between QΔR2/ (ΔR2)2/3 and N is given by Wu et al (2004):
MRI measurements were calculated in three ROIs: the ischemic core, recovery region, and homologous tissues in the contralateral hemisphere. The first ROI, the ischemic core, was identified using the threshold T2 value of mean + 2 s.ds. from the T2 value measured in the contralateral hemisphere on maps obtained 2 weeks after stroke. The ischemic areas in the T2 maps were always smaller at 2 weeks compared with 24 h after stroke. Therefore, the second ROI, the recovery region (Figure 1, r), was identified by subtracting the ischemic core (Figure 1, c) obtained 2 weeks after stroke from the ischemic area on T2 maps obtained 24 h after stroke.
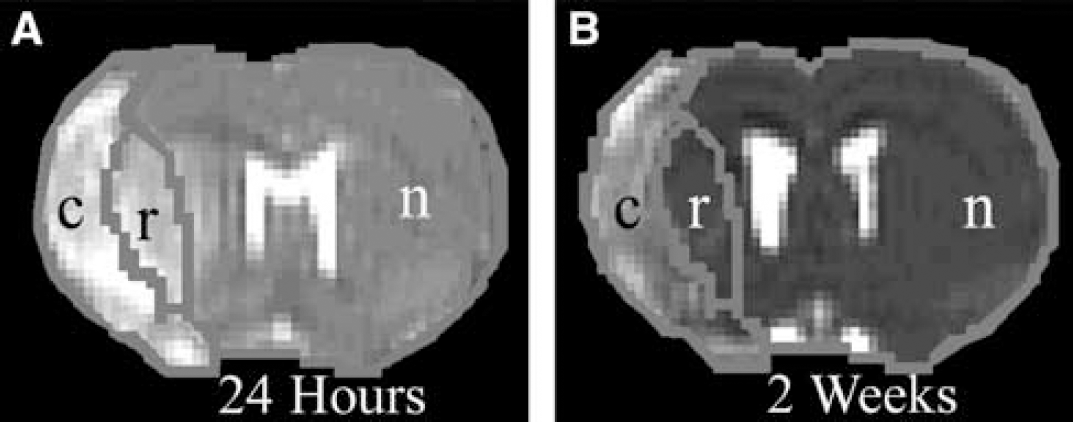
Representative T2 maps indicating the three ROIs for both (
Coregistration or Superimposition of Magnetic Resonance Imaging and Histology
To match MRI to histology, we first bring the two image volumes into the same coordinate system using a linear transformation found by registration methods. Then we match their geometry using a nonlinear mapping found by warping methods. The methods we used in this study are briefly explained and illustrated below.
Registration
The registration method used was a modified version of the surface-matching (head and hat) method (Ghanei et al, 2000; Jacobs et al, 2000, 1999), which registers three-dimensional medical imaging data sets with an average accuracy of less than one voxel (Ghanei et al, 2000). Modifications to the registration algorithm include increasing the number of data points to define the hat more accurately and incorporating a distance transformation to estimate the distance between the head and hat faster. The surface matching is based on matching the same anatomic surfaces from the data sets. The data set that encompasses the largest volume in the study or has the highest resolution is defined as the head, and the other data set is defined as the hat. In this study, histology is used as the head and MRI as the hat. After the head and hat data sets are selected, contour extraction was performed. Contours are found for each slice in the two data sets, using an automated multiresolution method developed by our group (Jacobs et al, 2000, 1999). This method is reproducible and robust in defining contours for registration and has an inter- and intraoperator variability of less than 0.5% (Jacobs et al, 1999).
The registration matrix is found by an iterative search method that minimizes the root-mean-square distance between the intersections of directed rays from the head centroid with the head and corresponding hat points. To ensure that local minima are not encountered, a qualitative registration accuracy check is also performed by visually checking anatomic structures for correct registration of the MRI and histology data sets.
Warping
Because coregistration alone may not accurately match the combined MRI and histologic data sets (coregistration is a Z-direction match and warping is an XY match), warping one data set to the other introduces a nonlinear spatial transformation which is required to correct for anatomic variations between them (Ghanei et al, 2000; Jacobs et al, 1999). The warping method matches similar anatomical contours from MRI to histology automatically using the thin plate splines. Only normal anatomical structures are chosen for warping. The number of visible structures within the MRI data set limits the anatomic contours for warping, which in general are the outer brain surface and corpus callosum in the case of brain (Clarke et al, 1995). Because histopathologic examination is more distorted than the T2 map, the histopathologic examination parameters were warped to fit the T2 map. The warping was performed using SmartMorph software (http://www.meesoft.com). The warping program creates a boundary around the target image (T2 map) and another around the image to be warped (histopathologic examination). The anatomic structures are then visually correlated between the warped histopathologic examination and the T2 map for warping accuracy. After registration and warping, the ADC, T2 and T2 maps were used to overlay the region of interest of the processed histologic sections and obtained mean ADC, T2 and T* values. Figure 2 illustrates the process—an original histologic section (A), a corresponding T2 map (B), and a final processed histology image (C). Homologous ROIs in the ischemic core and recovery region were also measured in the contralateral hemisphere. From each ROI, a 4 × 4 pixel rectangular box was selected in the center of each ROI to measure the MRI parameters and corresponding histologic data. The four ROIs in Figure 2 indicate where the measurements were taken in the ischemic core (a), recovery region (b), and contralateral ROIs (c and d). Figure 3 shows a typical coregistration and warping histologic section with the corresponding T2, relative CBV (rCBV), and N-map from the MRI image at 2 weeks after stroke. The N-map is the MRI MVD map.
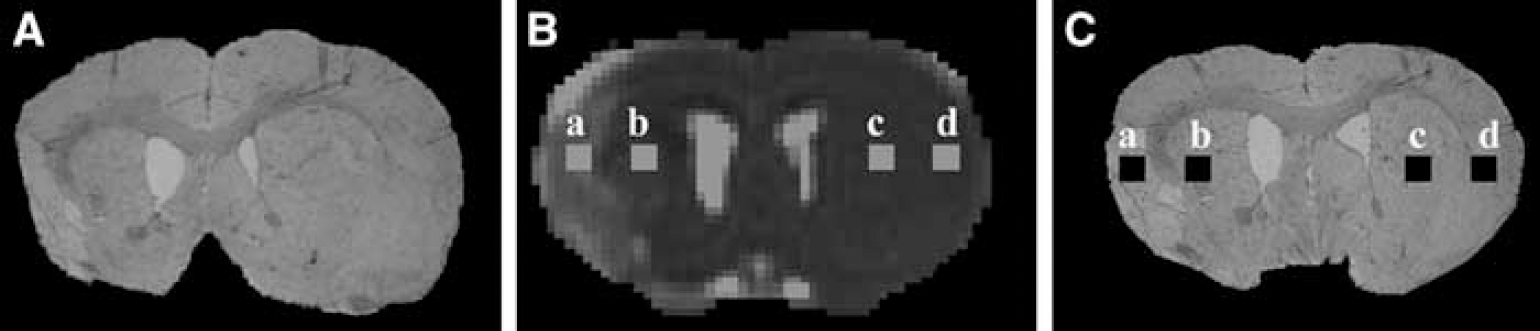
Coregistration of MRI and histology. Histologic sections were coregistered and warped to MRI images of an ischemic rat brain. (
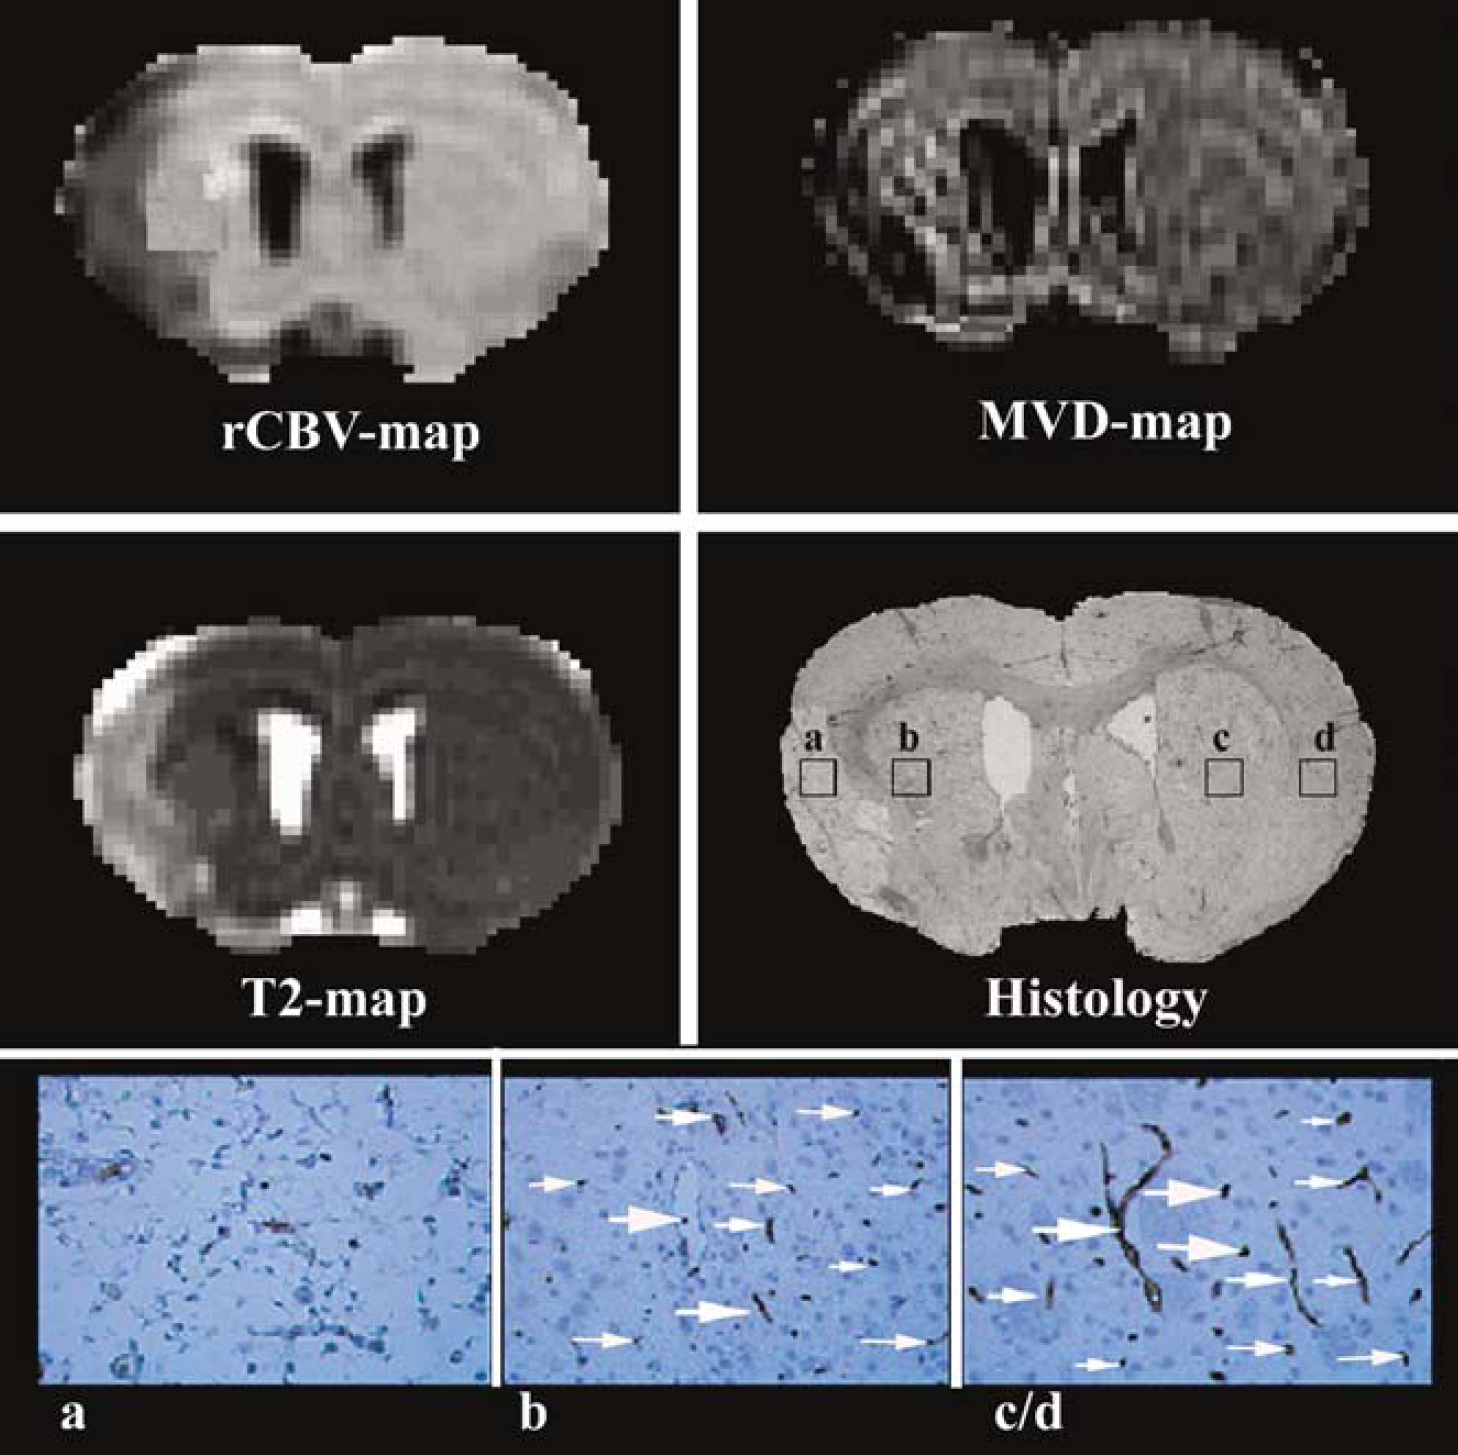
Representative rCBV and MRI MVD maps used to measure the MVD value that corresponds to the same position on the histologic regions of interest where measurements were taken (top row). T2 map of MR image with the corresponding coregistered histologic section at × 1 magnification (middle row). Higher magnification (x 40) light microscopy image shows the number of vessels (arrows) in the various regions of interest: the ischemic core (a), recovery region (b), and contralateral hemisphere (c/d; bottom row).
Statistical Analysis
For each animal, MVD measurements were collected using both MRI and histologic methods from three ROIs (contralateral ischemia, recovery, and core regions); however, the value for the contralateral side is the average of two ROIs. To study the reliability of MRI MVD, the intracorrelation coefficient (ICC) and its 95% lower bound (95% LB) between MRI and histologic evaluation were estimated (Fleiss 1986), adjusting for clustered regions per subject (Legler et al, 1995; Liang and Zeger 1986). Intracorrelation coefficient in a range of 0 to 1 measures agreement beyond chance, where 1 indicates perfect agreement and 0 indicates no agreement between the two methods. The level of agreement can be categorized as low (ICC < 0.40), moderate (ICC 0.40 to 0.70), high (ICC > 0.70), or excellent (ICC > 0.90). Intracorrelation coefficient is calculated at each ROI when overall agreement is significant at the critical value of 0.05. A generalized estimating equations (GEEs) approach was used to determine the r value. The GEE approach is a method of estimation of regression model parameters when dealing with correlated data. Repeated analysis of variance was used to test differences in MVD among regions. This involves testing for a region effect, followed by a pair-wise comparison between regions if a region effect is detected at P =0.05.
Results
Appearance of Ischemic Lesions on Apparent Diffusion Coefficient of Water and T2 Map
All rats subjected to MCA occlusion developed ischemic lesions in the ipsilateral hemisphere, seen as decreased ADC in the territory supplied by the MCA 1 h after stroke (Figure 4). Lesion size was increased at 24 h as demonstrated on the T2 map.
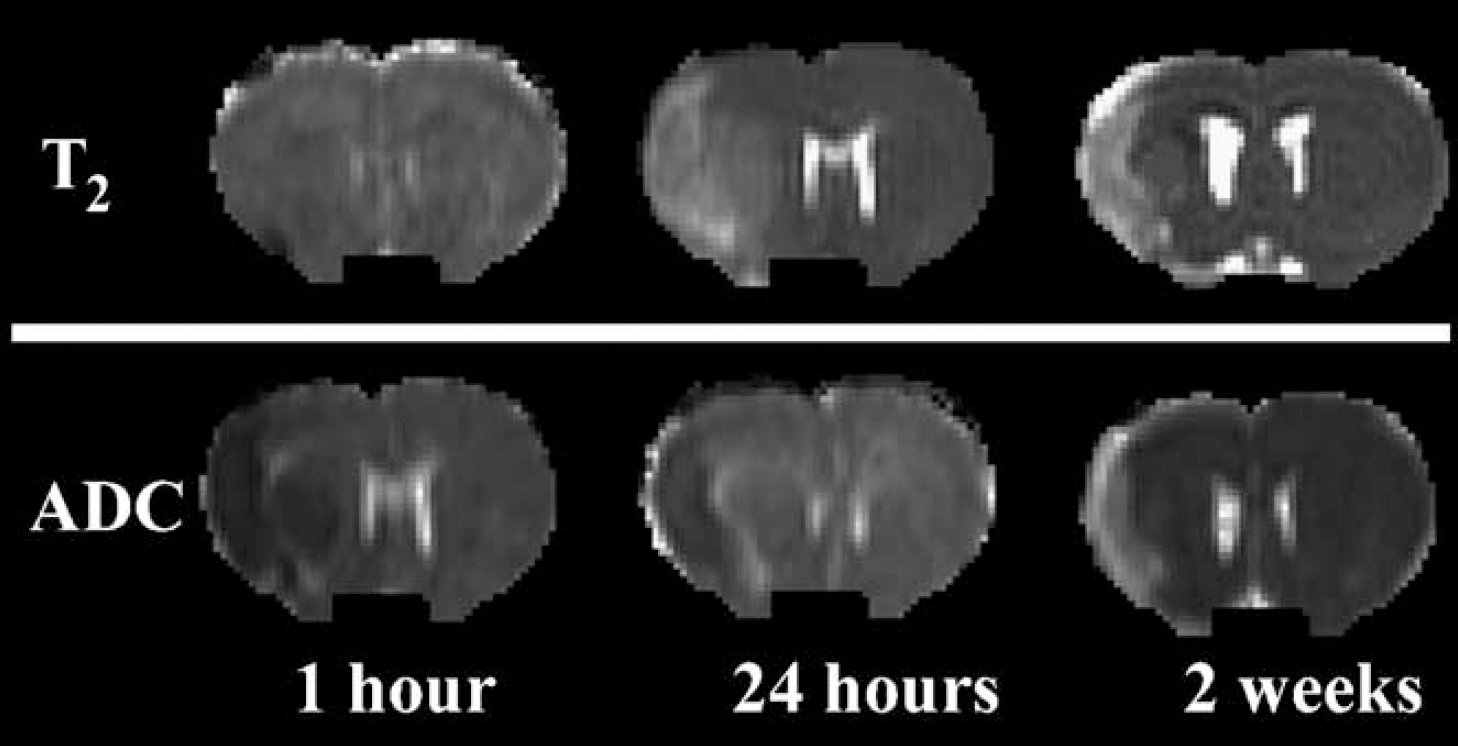
Representative NRI set of T2 and ADC maps were obtained 1 h, 24 h, and 2 weeks after middle cerebral artery occlusion.
The core lesions seen on the T2 and ADC maps 2 weeks after MCA occlusion were smaller than they were at 24 h, and both ADC and T2 were increased.
Evaluation of Microvascular Density
Figure 3 (top row) shows representative rCBV and MRI MVD maps obtained 2 weeks after stroke. The average MRI MVD values were 313 ± 32, 209 ± 60, and 26 ± 14 per mm2 in the contralateral normal hemisphere, ischemic recovery region, and ischemic core, respectively, whereas MVD values measured by vWF immunoreactive staining were 296 ± 42, 213 ± 72, and 8 ± 3 per mm2. T1-weighted MRI measured before and after Feridex injection showed little or no leakage 2 weeks after stroke.
Reliability of Magnetic Resonance Imaging Microvascular Density Measurement
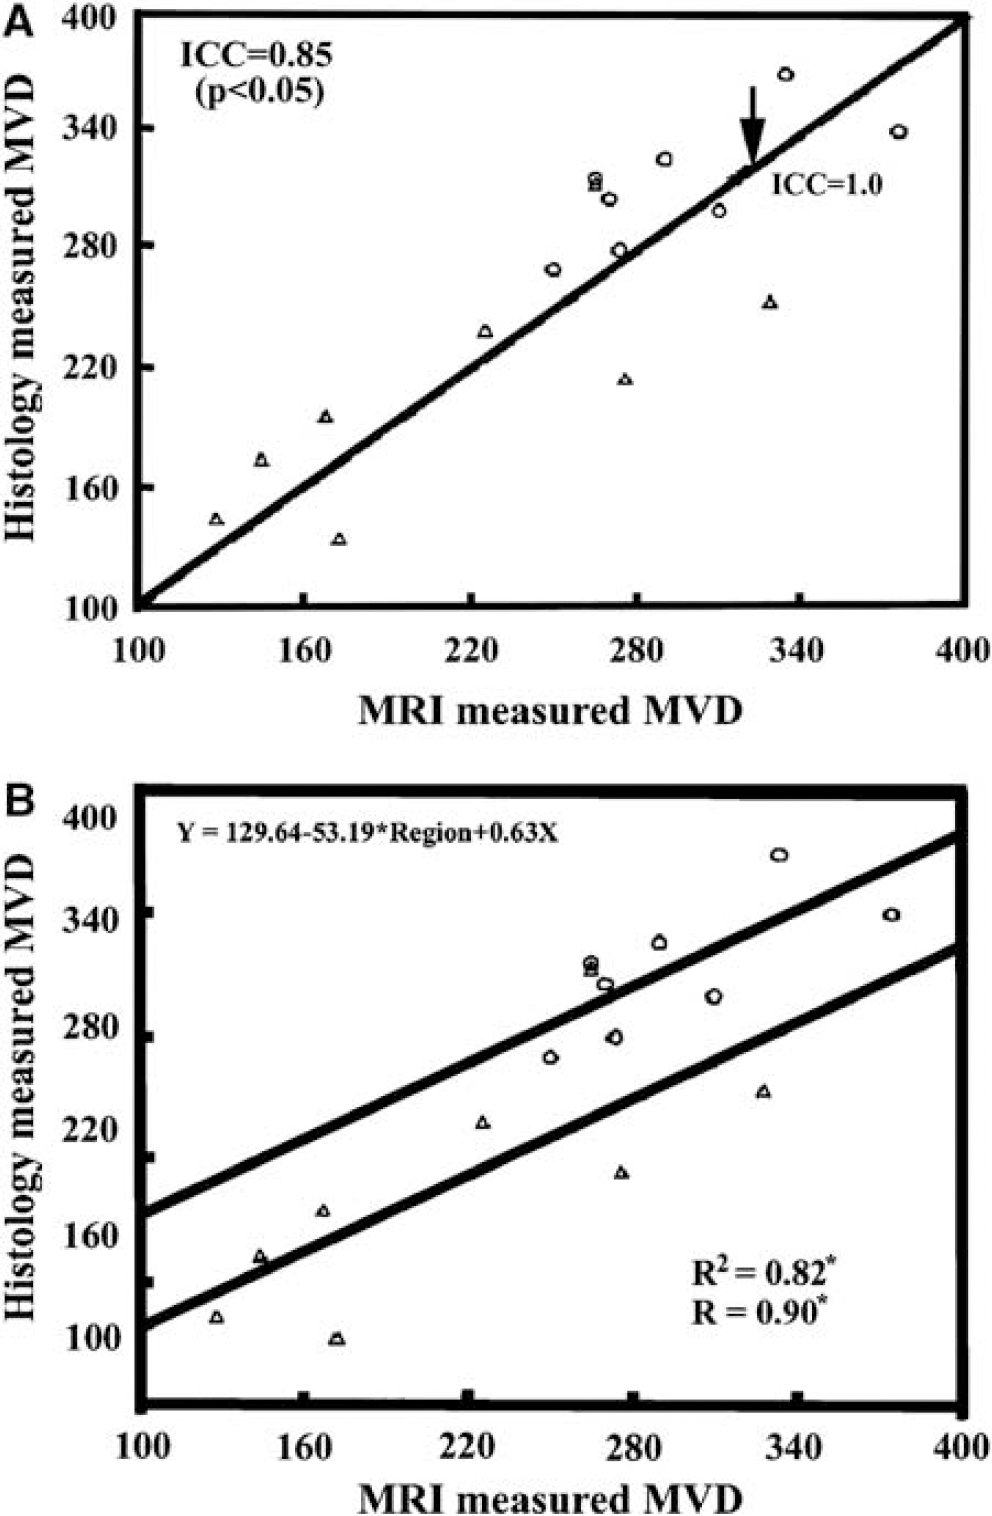
Figure 5A shows paired MVD measurements by MRI and vWF staining in the ischemic recovery and contralateral normal ROIs. After adjusting for repeated region measurements, very good agreement was observed between MVD measurements by MRI and vWF staining in the recovery region and normal contralateral hemisphere (ICC = 0.85; 95% LB = 0.78; P < 0.05). The arrow indicates the line with ICC = 1. The ICC values for the individual regions are not shown in Figure 5A. The direct comparisons of MRI MVD and the histology MVD for each of the regions show good agreement in the normal tissue region (ICC = 0.70; 95% LB = 0.20; P &t 0.05) and the recovery region (ICC = 0.753; 95% LB = 0.30; P < 0.05), but the ICC was low in the core (ICC = 0.24; P = 0.33). Magnetic resonance imaging MVD in the recovery region and normal contralateral hemisphere was also compared with histopathologic examination MVD using a generalized GEEs approach with R = 0.90 and R2 as 0.82 for the model goodness-of-fit after adjusting for regional factors (Figure 5B). The GEE approach also indicates a strong correlation between these two methods. The correlation analysis between MRI ΔR*2 (proportional to rCBV) and histopathologic examination MVD is shown in Figure 6. The correlation coefficient (R) between MRI AR* and histopathologic examination MVD was 0.79 and R2 was 0.62 which is less than the correlation between MRI MVD and histopathologic examination MVD.
(
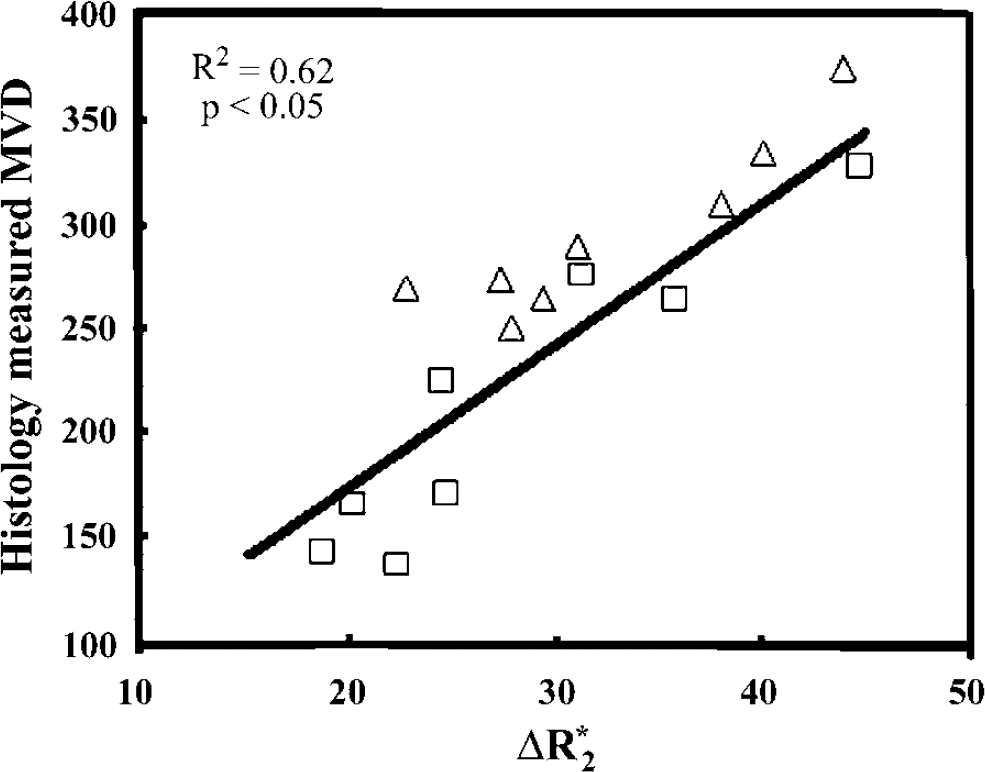
Correlation between histologic MVD and MRI relative cerebral blood volume obtained from the changes in 72 relaxation shift measurements of was observed (R = 0.77 and R2 = 0.62 in two regions of interest (ROI), the recovery region (□) and normal contralateral region (Δ).
Discussion
The present study demonstrates that MRI Q and MRI MVD-maps measurements, based on the shift in the relaxation rate caused by injection of an intravascular contrast agent, can be used to quantitatively investigate changes in the cerebral microvasculature induced by ischemia for brain tissue without very low MVD. Magnetic resonance imaging MVD correlated highly with MVD measured by the gold standard, histologic staining, in both the recovery region and normal tissue. However, MRI MVD did not correlate with MVD measured by histologic staining in the ischemic core. The MRI MVD values in the normal brain are compatible with published data (Klein et al, 1986; Weiss et al, 1982). Our findings suggest that MRI MVD could be a very important physiologic measurement of vascular remodeling after stroke, save perhaps for the ischemic core where MVD was extremely low. Our findings further suggest that MRI MVD measurement has higher correlation with histologic MVD than MRI rCBV.
We found that MVD measured by MRI MVD map in the ischemic recovery region and normal brain correlated highly with histologic measurements of MVD and could be used to evaluate vascular remodeling after stroke. Microvascular density in the recovery region was less than in the contralateral ROI. Microvascular density of the recovery region was measured using a 4 × 4 pixel ROI at the center, which is not equal to angiogenic tissue. Only a small portion of the recovery region is angiogenic tissue (Jiang et al, 2005; Li et al, 2006). Although part of ischemic region recovered with pseudonormalized T2, most the recovery regions have lower MVD than that in the contralateral hemisphere. The angiogenic regions with increased MVD only occupies a small portion of the recovery region (Li et al, 2006).
The Q value of 0.98 ± 0.13 per sec1/3 in the contralateral hemisphere is higher than that found by Jensen and Chandra s value (0.72 ± 0.21 per sec1/3) for the contralateral rat brain (Jensen and Chandra, 2000). However, it is in good agreement with Wu et al s value of 0.95 ± 0.05 per sec1/3 for the whole mouse brain (Wu et al, 2004) and 1.04 ± 0.07 per sec1/3 for the rat cortex measured by Tropres et al (2004). In the current study, the average MRI MVD obtained for normal tissue (313± 32 per mm2) is also compatible with the histologic MVD (296 ± 42 per mm2). Unlike previous studies, we directly compared MVDs measured by MRI and histology from the same animals. Our data showed high ICC agreement between MRI and histologic MVD in both the recovery region and normal brain. The core should be free of functional microvessels, and very few nonfunctional microvessels were visible (8 ± 3 per mm2).
Crucial unsolved questions in the field of neurorestorative treatments for stroke include how to noninvasively localize angiogenesis and follow its evolution during recovery from stroke and the relationship between vascular remodeling and functional recovery. Stroke patients with a higher cerebral blood vessel density appear to make better progress and survive longer than patients with a lower vascular density (Slevin et al, 2000). Angiogenesis and vasculogenesis are complex processes by which new capillaries form by sprouting from preexisting vessels or de novo, respectively (Risau, 1998). These newly formed cerebral vessels are inherently leaky, as it can take several weeks to form a functional blood-brain barrier (BBB). Monitoring changes in blood volume over time may reflect the growth of new blood vessels and therefore both angiogenesis and vasculogenesis (Hawighorst et al, 1998; Pathak et al, 2001). There is a significant correlation between dynamic contrast enhanced MRI measurements of blood volume and histologic determination of MVD in angiogenic hotspots (Hawighorst et al, 1998; Pathak et al, 2001). Using MRI in combination with three-dimensional laser scanning confocal microscopy images, we demonstrated that restorative therapy of stroke in rats correlates with increased cerebral blood flow, CBV, and blood-to-brain transfer constant (Ki) for Gd-DTPA (Jiang et al, 2005; Zhang et al, 2002). These MR measurements identify the location and area of vascular remodeling and angiogenesis. However, an inherent flaw in the correlation of CBV with vascular remodeling may come from the increased vessel diameter, resulting in an increased blood volume fraction that does not necessarily reflect increased number of vessels as determined by mean vascular density (MVD; Neeman, 2002). The current MRI MVD measurement can provide a direct comparison between MRI MVD and histologic MVD and can correct the flaw in rCBV measurements after stroke. Further investigation indicates that the correlation between MRI and histology is better when using MVD, than with rCBV. Also, the area of elevated Ki measured after restorative therapy over-estimates the size of the areas of vascular remodeling seen on the histologic section (Jiang et al, 2005; Li et al, 2006). Magnetic resonance imaging estimates of cerebral blood flow, CBV and Ki are only indirect measures of vascular changes; however, MRI MVD is capable of measuring microvascular remodeling directly and can provide true physiologic information about the location and intensity of vascular changes.
The Q values we obtained were limited by the assumption that there was no BBB contrast leakage. The Q index and MRI MVD map may induce errors if BBB leakage occurs after the contrast agent is applied. Leakage into the extravascular space alters the susceptibility difference between extra- and intravascular spaces and also T1 and T2 because of the direct interaction of extravascular water molecules with the contrast agent. However, contrast extravasation because of disruption of the BBB also affects CBV estimates obtained with standard dynamic contrast susceptibility imaging, and techniques developed to correct for this could be adapted for MVD estimates as well (Boxerman et al, 2006). Very little leakage of contrast agent should not significantly affect MVD measurements in the recovery region or normal tissue where MVD is relatively large, but will lead to large errors in the ischemic core where MVD is very small. A higher dose of contrast agent will decrease the signal-to-noise ratio, resulting in some loss of vessel and tissue detail, and most likely this would reduce image quality even further (Laghi et al, 2004; Yang et al, 2005). Other factors affecting measurement of low MVD in the ischemic core may involve the relatively low signal-to-noise ratio of ΔR2 and ΔR*2 (3.8%; Laghi et al, 2004; Yang et al, 2005). The MVD values measured by vWF immunoreactive staining are for both functional and nonfunctional vessels in all regions. Nonfunctional microvessels will further increase the errors in the ischemic core. Because of the large molecular size of the agent, the error introduced by permeability of the BBB can be assumed to be low. However, the presence of free contrast agents in the necrotic tissue cannot be ruled out. Therefore, caution should be used when interpreting the MRI signals inside the core lesion.
Excellent agreement (ICC >80%) was observed in two ROIs (normal tissue and recovery region); the 95% LB exceeded 70% after adjusting for the correlated regions per subject, and agreement was better than that for each individual region because power was gained after the data were pooled as well as the consistent agreements among regions. The poor agreement in the core region could be a source of unstable estimates with both methods, given the lesser quantity of necrotic tissue.
In general, there are several reasons why an MRI estimate for the MVD N may deviate from the histologic value. First, in the theoretical model the vascular network is idealized as a random distribution of cylinders of infinite length. However, this assumption can be different from the actual vascular morphology, which might cause the estimate to deviate slightly. The model of the vascular network neglects vessel curvature (Pawlik et al, 1981). Second, the normal tissue contains large vessels (e.g., macrovessels), which could undermine the conditions of the theory and underestimate MVD. The underlying theory assumes a fractional blood volume of much less than unity, which is unlikely in normal tissue containing large vessels. Third, the model assumes isotropic diffusion, which may be a poor approximation for some tissues such as white matter. To overcome this, a diffusion tensor model may better estimate MVD. Finally, histologically determined microvessel densities can depend significantly on the methodology used. The histologic technique we used detects all vessels (perfused and nonperfused), whereas MRI is only sensitive to perfused vessels (i.e., those accessible to the contrast agent). Microvascular density might be improved by using a combination of histologic techniques to not only allow visualization of all vessels, as was performed here, but also distinguish those that are actually perfused.
In conclusion, our data demonstrate that the MRI MVD map is a useful tool for quantifying MVD in vivo and that MRI MVD agrees highly with histologic MVD both in the recovery region and normal brain with high MVD. Microvascular density agreement was high in the recovery region, moderate in the contralateral hemisphere, and low in the ischemic core. Microvascular density is a physio logic measurement directly related to vascular remodeling, which is a key factor in functional recovery after stroke. Thus, MRI MVD could play a significant role in the diagnosis, therapeutic strategy and management of stroke and other disease processes associated with vascular remodeling.
Disclosure/conflict of interest
These authors state not conflict of interest.