
Abstract
AHA guidelines recommend use of perfusion imaging for patient selection in the 6–24 h window. Recently, the safety of gadolinium-based contrast agents for MR perfusion imaging has been questioned based on findings that gadolinium accumulates in brain tissue. Regulatory bodies have recommended to limit the use of gadolinium-based contrast agents where possible. Focusing specifically on the time to maximum of the tissue residue function (Tmax) parameter, used in DAWN and DEFUSE 3, we hypothesized that half-dose scans would yield a similar Tmax delay pattern to full-dose scans. We prospectively recruited 10 acute ischemic stroke patients imaged with two perfusion scans at their follow-up visit, one with a standard dose gadolinium followed by a half-dose injection a median of 7 min apart. The brain was parcellated into a grid of 3 × 3 regions and the mean of the difference in Tmax between the 3 × 3 regions on the half- and full-dose Tmax maps was 0.1 s (iqr 0.38 s). The fraction of brain tissue that differed by no more than ±1 s was 93.7%. In patients with normal or modest Tmax delays, half-dose gadolinium appears to provide comparable Tmax measurements to those of full-dose scans.
Introduction
The DAWN and DEFUSE 3 acute stroke trials demonstrated overwhelming benefit of endovascular treatment up to 24 h after stroke onset when patients are selected by MRI or CT perfusion imaging.1,2 AHA guidelines now recommend use of perfusion imaging for patient selection in the 6–24 h window, which will likely increase the number of sites that use perfusion imaging, previously estimated to be just over 50% of sites. 3 In Europe, Asia, and some centers in North America, MRI remains the first-line imaging modality for acute ischemic stroke. Recently, the safety of gadolinium-based contrast agents that are used for dynamic susceptibility contrast (DSC) MR perfusion imaging has been questioned, based on findings that gadolinium accumulates in brain tissue. 4 At this point, there is no clear understanding as to how long the gadolinium resides in brain tissue, but initial studies suggest either no or slow washout. 5 There is also no indication that the accumulation is neurotoxic at this point. 5 While it remains unclear whether there is neurotoxicity associated with gadolinium accumulation, regulatory bodies have recommended to limit the use of gadolinium-based contrast agents where possible.6,7
Previous reports have indicated that a reduction in gadolinium dose by 50% still provides perfusion maps of comparable diagnostic quality to full-dose perfusion maps, but none of these reports focused on the specific perfusion post-processing methodology employed in DAWN and DEFUSE 3.8–10
Focusing specifically on the Time to maximum of the tissue residue function (Tmax) parameter, which was used for determination of hypoperfusion and tissue-at risk in DAWN and DEFUSE 3, we hypothesized that half-dose scans would yield a similar Tmax delay pattern to full-dose scans. 11
Materials and methods
Patient selection
We prospectively included 62 patients with a clinical diagnosis of acute stroke presenting to our institution between August 2014 and June 2016 who were part of the NIH-funded SENSitivity Encoding 3 (SENSE 3) stroke imaging study investigating the use of multi echo MRI sequences. In SENSE 3, a subset of acute ischemic stroke patients received two perfusion scans upon their follow-up visit within five days of the acute event using an experimental combined spin and gradient-echo (SAGE) multi-echo sequence. Two successive scans were acquired with the purpose of comparing the influence of dose on perfusion imaging metrics (1) full-dose gadolinium scan and (2) half-dose scan respectively, and this patient subset comprised the population of the current study. The study followed the ethical principles of respect for persons, beneficence, and justice as set forth in the Belmont Report and was approved by the local Institutional Review Board (Stanford Research Compliance Office). All patients or next of kin signed the informed consent.
Imaging protocol
All MRI scans were performed on a clinical inpatient 3 T unit (Discovery MR750w, GE Healthcare, Waukesha, WI).
Scan parameters were as follows: (i) GRE-DSC PWI: Single-shot GRE EPI, TR =1800 ms, 60 time points, 14 slices, FOV = 24 cm, 6 mm/2 mm gap, flip angle = 80°, matrix = 84 × 84, spectral-spatial water-only excitation, 3× parallel imaging, TE1 = 17 ms, TE2 = 35 ms, TE3 = 65 ms, TE4 = 84 ms, and spin-echo TE =103 ms.
The second echo of the experimental SAGE sequence has similar sequence parameters to the standard GRE-PWI sequence, so for the purpose of this study we generated perfusion maps based on just the second echo and the sequence is equivalent to a standard clinical sequence, producing equivalent Tmax parameter maps and volumes as previously shown. 12
Injection protocol
Patients were administered a full dosage of 0.2 mL/kg bodyweight of gadolinium (529 mg/mL, MultiHance, Bracco, Melville, NY). For a 100 kg person, this amounts to 20 mL, which was injected at an injection flow rate of 4–5 mL/s and followed by a 25 mL saline flush at the same flow rate. After approximately 7 min, a half-dose injection followed in which volume of the full dose was halved, while all other injection and flush settings were kept identical. A scan delay of 15 s (after start of bolus injection) was used.
Imaging analysis
Perfusion maps were calculated using the fully automated perfusion software (RAPID 4.7, iSchemaView, Menlo Park, CA). For cases where the software chose different anatomical locations of the Arterial Input Function (AIF) on the half- and full-dose scans, the AIF was manually re-selected to be in the same location on both scans in order to minimize any differences related to AIF positioning. In cases with severe patient movement, where certain time frames could not be properly realigned by the built-in motion correction, those individual frames were removed and replaced by interpolation between the adjacent frames.
The half- and full-dose scans were co-registered using rigid body transformation between the pre-bolus baseline average images (Elastix 4.18). 13 The half-dose Tmax map was then resampled to match the full-dose Tmax map.
We then created a parcellation of the brain into a grid of 3 × 3 regions and measured the average Tmax value pairs from the half- and full-dose scans. Comparing 3 × 3 regions instead of pixels-wise correlation leaves the analysis more robust to minor misregistration issues.
A two pixel rim at the edge of the brain was excluded from the analysis to avoid spurious Tmax values that may emanate from patient motion even after motion correction of the dynamic data. The ventricles were also excluded from the analysis. Both of these regions are also typically excluded by clinical software packages for the same reasons.
A scatter plot of the half-dose versus full-dose measurements was generated for each patient and the following measurements were obtained: (1) mean of the difference in Tmax between the 3 × 3 regions on the half- and full-dose Tmax maps; (2) standard deviation of Tmax differences; and (3) the fraction of brain tissue (as measured by 3 × 3 regions) that differed by no more than ±1 s between the full- and the high-dose scans.
Results
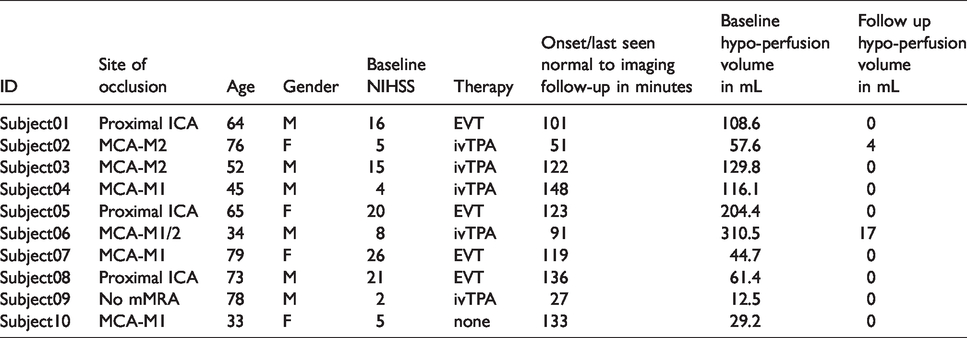
Table 1 shows the clinical and imaging characteristics and Table 2 compares the half-dose versus the full-dose scans. Ten patients were imaged with both full-dose and half-dose gadolinium a median (iqr) of 7 (6.9–7.6) min apart.
Clinical and imaging characteristics.
Quantitative comparison between full- and half-dose scans.
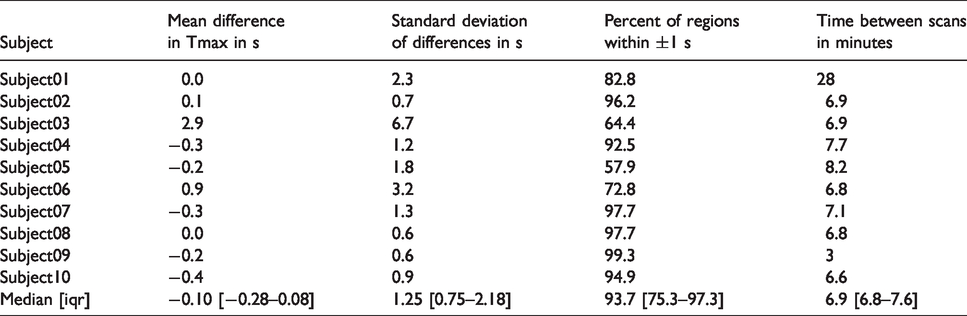
The median (iqr) difference in Tmax values between full-dose and half-dose was 0.1 s (−0.08–0.28). The spread of the differences had a median (iqr) standard deviation of 1.3 s (0.8–2.2). A median (iqr) of 93.7% (75.3–97.3) of the brain was within ±1 s agreement in Tmax. Tmax maps, scatter plots of Tmax correspondence, AIF curves and plots showing motion over time can be found in the online supplements section for each of the 10 subjects (Subject 2 is shown in Figure 1).
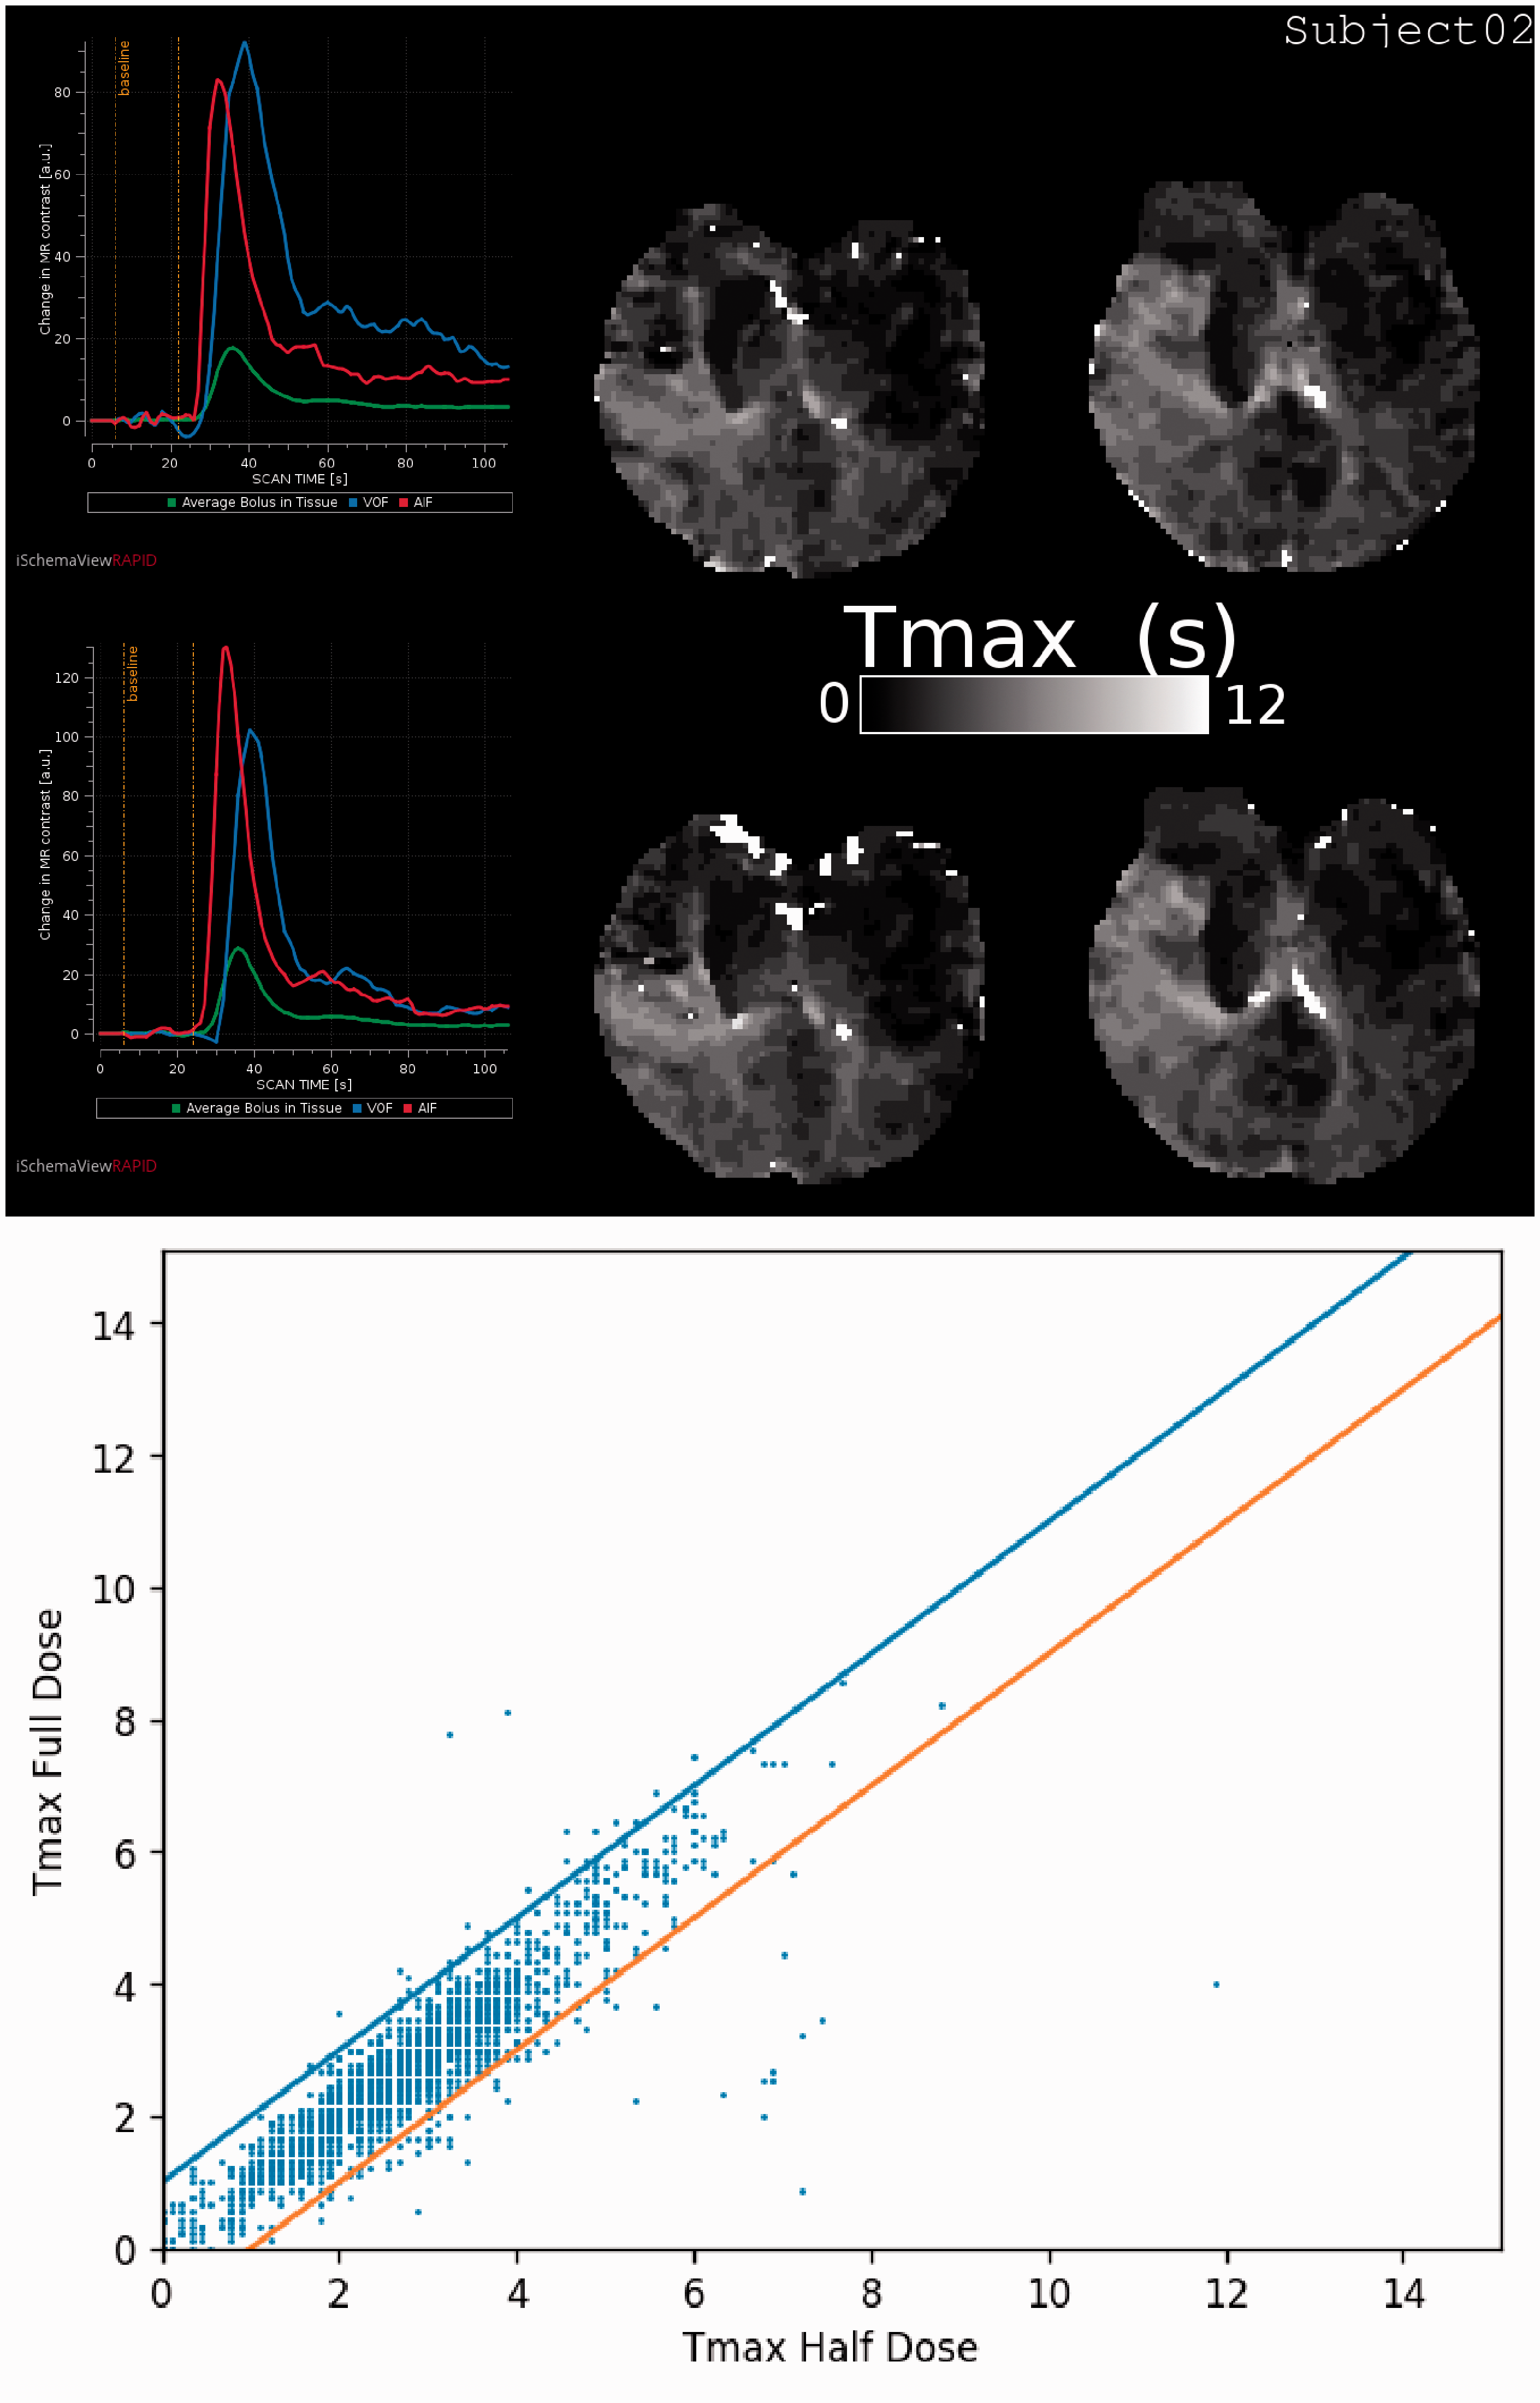
Rows 1 and 2: AIF (left) and Tmax map (middle and right) of the half-dose scan with the full-dose scan below it from Subject 2. Row 3: Scatter plot of Tmax values for half-dose versus full-dose PWI. The lines represent the ±1 s agreement bounds. Note that most of the high valued white “speckle” areas in the second row are excluded in both the numerical analysis and in the plot as a result of the edge and ventricle exclusion criteria.
Qualitatively, focusing on the pattern of the Tmax map, six cases were in good agreement (Subjects 2, 4, 7, 8, 9 and 10). Quantitatively, these six cases all showed that more than 90% of the brain had Tmax differences within ±1 s. In contrast, the four cases with poorer visual agreement had concordance below the 90% mark (Subjects 1, 3, 5 and 6). Of the four cases with inferior agreement, three had significant motion (Subjects 1, 3 and 6) that could not be entirely corrected for, leaving many regions with visible motion artefacts. In Subject 5, the AIF profiles markedly differed between the two PWI scans, with a much broader and shallower profile for the half-dose scan, likely attributable to a change in the patient’s cardiac output between both scans or circumstances related to the injection. In comparison, the AIF width was comparable between the full- and half-dose scans in the nine other patients as can be seen in the Supplemental Material.
Discussion
The quantitative comparison was in good agreement with the visual impression of the concordance and indicated small differences in Tmax in 6 out of 10 cases. In the four cases with larger discrepancies, the difference was attributable to severe motion (resulting in inaccurate Tmax maps) in three cases. In the remaining case, the half-dose scan had an unusually broadened bolus. This was an unexpected finding since half the injected gadolinium volume should theoretically result in a slightly narrower bolus. We speculate that the contrast injection rate was slower than in the study protocol as a result of intravenous line malfunction which limited the free passage of contrast.
The low bias and small differences in Tmax values between full and half dose suggest that Tmax > 6 volumes will be sufficiently accurate on half-dose scans. However, due to time constraints in the acute workup, our study was performed on MRI studies obtained after patient treatment. As shown in Table 2, only 2 of the 10 subjects had perfusion lesions at follow-up and both of these were small. This design limits our ability to compare the key parameter, the volume of Tmax > 6 s, between the full- and half-dose gadolinium studies, and it is not possible to extrapolate these findings to regions with abnormal perfusion. Furthermore, acute stroke perfusion deficits exhibit abnormally low cerebral blood flow and cerebral blood volume secondary to decreased perfusion and an associated decreased amount of contrast agent into the tissue. It is therefore conceivable that the hypo-perfused region of half dose scans might be more likely to approach the noise floor than for full-dose studies, which may render these regions noisier and more prone to artefacts such as mis-segmentation. The second scan is likely subject to a small concentration of gadolinium from the initial injection. Since the contrast agent concentration is derived from signal decrease relative to baseline signal, any overall signal drop caused by contrast remaining from the initial scan will not affect the measurements as long as the contrast level is reasonably constant and small enough as to not cause signal drops towards the noise floor. Both assumptions seem to be met and inspection of the AIF plots revealed no issues with concentration drifts or signal drop out.
We performed manual AIF selection in the cases where the AIF was not automatically chosen in the same vessel. The choice of vessel for AIF selection is known to have some effect on the calculated maps in acute stroke patients. We also removed frames (in three subjects, the gray shaded areas in the AIF plots in the supplemental material) where motion introduced jumps in the concentration time curves and the software then recalculates the concentration time curves by interpolation. We consider both the manual AIF selection and the removal of frames as salvage strategies that help us compare dose differences instead of motion differences. It would be appropriate to consider if these manual interventions could bias the study by exaggerating the agreement between scans, but we consider this unlikely: In the case of the AIF selection, the Tmax map by definition reflects delay relative to the site of AIF selection, so the AIF selection needs to be identical in order to avoid AIF bias. In the case of the interpolation of concentration times, removal of timepoints will remove information and would tend to remove similarity of two scans otherwise in agreement, so we do not believe this could introduce an agreement with positive bias. Finally, the AIF selection and frame removal were done once, blinded to the results of the other scan, so there was no option to adjust selections to obtain better similarity.
Our study is small, but it provides important information for future studies. The Tmax correspondence is in many cases high, with very similar appearance and numerical values of the calculated Tmax maps indicating that half dose is a possibility that warrants further examination in larger studies. Future studies should ideally focus on pre-treatment MR scans so as to directly demonstrate similarity of the calculated perfusion lesion volumes, which is key for patient selection. From a feasibility viewpoint, since adding additional imaging to an acute stroke protocol can be problematic, a study in post treatment patients with persisting lesions may also provide reassurance that lesion volumes are comparable. Our results also suggest that motion and bolus injection protocol can exaggerate the difference in Tmax between scans. For this reason, future studies should also carefully prespecify large motion and bolus injection profile differences as exclusion criteria since both effects may introduce more variation in Tmax than the contrast dose. Most software packages can quantify the degree of motion and thresholds for which level of motion is acceptable could be prespecified.
In patients with normal or modest Tmax delays, half-dose gadolinium appears to provide comparable Tmax measurements to those of full-dose scans. Larger studies in patients with acute hemodynamics deficits and detailed exclusion protocols are needed to demonstrate the viability of using half-dose gadolinium in the acute phase.
Supplemental Material
JCB914537 Supplemental Material - Supplemental material for Comparison of Tmax values between full- and half-dose gadolinium perfusion studies
Supplemental material, JCB914537 Supplemental Material for Comparison of Tmax values between full- and half-dose gadolinium perfusion studies by Søren Christensen, Shalini Amukotuwa, Maarten G Lansberg, Stephanie Kemp, Jeremy J Heit, Michael Mlynash, Michael P Marks, Greg W Albers and Roland Bammer in Journal of Cerebral Blood Flow & Metabolism
Footnotes
Funding
The author(s) received no financial support for the research, authorship, and/or publication of this article.
Declaration of conflicting interests
The author(s) declared the following potential conflicts of interest with respect to the research, authorship, and/or publication of this article:
Søren Christensen: iSchemaView equity.
Greg Albers: iSchemaView equity and consulting.
Roland Bammer: iSchemaView equity.
Authors’ contributions
Søren Christensen analyzed the data, extracted quantitative metrics and drafted the manuscript. Shalini Amukotuwa and Roland Bammer designed the research study, managed data collection and made critical revisions to the manuscript. Maarten G Lansberg, Stephanie Kemp, Jeremy Heit, Michael Mlynash, Michael Marks and Greg Albers all helped with design of the study and made critical revisions to the manuscript.
Supplemental material
Supplemental material for this article is available online.
References
Supplementary Material
Please find the following supplemental material available below.
For Open Access articles published under a Creative Commons License, all supplemental material carries the same license as the article it is associated with.
For non-Open Access articles published, all supplemental material carries a non-exclusive license, and permission requests for re-use of supplemental material or any part of supplemental material shall be sent directly to the copyright owner as specified in the copyright notice associated with the article.