
Abstract
To investigate the changes of the ischemic lesion in rat brain after subventricular zone (SVZ) cell transplantation and the influence of the grafted cells on the appearance of angiogenesis, Svz cells, superparamagnetically labeled, were intracisternally transplanted into the rat brain 48 h after onset of embolic stroke. A complete set of magnetic resonance (MR) images was acquired for all animals with (n = 8) and without (n = 3) cell grafting at approximately 24 h, 72 h, and weekly for 6 weeks after stroke. Transplanted cells were tracked by high-resolution three-dimensional gradient-echo images and the interaction between the cells and ischemic lesion was detected by ISODATA (Iterative Self-Organizing Data Analysis Technique Algorithm) calculated from T1, T2 and T1sat maps. Tissue status from ISODATA was characterized by a specific signature, which represents the deviation from normal tissue in the feature space. Transplanted SVZ cells selectively migrated towards the ischemic side of the rat brain and approached the lesion boundary within 1-week after grafting. Cell treated rats exhibited a significant reduction of average lesion size compared with control rats (P < 0.05). A significant reduction of tissue signature (P < 0.001) induced by cell transplantation was localized to the position of grafted cells, and these sites exhibited stably restored cerebral blood flow (CBF) (approximately 85% of normal CBF). Angiogenesis was present in sites either immediately adjacent to or surrounded by the grafted cells. Our data indicate that map-ISODATA accurately and dynamically characterizes the ischemic lesion and its response to cell therapy.
Introduction
Cell therapy has been used as a treatment strategy to reduce brain dysfunction induced by ischemia (Chen et al, 2004, 2001; Zhang et al, 2002; Li et al, 2002; Borlongan et al, 1998) and neurodegenerative diseases (Borlongan et al, 1999; Lindvall et al, 1990). The beneficial effects of various cell therapies on ischemic stroke include the enhancement of angiogenesis and neurogenesis (Chen et al, 2004; Mezey et al, 2003; Zhang et al, 2002), and the subsequent improvement of neurologic functional recovery (Chen et al, 2004, 2001; Li et al, 2002; Borlongan et al, 1998). The induction of brain plasticity after stroke by cell-based therapies has been primarily showed using histological and immunohistological methods (Chen et al, 2004, 2001; Hess et al, 2002; Li et al, 2002; Asahara et al, 1999), which offer valuable but discrete data at specific time points, and do not permit dynamic assessment of the interaction between the grafted cells and target tissue in the host brain.
Magnetic resonance imaging (MRI) provides a noninvasive and dynamic means to monitor the hemodynamic and biophysical events in cerebral tissue (Jiang et al, 2000, 1998) and can track magnetically labeled cells in vivo (Zhang et al, 2003a,b; Hoehn et al, 2002; Bulte et al, 1999). ISODATA (Iterative Self-Organizing Data Analysis Technique Algorithm) is a data processing technique based on cluster analysis in the feature space (Ball and Hall, 1967). By using the acquired MR weighted-images or fitted-maps, ISODATA can objectively identify normal and abnormal cerebral tissue and automatically demarcate the different ischemia-affected areas in the brain by assigning each segment a specific signature value according to the degree that this tissue segment deviates from normal tissue (Jacobs et al, 2001, 2000). Previous studies on embolic experimental stroke have showed that map-ISODATA, which is obtained from MR parametric maps, accurately identifies the lesion size (Ding et al, 2004), and that the signature values presented by map-ISODATA are highly correlated with the severity of tissue injury (Li et al, 2005). Therefore, MRI and the ISODATA technique may provide a way to investigate over time the effect of grafted cells on tissue remodeling after cell therapy.
In the present study, we use high-resolution three-dimensional (3D) gradient-echo MR images and map-ISODATA to track the superparamagnetically labeled adult progenitor cells isolated from the subventricular zone (SVZ) of the rat brain and to measure the interaction between the cells and ischemic lesion, respectively. Our data show that the grafted cells strongly influence the ischemic lesion, the final shape of the lesion and the induction of angiogenesis.
Materials and methods
All experimental procedures have been approved by the Institutional Animal Care and Use Committee of Henry Ford Hospital.
Generation of Neural Progenitor Cells and Cell Labeling
Neural progenitor cells were dissociated along the lateral wall of the lateral ventricle, under the corpus callosum down to the ventral tip of the lateral ventricle from approximately 1.5 to 2.0 mm thick parasagittal sections from normal male Wistar rats (3 to 4 months, Jackson Laboratory, Bar Harbor, ME, USA). Cultured SVZ cells were labeled with lipophilic dye coated particles (Gan et al, 2000) before transplantation. The detailed procedure of cell generation and cell labeling has been previously described (Zhang et al, 2003a; Jiang et al, 2005).
Animal Model and Experiment
Animals (male Wistar rats, n = 8 for the SVZ cell treated group; n = 3 for control (phosphate-buffered saline (PBS) treated) group) were subjected to embolic stroke by injecting an aged white clot (prepared 24 h before ischemia) into the internal carotid artery to occlude the middle cerebral artery (MCA). This rat model (Zhang et al, 1997a) of embolic focal cerebral ischemia provides a reproducible and predictable infarct volume localized to the territory supplied by the MCA. In the treated group, 1 × 10⁵ superparamagnetic-labeled SVZ cells were injected via percutaneous injection into the cisterna magna 48 h after induction of embolic MCA occlusion. There was no cell transplantation after stroke for the animals in the control group. All rats were killed 6 weeks after embolization. Some data from cell treated animals have been previously reported (Jiang et al, 2005).
Magnetic Resonance Imaging Measurements
Magnetic resonance imaging measurements were performed using a 7T, 20-cm-bore superconducting magnet (Magnex Scientific, Abingdon, UK) interfaced to a Bruker console (Bruker Company, Boston, USA). A 12-cm bore actively shielded gradient coil set, capable of producing magnetic field gradient up to 200 mT/m, and a birdcage radio-frequency coil were used. Animals were placed on a nonmagnetic holder equipped with a nose cone for administration of anesthetic gases and with stereotaxic ear bars to minimize movement of the head. Once the holder was inside the magnet, the orientation of the head was reproducibly positioned by using a tri-pilot scan of imaging sequence, until the brain was in the flat skull position with the center slice located at a fixed level. During the imaging procedure, anesthesia was maintained with 1.0% halothane in 69% N2O and 30% O2, and rectal temperature was kept at 37°C±1.0°C using a feedback-controlled water bath. The right femoral vein was cannulated with a PE-50 catheter for the administration of MR contrast agent (Gd-DTPA).
A complete set of MR images, including T1, T2, T1 sat, cerebral blood flow (CBF), transfer constant (Ki)of MR indicator (Gd-DTPA) and 3D gradient-echo images, was acquired for all animals at approximately 24 h (1 day before cell injection), 72 h (1 day after cell injection) and weekly for 6 weeks after onset of embolization. The detailed methods used to obtain T1, T2, T1sat, CBF, Ki and 3D images have been previously described (Jiang et al, 2005).
Magnetic Resonance Imaging Data Analysis
Magnetic resonance imaging data were transferred to a SUN workstation (SUN Microsystems, Inc) for off-line processing. By using in-house software, images were baseline corrected and reconstructed, and the corresponding MRI parameter maps were created. All postprocessing of the reconstructed images and maps was performed with Eigentool image analysis software (Windham et al, 1988).
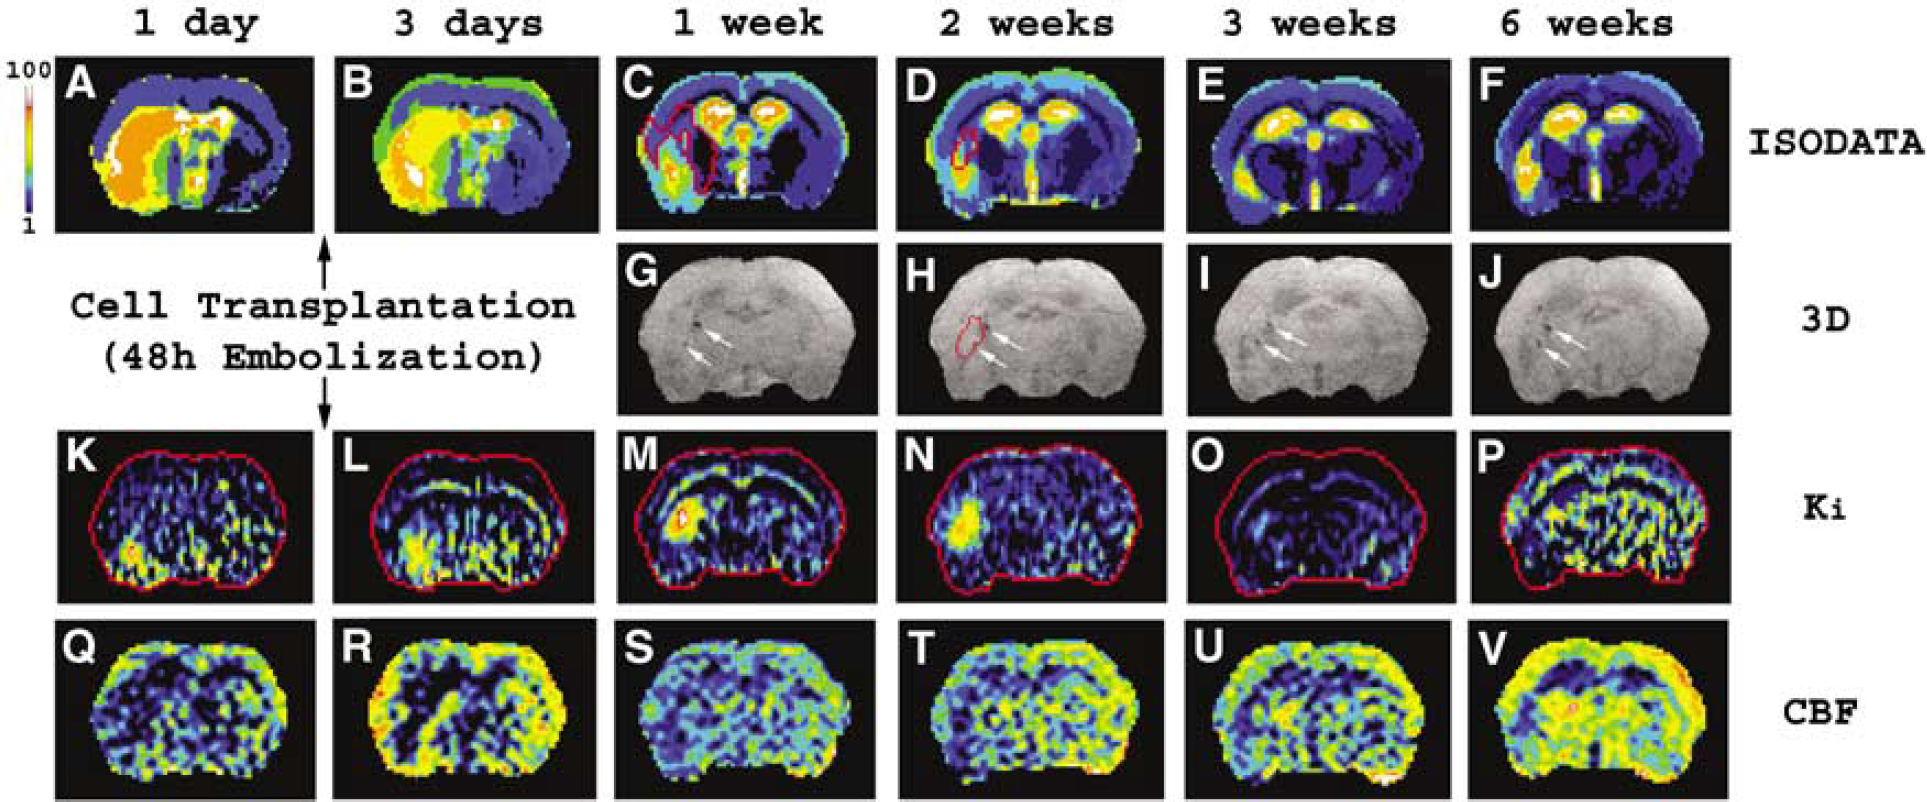
Iterative Self-Organizing Data Analysis Technique Algo-rithm was computed from T1, T2 and T1sat maps. Tissue signatures presented in the ISODATA theme map were standardized from 1 to 100, assigning 1 to white matter (corpus callosum) and 100 to cerebral spinal fluid (Ding et al, 2004). Lesion area can then be easily identified by comparing the tissue signature of the stroke side with that of the contralateral (normal) side (Figures 1A-1F). Based on the definition of the ISODATA algorithm, the tissue signature value represents how far away this tissue deviates from normal tissue in the feature space (Jacobs et al, 2001). The higher signature value in the lesion area, therefore, indicates a larger difference of the tissue segment from the normal tissue or a more severely ischemia-affected area. In the present study, signatures normalized to the contralateral side (relative signature, which is the signature difference between ischemic tissue and homologous normal tissue in the contralateral hemisphere of the brain) were used. Similarly, relative T1, T2, T1sat and CBF values (ratio of mean value of ischemic tissue to homologous normal tissue in the contralateral hemisphere of the brain) were used to describe the affect of ischemia on the cerebral tissue.
Dynamic changes of an ischemic rat brain section after SVZ cell transplantation presented by ISODATA (
To detect the tissue changes in different specific areas after cell transplantation, measurements for both cell treated and control groups were performed in three distinct regions of interest. They are: (1) the ischemic lesion area, characterized by ISODATA at multiple time points (Figures 1A-1F); (2) the angiogenesis area, identified by histological evaluation; and (3) the pseudo-normal area, which is contained within the lesion area on ISODATA early after embolization, but disappears later (Figure 1C, red track area) when compared with the largest lesion area observed after embolization (the lesion 72 h after stroke) for each animal. The pseudo-normal area was calculated by subtracting the reduced lesion at time t after stroke (Figures 1C-1F) from the lesion 72 h after stroke (Figure 1B). Thus, both lesion area and pseudo-normal area vary with time, whereas angiogenesis area is fixed for each animal.
Measurements were conducted on the fixed reference section and data obtained from each animal contributed to the average values of measurement at observation time points.
Tissue Preparation and Histological Assessment
Immediately after the final MRI measurement at 6 weeks after stroke, animals were deeply anesthetized with ketamine (44 mg/kg, intraperitoneally) and xylazine (13 mg/kg, intraperitoneally), and the vascular system was transcardially perfused with heparinized PBS followed by 4% paraformaldehyde in PBS. The brains were immersed in 4% paraformaldehyde in PBS for 2 days, and then the brain tissues were cut into seven equally spaced (2 mm-thick) coronal blocks. Tissue blocks were embed-ded in paraffin for histological processing. Three adjacent coronal sections (6 mm-thick) were taken from each block and stained differently for histological evaluation.
To identify superparamagnetically labeled SVZ cells and the angiogenesis area in the host brain, the brain coronal sections were stained for iron using Prussian blue reaction (Bulte et al, 1999) or for angiogenesis using von Willebrand Factor (vWF) immunohistochemical staining (Zhang et al, 2002). On the immunohistochemical-stained slices, the markers of vWF-immunoreactive enlarged thin-walled vessels were used to histologically identify areas of angiogenesis (Chen et al, 2004).
To count the intact cell numbers in specific regions, the coronal sections were stained with hematoxylin and eosin (H&E). Morphologically intact cells were counted in the following three specific regions characterized by ISODATA: lesion area, pseudo-normal area and normal tissue area in contralateral side of the brain. In each region, five non-overlapping fields of the same size view were digitized under a light microscope at × 40 magnification, and data are presented as the average cell number per square millimeter in each region. A fixed reference histological section for each animal, which matched the MRI slice, was measured.
By using the same H&E slices, areas of lesion were measured using MicroComputer Imaging Device (MCID; Imaging Research Inc., Ontario, Canada) at × 2.5 magnification. The area of infarction and the area of the ipsilateral hemisphere were obtained by tracing the outline of these areas on a computer screen.
To measure the vWF immunoreactive microscopic vessels, vWF immunostained coronal section was digitized under a × 20 objective (Olympus BX40), using a 3-CCD color video camera (Sony DXC-970MD) interfaced with MCID image analysis system (Imaging Research). Three slices for each animal with angiogenesis were measured. For each slice, five non-overlapping fields of the same size view in the angiogenesis area were digitized. Data are presented as the average vessel number per square millimeter.
To examine the phenotype of Prussian blue positive cells, we performed immunofluorescent staining (Zhang et al, 2003a; Wang et al, 2004) with antibodies against β-tubulin III (TuJ1), a marker of neurons, GFAP, a marker of astrocytes, and nestin, a marker of neural progenitor cells. Lectin histochemistry with the B-isolectin from 4 Griffonia simplicifolia (GSAI-B4) was used to detect microglia (Zhang et al, 1997b).
Statistical Analysis
The measurement results are summarized as mean ± s.e. the total cell number was compared between treated and control groups by region using a two-sample Wilcoxon exact test. Vessel number, lesion area and pseudo-normal area in the treated and control group were compared using two-sample t-tests at observation time points. Regional comparisons in relative signature, T1, T2, T1sat and CBF data were made using paired t-tests. Adjustments for multiple comparisons were made using Hochberg's method (Hochberg, 1988). Correlative analysis was conducted between the lesion areas obtained by histological evaluation and characterized by ISODATA for all animals 6 weeks after embolization. The Pearson correlation coefficient was computed to provide a measure of the degree of linear association between the estimated factors.
Results
The Destination of Grafted Subventricular Zone Cells and Phenotype of Prussian-blue Positive Cells
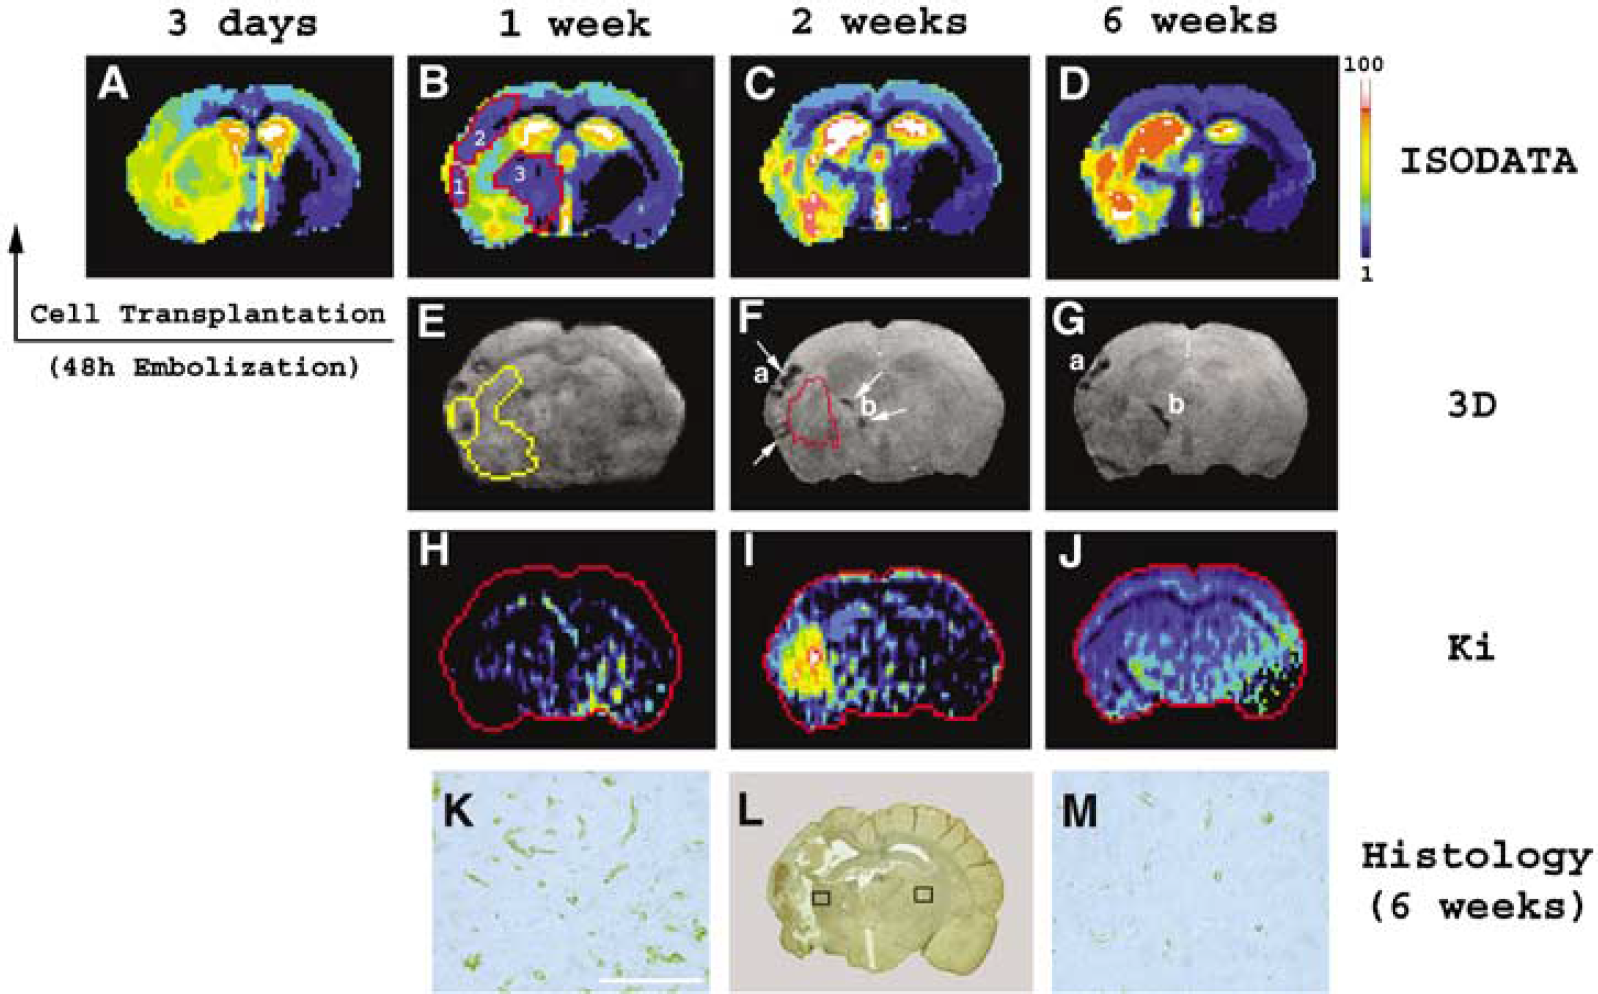
Grafted SVZ cells were detected only in the ischemic hemisphere of the brain by both Prussian blue-stained histological slices and MR 3D images (Figures 1G-1J and 2E-2G), suggesting that trans-planted cells selectively migrated towards the ischemic parenchyma. These cells scattered around the ischemic lesion (comparing Figures 1C with 1G; comparing Figures 2B with 2E) and arrived at their destination within 1 week after grafting. Comparing with the hemodynamic and biophysical changes (Figures 5 and 6) in the ischemic cerebral tissue, the location of the grafted cells was relatively fixed after they approached the ischemic boundary (Figures 1G-1J and 2E-2G). Only very small movement of the transplanted cells was detected between 1 and 6 weeks (compare Figures 2E with 2F and 2G for cell localization). Expanded dark areas (such as a and b in Figures 2F and 2G) appeared at later time points (between 2 and 6 weeks) for all cell treated animals and this indicated that the grafted cells were alive (Bulte et al, 1999; Zhang et al, 2003a).
Effect of the location and distribution of grafted cells on both the ischemic lesion and angiogenesis. The dramatic reduction of lesion size took place at approximately the 1-week time point after cell transplantation (comparing
Prussian blue positive cells around the ischemic boundary were not co-localized to EBA positive vessels (
Histological evaluation, correlation analysis and lesion area. Average total intact parenchymal cell numbers (
Changes of relative signature (
Changes of average relative CBF in the lesion and pseudo-normal area for the treated (
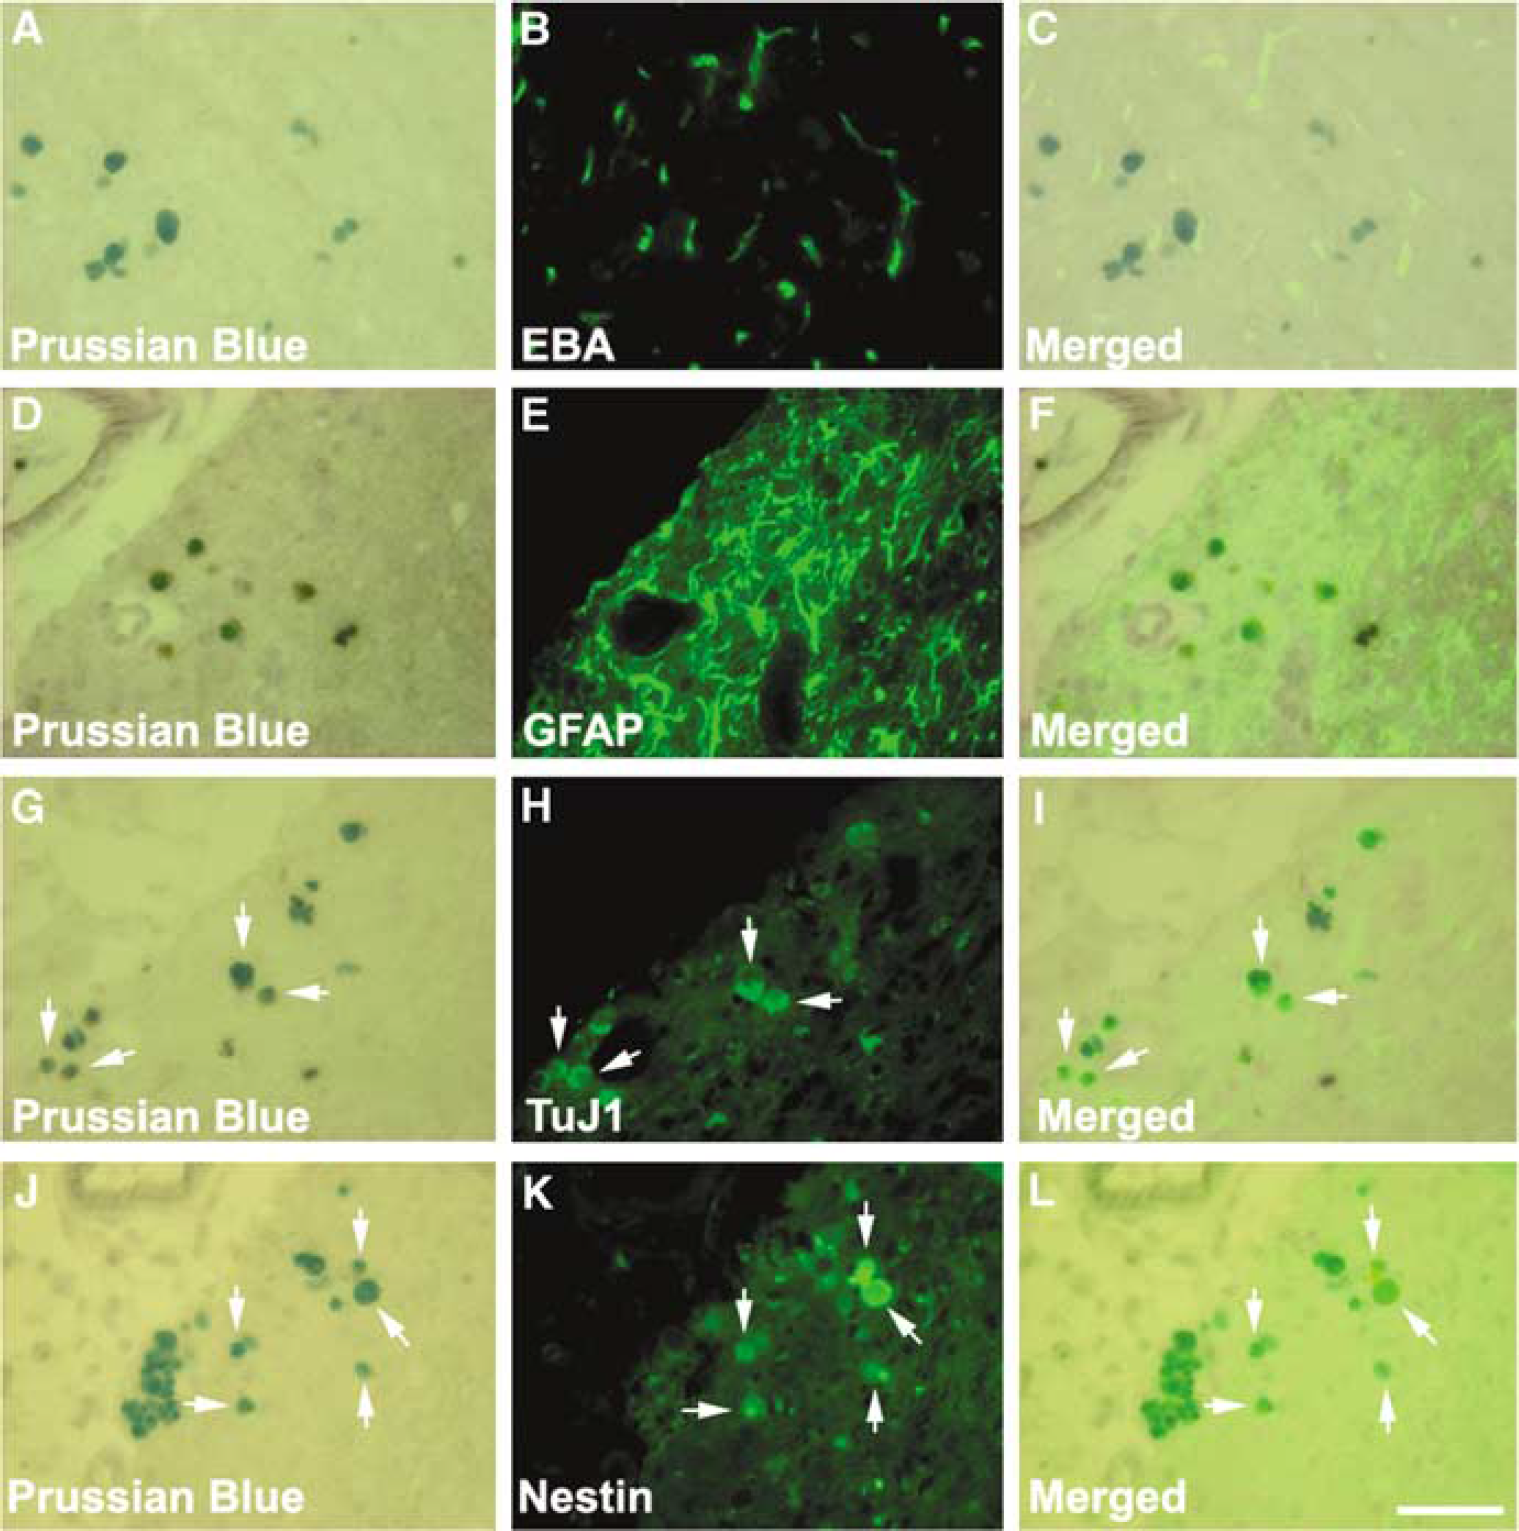
Double immunohistochemistry staining revealed that Prussian blue positive cells within the ischemic boundary zone were not co-localized to EBA positive vessels (Figures 3A-3C) and GFAP positive cells (Figures 3D-3F). However, Prussian blue positive cells were TuJ1 (Figures 3G-3I) and nestin (Figures 3J-3L) positive. Quantitative analysis showed that 13.3% and 14.3% of Prussian blue cells were TuJ1 and nestin positive, respectively. These data indicate that grafted SVZ cells differ-entiated into neural progenitor cells and neurons around the ischemic boundary region. Double lectin/Prussian blue staining revealed scattered phagocytized superparamagnetic labeled cells with-in the ischemic core.
Histological Evaluation and Correlation Analysis
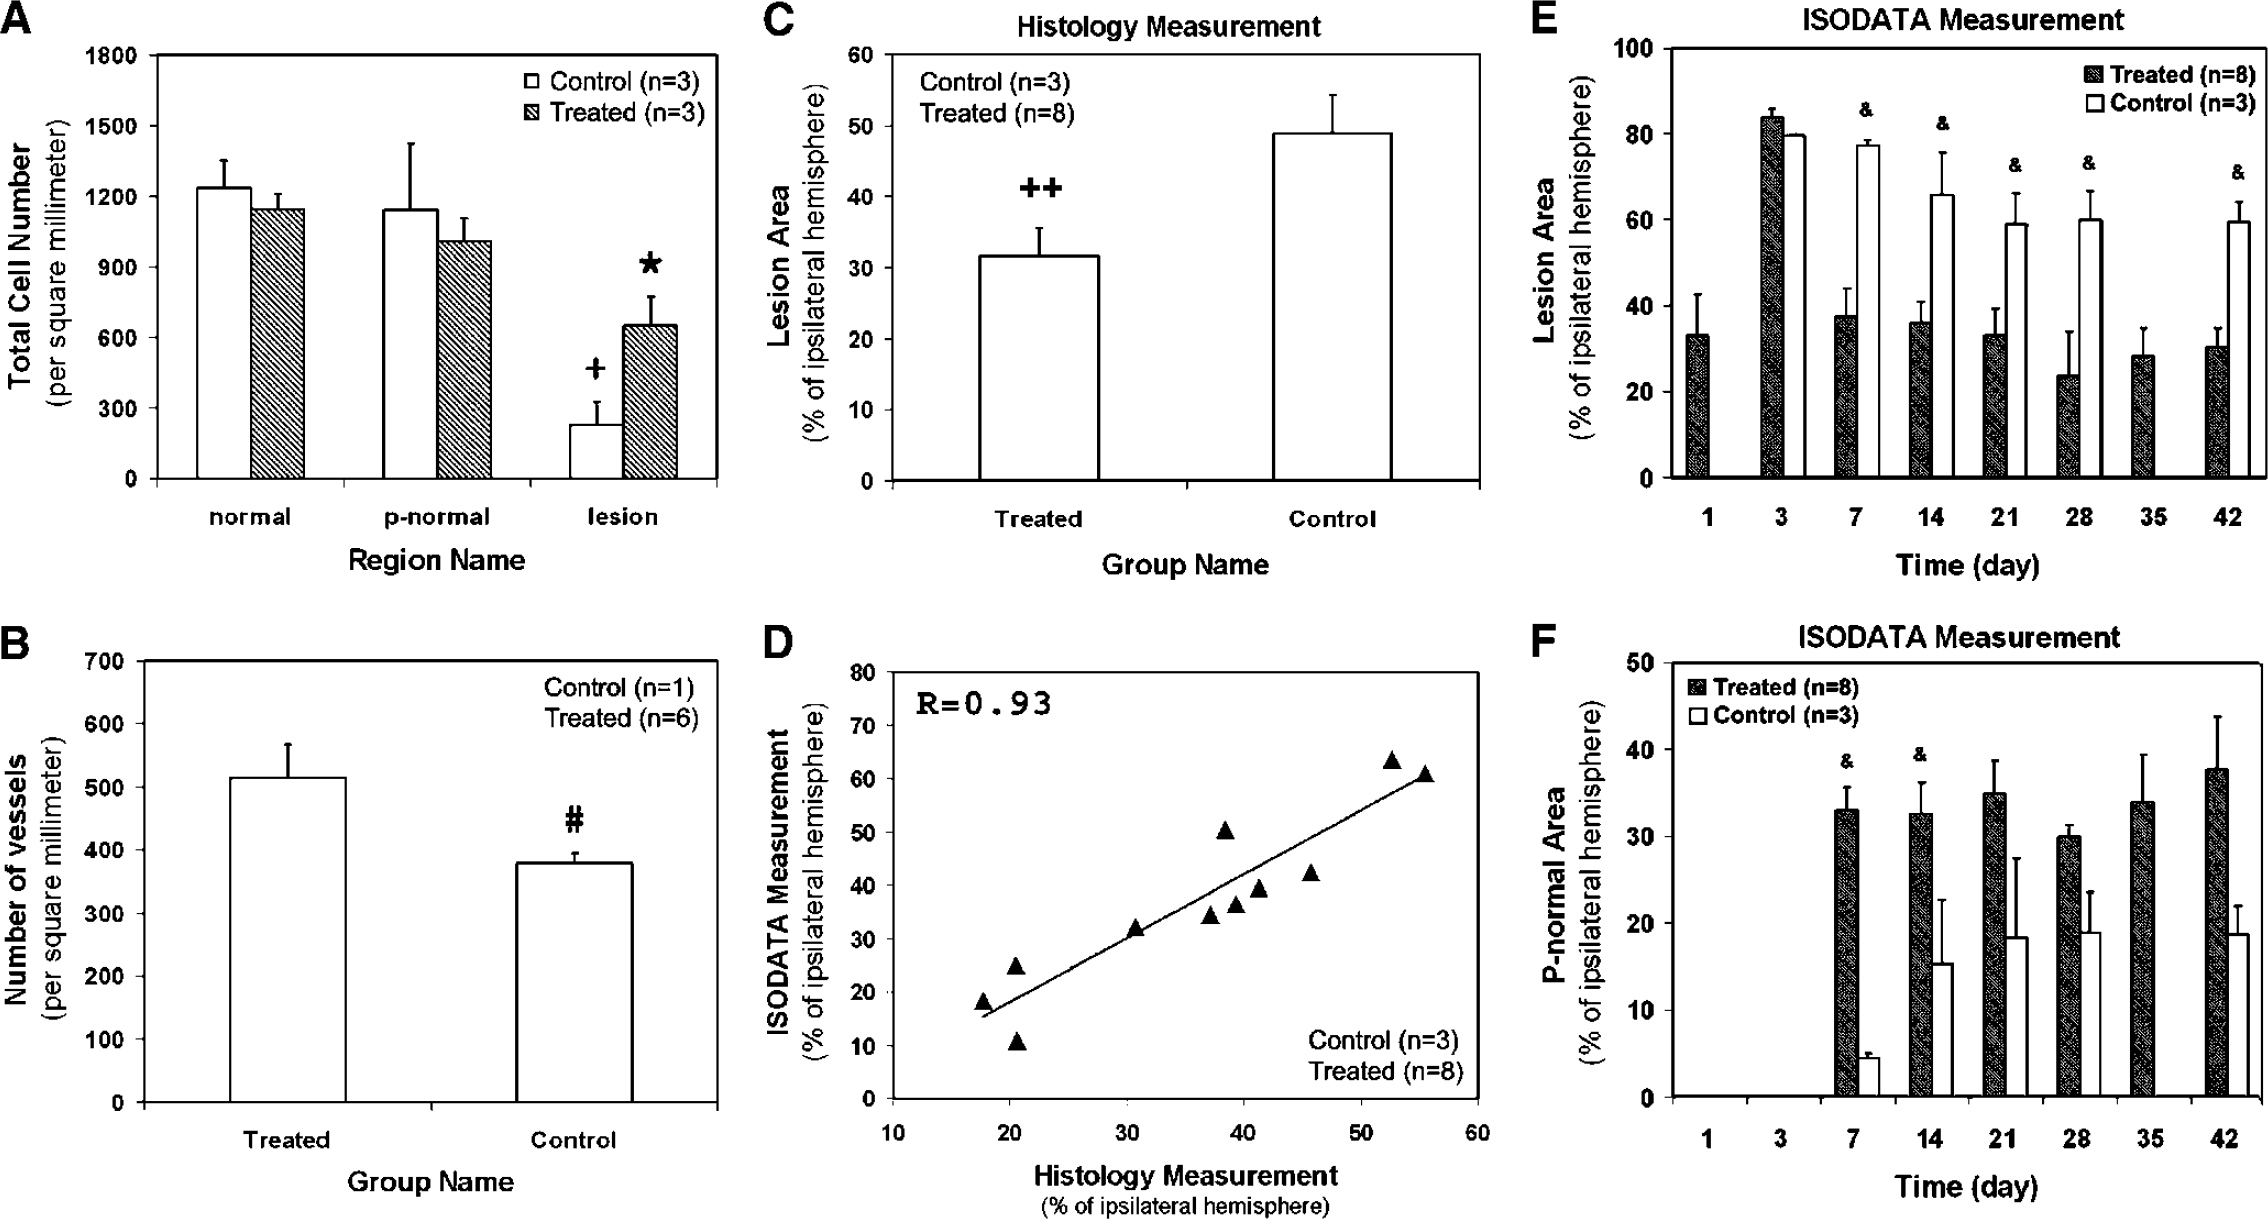
Figure 4A shows the intact parenchymal cell numbers in three specific regions characterized by ISODATA. A similar chart pattern for the treated and control groups was obtained, with the highest total intact parenchymal cell number appearing in normal tissue area and the lowest in lesion area. For both treated and control groups, total intact parenchymal cell number in the lesion area was significantly lower than in normal and pseudo-normal areas. These data reflect that some cells were injured or died after stroke in the lesion area. Moreover, no significant difference in total cell numbers was found between normal and pseudo-normal areas in the two groups, suggesting that tissue status in these two areas is similar. When comparing intact parenchymal cell numbers in the same areas between the treated and control groups, no significant difference was detected, indicating that cerebral tissue with similar status could be properly identified by ISODATA.
Angiogenesis in cell treated animals was significantly greater than in control animals. The density of microscopic vessels in the angiogenesis area was significantly higher in SVZ cell treated animals than in control animals (Figure 4B), indicating that the SVZ cell transplantation enhances the angiogenesis.
Lesion area (presented as percentage of ipsilateral hemisphere) was histologically evaluated 6 weeks after embolization (Figure 4C). The SVZ cell treated group exhibited a significantly smaller average lesion area than the control group. Correlative analysis was performed between the lesion areas calculated by map-ISODATA and measured by histological evaluation 6 weeks after embolization for all the animals in both SVZ cell treated and control groups (Figure 4D). A strong positive association between these two sets of data with R = 0.93, P < 0.0001 is obtained, indicating that the lesion areas evaluated by map-ISODATA and by histological observation are highly correlated.
Effect of Grafted Cells on the Ischemic Lesion and Angiogenesis
As shown in Figure 4E, the average lesion size increased from the onset of embolization to one day after cell injection. A significant reduction of average lesion size induced by the SVZ cell transplantation was detected at the 1-week time point, and this lesion difference persisted throughout the observation period. Meanwhile, cell trans-plantation resulted in expanded pseudo-normal area (Figure 4F) in the lesion boundary zone.
The reclaimed lesion areas (Figure 2B, red track 1, 2 and 3), which were obtained by subtracting the reduced lesion (Figure 2B) from the lesion 1 day after cell transplantation (Figure 2A), were detected adjacent to the grafted cells (comparing Figures 2B with 2E) and the gaps between the reduced lesion (Figure 2E, yellow track) and transplanted cells (Figure 2E, dark areas) were formed. Consequently, the localization and distribution of grafted cells apparently influenced the final lesion shape (comparing Figures 2D with 2G).
Ki is a sensitive parameter, which is capable of detecting angiogenesis in cerebral tissue with the help of MR contrast agent (Jiang et al, 2005). The angiogenesis area identified by the hyperintensity region in the Ki map (Figure 1N) was located in the ischemic boundary zone (Figure 1D, red track area) and immediately adjacent to the grafted cells (Figure 1H, red track area). In one animal, angiogenesis (Figure 21, enhanced area) appeared m the site surrounded by the grafted cells (Figure 2F, red track area). However, not all the regions with labeled cells were related to the promotion of angiogenesis. The most favorable angiogenic locations were the external capsule and parietal cortex area 1 regions (100% of cell treated animals with angiogenesis) (Jiang et al, 2005). Grafted cells located in other regions seemed not to contribute to the occurrence of angiogenesis (three of eight treated animals).
Measurement in Different Regions
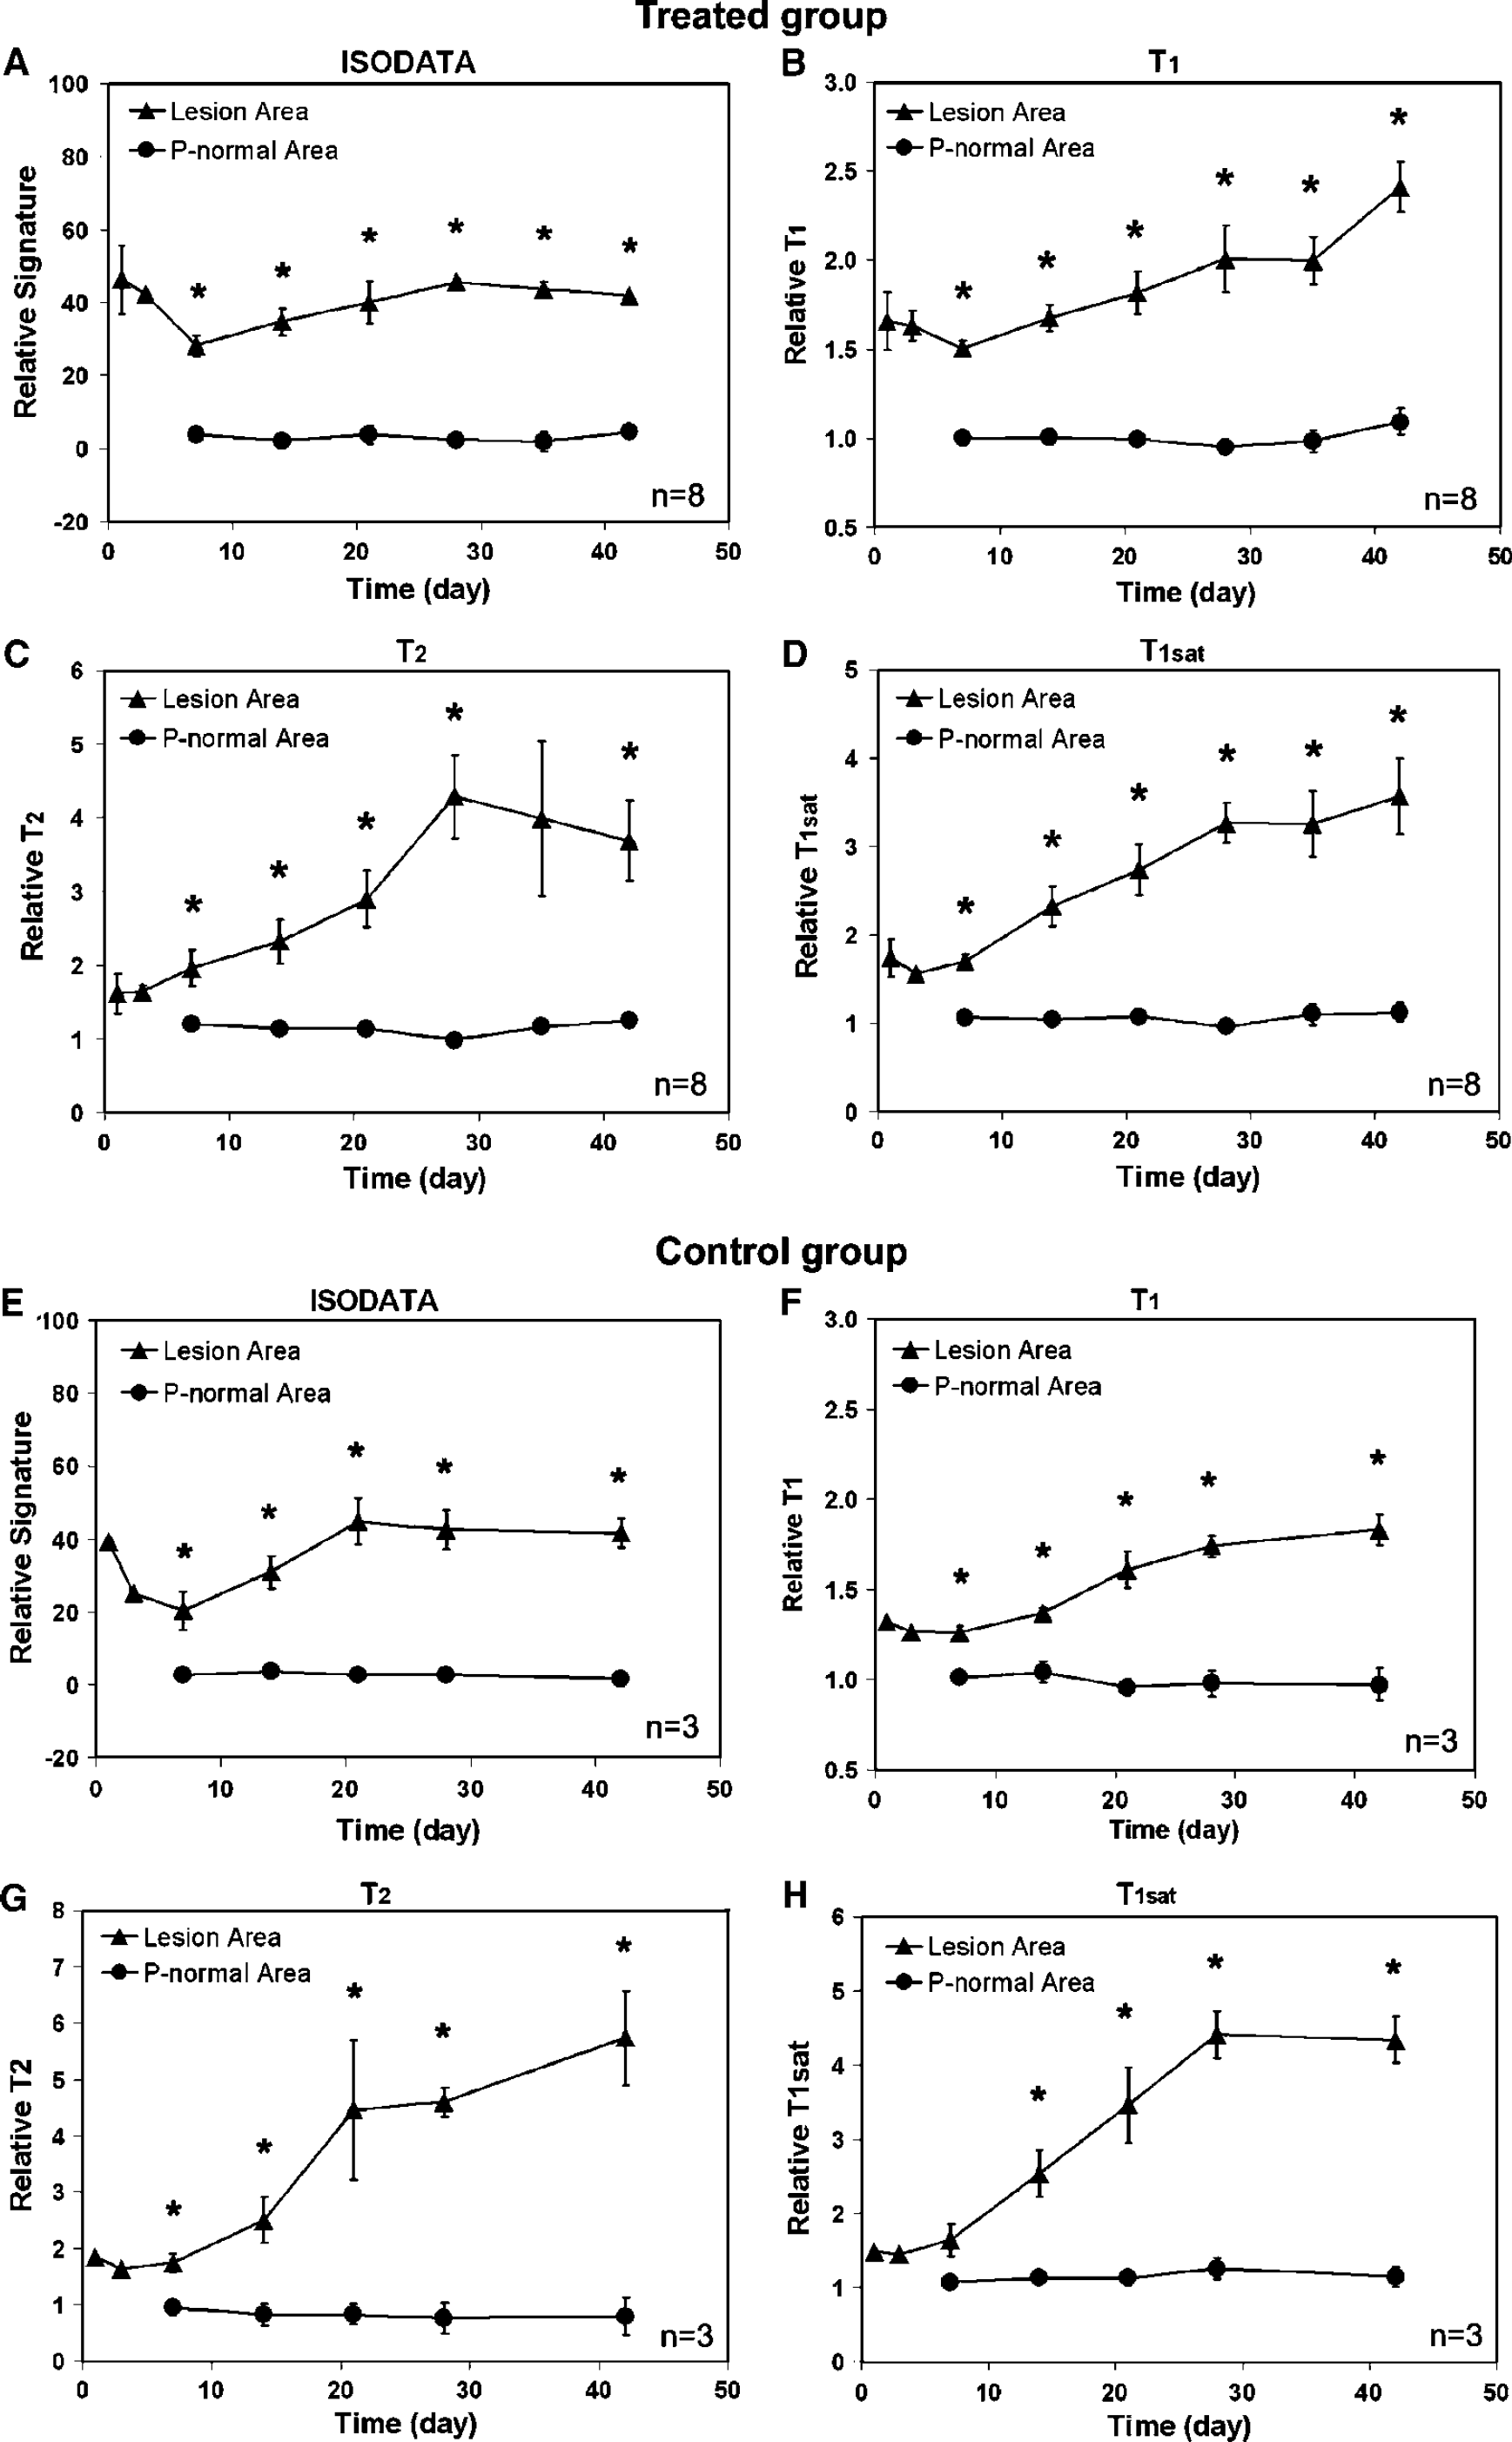
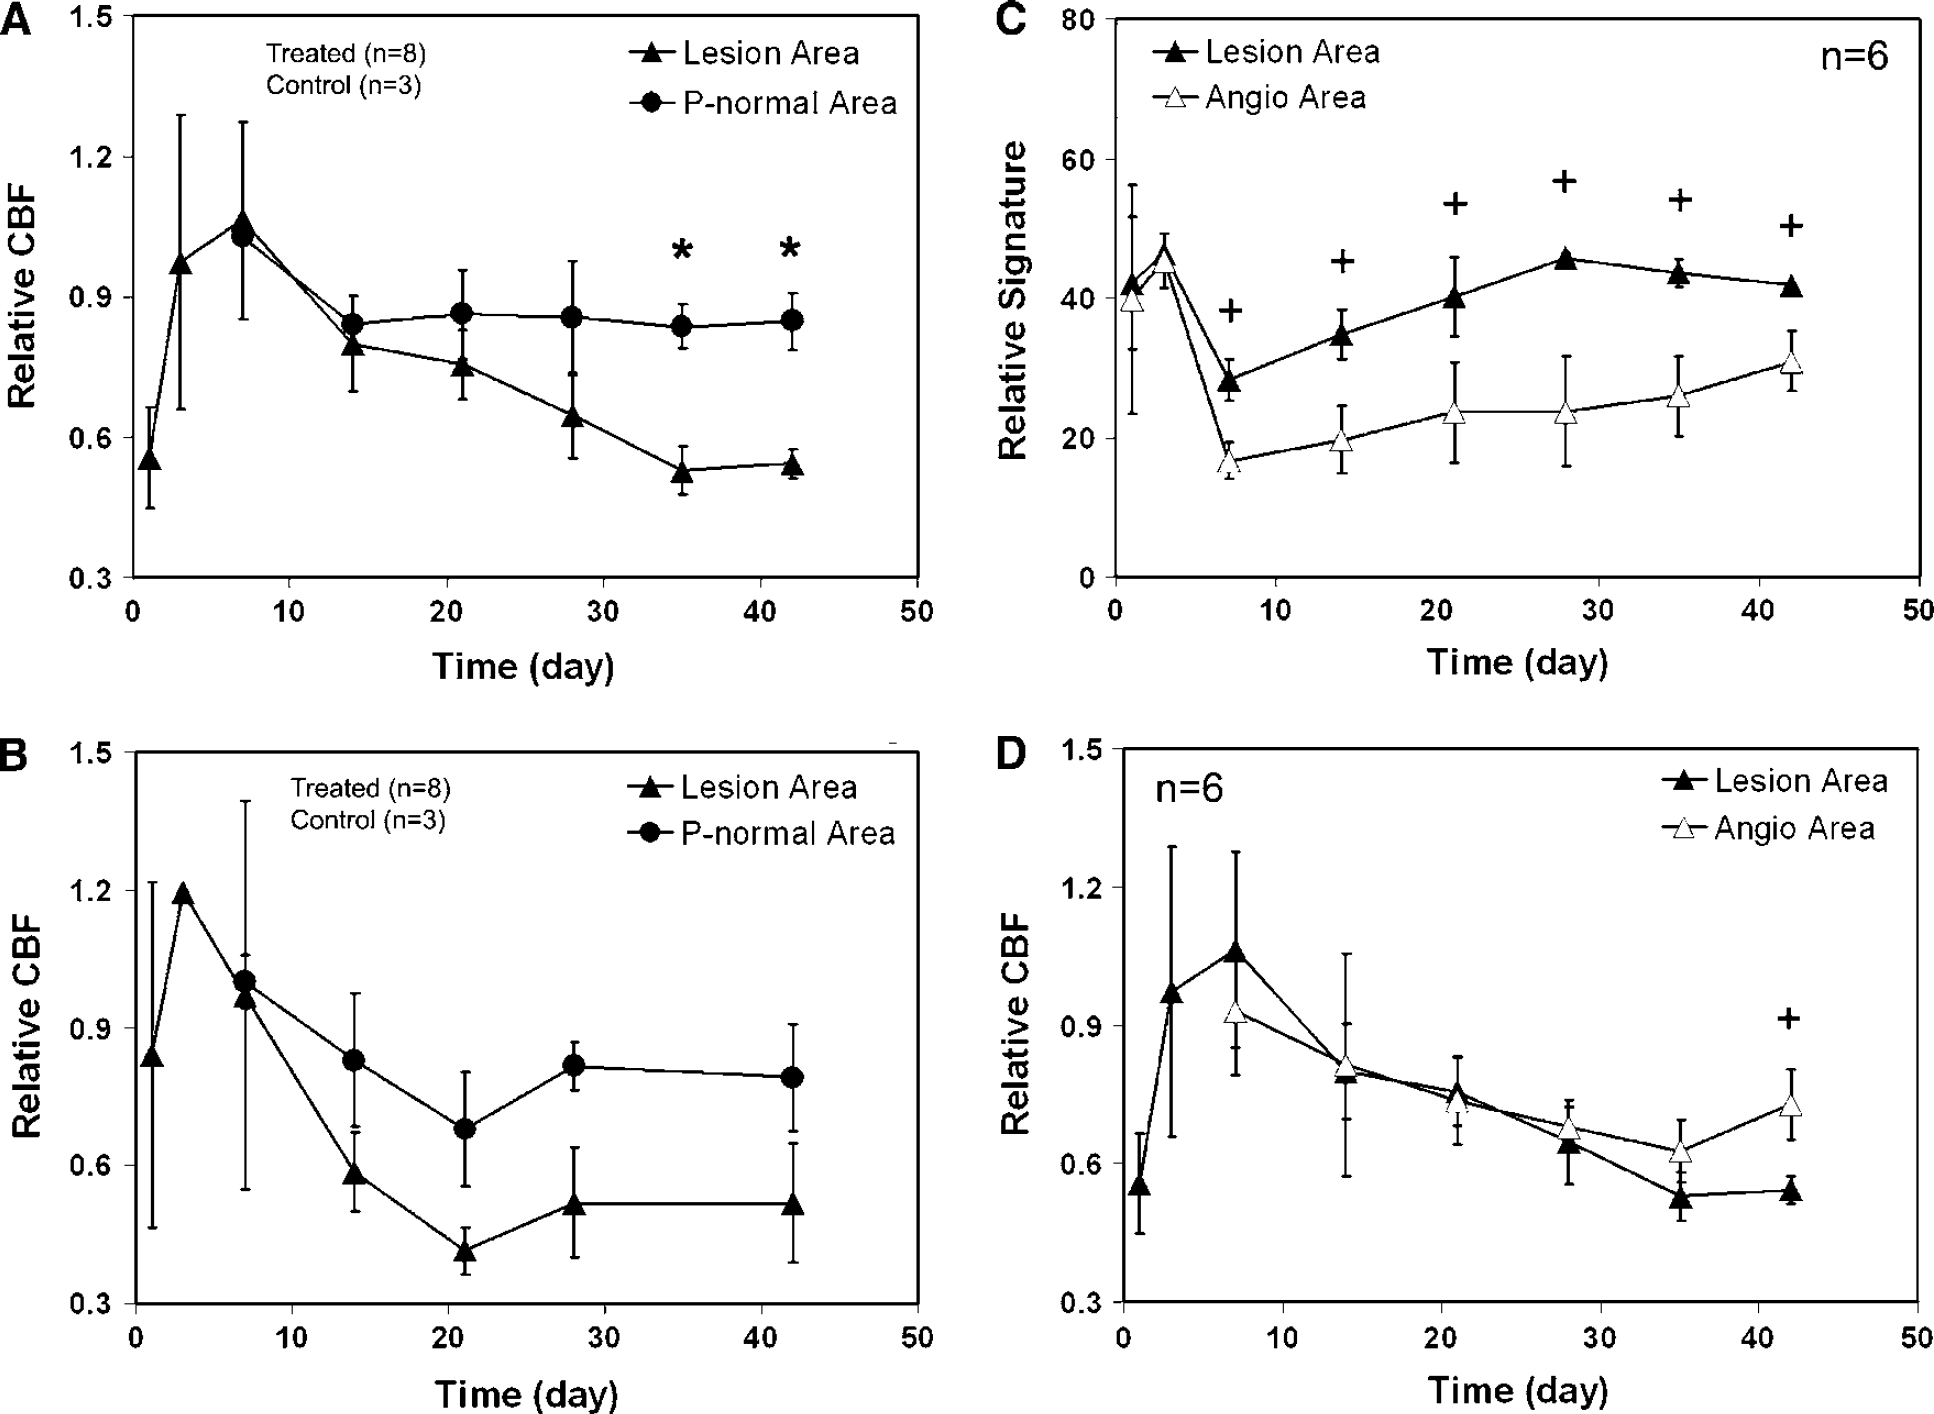
Measurements of ISODATA signature, CBF and MRI parameters, including T1, T2, and T1sat, were performed for both cell treated and control groups. The changes of these MRI-related quantitative values in the lesion area and the pseudo-normal area characterized by ISODATA are given in Figures 5 and 6A-6B. The comparisons of relative signature and CBF between angiogenesis area and lesion area for cell treated group are shown in Figures 6C and 6D.
For both cell treated and control groups, average signature, T1, T2, and T1sat in the two areas were divided and arranged in the same order (Figure 5), with the higher values in lesion area and the lower values in the pseudo-normal area. Relative T1, T2 and T1sat values in the pseudo-normal area were approximately 1 from the 1- to the 6-week time point (Figures 5B-5D, 5F-5H). Correspondingly, the relative signature in this area was approximately 0 during this observation period (Figures 5A and 5E), indicating that the pseudo-normal area appeared close to normal tissue and that map-ISODATA properly reflected this tissue status.
For relative CBF (Figures 6A-6B), there was no significant difference between the treated and control groups in both lesion and P-normal areas. However, the evolution of CBF in the pseudo-normal area differed from that in the lesion area in the treated group (Figure 6A). The elevated relative CBF in the pseudo-normal area appeared after the 2-week time point compared with lesion area. This level of restored CBF (approximately 85% of normal CBF level) in the pseudo-normal area persisted until termination at 6 weeks, whereas the average relative CBF in the lesion area decreased during the same observation period. For the control group, restoration of CBF in the pseudo-normal area also appeared (Figure 6B, approximately 78% of normal CBF level). However, no significant difference in relative CBF between the pseudo-normal area and lesion area was detected during the same observation period. These data indicate that cell transplantation promotes rapid and stable restoration of CBF in the ischemic lesion boundary zone.
Compared with lesion area, significant signature reduction in the angiogenesis area for the treated group was detected from the 1-week to the 6-week time point (Figure 6C), but no corresponding significant increase of relative CBF in this area appeared until the 6-week time point (Figure 6D).
Discussion
In the present study, we used high-resolution 3D MRI and map-ISODATA to track the superparamagnetically labeled SVZ cells and to detect the changes of ischemic tissue in the rat brain after embolic stroke, respectively. We investigated the interaction between the ischemic lesion and the grafted cells dynamically and noninvasively, and showed that the location and distribution of these intracisternal-transplanted cells strongly influenced the change of ischemic lesion, the final shape of reduced lesion and the degree of angiogenesis.
Our immunofluorescent staining showed that labeled SVZ cells differentiate into neural progenitor cells and neurons in the ischemic boundary region, which matched hypointensity areas in MRI images. Only scattered microglia/microphages were Prussian blue positive in the ischemic core. The minimum detectable sensitivity for the detection of the Prussian blue cells by MRI is of the order of clusters of hundreds of cells (Zhang et al, 2003a, b; Hoehn et al, 2002) located in the ischemic boundary region. Therefore, it is highly unlikely that phagocytized Prussian blue cells contribute to the MRI hypointensity observed in the ischemic core.
Iterative Self-Organizing Data Analysis Technique Algorithm calculated from MRI parametric maps can accurately identify the ischemic lesion size and classify the severity of the ischemia-affected cerebral tissue after embolic stroke (Li et al, 2005; Ding et al, 2004). Using map-ISODATA together with MR high-resolution 3D images, the changes in both lesion size and injury severity (i.e. signature value in ISODATA) after cell transplantation and the interaction between the lesion and the grafted cells can be investigated. We confirmed previous results (Li et al, 2005; Ding et al, 2004) that the signature values provided by the map-ISODATA reflected the degree of ischemic injury in the cerebral tissue, with higher relative signature values corresponding to larger increases in T1, T2 and T1sat (Figure 5), and that map-ISODATA can accurately reflect the ischemic lesion size (Figure 4D). Histological assessment consistently supported the conclusion that the cerebral tissue status could be properly identified and distinguished by ISODATA (Figure 4A).
Iterative Self-Organizing Data Analysis Technique Algorithm indicated that the average lesion size (Figure 4E) increased from the onset of embolization to one day after grafting, and a significant reduction of average lesion size appeared approximately 1 week after cell transplantation when the grafted cells approached the ischemic lesion boundary (Figures 1 and 2). Iterative Self-Organizing Data Analysis Technique Algorithm together with 3D images also revealed that after cell transplantation, the tissue segments with reduced signature in the lesion boundary zone were located immediately adjacent to the cells (comparing Figures 2B with 2E), creating the corresponding retracted lesion areas (Figure 2B; 1, 2 and 3) and leaving obvious gaps between the cells and the reduced lesion (Figure 2E). As a result, the lesion edge nearby the cells seemed to be pushed away, and the final lesion shape was apparently influenced by the location of the grafted cells. Although the superparamagnetically-labeled cells could cause the reduction of signature locally by shortening relaxation times, our data indicated that the affect of the grafted cells on the lesion signature extends beyond the local cell areas, since a wide homogeneous area with reduced signature (Figure 1C and 2B, red track areas), instead of separate patches of reduced signature around cells, was observed. This relationship between the change of the ischemic lesion and the location of the cells appears to suggest that the improvement of local ischemic tissue is closely related to the appearance of grafted cells. The closer the lesion segment is to the cells, the more likely is the signature of the segment to be lower. Hence, the location of grafted cells may play a role in mediating the possible functional recovery.
Our data also show that angiogenesis usually occurs in the area either immediately adjacent to or surrounded by the grafted cells, indicating that the location and distribution of the cells may evoke angiogenesis. Consistent with this, the distribution of increased vascular endothelial growth factor, which mediates angiogenesis (Yancopoulos et al, 2000), is found to coincide with the localization of grafted cells in the host brain (Chen et al, 2003). Angiogenesis paves the way for possible repair of the injured cerebral tissue by providing a newly formed vascular network (Chen et al, 2003). Improvement of ischemia-affected tissue in angiogenesis areas has been detected in the animals studied (Figure 6C), with a significantly reduced average signature exhibited in the angiogenesis area com-pared with the average signature in the entire lesion area. In contrast, there was no difference in average signature in these two areas before the 1-week time point when no angiogenesis occurred. Elevated CBF at the location of grafted cells was also detected (Figures 1U and 1V). However, the elevated average CBF in the angiogenesis area was not significantly increased compared with the lesion area until the 6-week time point (Figure 6D). This increase of CBF seemed to be time-dependent. The longer the time elapsed, the bigger difference in CBF between angiogenesis and lesion area appeared. This result is reasonable, since the perfusion arising from angiogenesis could be achieved more likely after a newly formed vascular system in this area was completely established.
Histological evaluation (Figure 4A) showed that the pseudo-normal area, where the lesion feature transiently appeared in the ISODATA early after stroke, but faded later, completely differed from the lesion area. Our regional measurements (Figures 5 and 6A) also indicated that the pseudo-normal area showed obvious improvement compared with the lesion area in both hemodynamic and biophysical indices after cell grafting. The amelioration of damage in the pseudo-normal area seemed to be a major contributor to the remodeling of the ischemic brain. Although the pseudo-normal area appeared in both the cell treated and control groups after stroke, cell therapy resulted in a larger pseudo-normal area (Figure 4F) with more stably (Figure 6A) restored CBF in cell treated animals than in control animals. It is worth noting that ischemic tissue with a large T2 increase 1 day after stroke did not die and survived 6-weeks after stroke, especially for the cell treated animals (comparing Figures 1A with 1F). These results challenge the basic concept in the field of stroke therapy, which an increase in T2 identifies irreversibly damaged ischemic brain tissue (Welch et al, 1995; Jiang et al, 1997; Jacobs et al, 2000; Karonen et al, 1999; Albers, 1999). Thus, cell transplantation may not only shrink the ischemic lesion (Figure 4E), but also effectively prevents the pseudo-normal area from undergoing progres-sive injury. Although the mechanism of the tissue recovery is not clear this time, this observation of the recovery of ischemic tissue with a large T2 increase suggests that a much longer treatment window may be available in stroke patients than previously thought (NINDS, 1995).
The level of restored CBF in the pseudo-normal area (Figure 6A) did not decline during the study period, whereas the level of CBF in the lesion area decreased, resulting in permanent damage to the cerebral tissue (comparing Figure 1F with 1V in lesion area). These data indicate that the improvement of ischemic cerebral tissue is closely related to the restoration of CBF, which may derive from collateral flow after stroke (Wei et al, 2001). Cerebral collateral flow capacity improves over time after a neurovascular event (Tegos et al, 2000). Therefore, the larger pseudo-normal area (Figure 4E) with stably restored CBF in the treated group than in the control group, probably reflects the beneficial effect of an extensive collateralization augmented by cell transplantation. Moreover, the pseudo-normal area, which was calculated from the comparison of ischemic lesions characterized by map-ISODATA, not only corresponds with the restored CBF (Figures 6A and 6B), but is also consistent with the minor disturbance in MR parameters (Figures 5B-5D, 5F-5H), in relative signatures (Figures 5A and 5E) and in total cell numbers (Figure 4A). Both MRI (Figure 5) and histological (Figure 4A) data indicate that tissue status in the pseudo-normal area resembles normal tissue. These data support the application of map-ISODATA to accurately identify ischemic lesion and to characterize the ischemia-affected cerebral tissue.
Our data suggest that the grafted SVZ cells remodel the ischemia-affected tissue in the host brain in multiple ways. Stimulation and enhance-ment of angiogenesis was obviously one of them (Figure 4B). However, the effects of angiogenesis alone might not be sufficient to compensate for the hypoperfusion state, especially during the early period after stroke, as shown in Figure 6D. Restored perfusion in the expanded ischemic border area (Figure 4F) appeared to be connected with the promotion of collateral flow, which enhances the recovery of blood flow in ischemia-affected tissue (Figure 6A). The restored perfusion may prevent continuing cell death and promote neural plasticity in a neuroprotective microenvironment, since neurons are highly sensitive to hypoxia-ischemia (Shimamura et al, 2004). Finally, early elimination of edema in the lesion boundary area, which was associated with significant reduction of relaxation times (Figures 5B and 5C in pseudo-normal area), may also contribute to the rescue of tissue from ongoing damage.
In summary, the intracisternally transplanted SVZ cells selectively migrate towards the ischemic side of the rat brain (Zhang et al, 2003b) and scatter around the ischemic lesion. The transplanted cells arrive at their destination within 1 week after grafting and result in a significant reduction of average lesion size (P < 0.05). A significant reduction of tissue signature (P < 0.001) in the ischemic boundary area induced by cell transplantation was localized to the position of grafted cells in the host brain and these sites exhibited stably restored CBF (approximately 85% of normal CBF). Based on our observation, angiogenesis activity occurs in sites either immediately adjacent to or surrounded by the grafted cells, suggesting that the grafted cells contribute to the appearance of angiogenesis, which, in turn, moderate the ischemic lesion and thereby may improve neurologic functional outcome. Taken together, the location and distribution of the transplanted cells strongly influence the change of ischemic lesion, the final shape of reduced lesion and the appearance of angiogenesis. These cells may, therefore, mediate the specific functional recovery after stroke. Map-ISODATA is a powerful means to accurately identify and dynamically characterize the ischemic lesion and its response to cell therapy.
Footnotes
Acknowledgements
The authors thank Swayamprava Panda, Karyn A, Ledbetter and Ying Wang for their technical assistance.