
Abstract
Brain cells manufacture and secrete angiogenic peptides after focal cerebral ischemia, but the purpose of this angiogenic response is unknown. Because the maximum possible regional cerebral blood flow is determined by the quantity of microvessels in each unit volume, it is possible that angiogenic peptides are secreted to generate new collateral channels; other possibilities include neuroprotection, recovery/regeneration, and removal of necrotic debris. If the brain attempts to create new collaterals, microvessel density should increase significantly after ischemia. Conversely, if angiogenic-signaling molecules serve some other purpose, microvessel densities may increase slightly or not at all. To clarify, the authors measured microvessel densities with quantitative morphometry. Left middle cerebral arteries of adult male Sprague–Dawley rats were occluded with intraluminal nylon suture for 4 hours followed by 7, 14, 19, or 30 days of reperfusion. Controls received no surgery or suture occlusion. Changes in microvessel density and macrophage numbers were measured by light microscopic morphometry using semiautomated stereologic methods. Microvessel density increased only in the ischemic margin adjacent to areas of pannecrosis and was always associated with increased numbers of macrophages. Ischemic brain areas without macrophages displayed no vascularity changes compared with normal animals. These data suggest that ischemia-induced microvessels are formed to facilitate macrophage infiltration and removal of necrotic brain.
Beginning minutes after stroke in rodents, genes related to angiogenesis up-regulate, producing both message and translated proteins (Abe et al., 1997). Vascular endothelial growth factor (VEGF) is expressed in neurons for days, and for up to a week in pial cells (Abe et al., 1997). Vascular endothelial growth factor expression is apparent in astrocytes for up to 2 weeks after stroke (Zhang et al., 2000). In humans, the angiogenic platelet-derived growth factor message can be detected around cystic infarction for weeks after stroke (Krupinski et al., 1997). These angiogenic signals may represent an attempt at neuroprotection because another angiogenic peptide, fibroblast growth factor, is neuroprotective in culture models of excitotoxic cell death, and VEGF could possess similar properties (Zhang et al., 1993). Other peptide growth factors seem to improve outcome if given shortly after stroke in vivo (Finklestein et al., 1988; de Juan et al., 1990). Alternatively, perhaps the brain uses VEGF and other angiogenic factors after stroke as part of a repair process. If there were brain regeneration after injury, new tissue obviously would require new vasculature. It is intriguing to note that VEGF, in addition to mediating vasculogenesis during development, may play a role in neuronal cell migration during embryogenesis.
As a third alternative, angiogenic factors have other properties, such as opening the blood–brain barrier, which might be important in the removal of necrotic tissue; in this case, VEGF might have nothing to do with protection or recovery. In fact, this ‘clean-up’ hypothesis is strongly suggested by the current data. The authors hypothesize that the brain uses the angiogenic-signaling cascade to open capillaries and synthesize microvessels needed for macrophage infiltration for the destruction and removal of necrotic brain. After formation of the cystic cavity, pannecrosis, the microvessels are no longer needed and are therefore degraded.
The authors sought to clarify the role of angiogenesis after focal cerebral ischemia by determining microvessel density quantitatively. A stereologic method was adapted to obtain unbiased, precise measurements efficiently. The current method requires only standard microscopy and image analysis and uses standard stereologic principles.
MATERIALS AND METHODS
All protocols were approved by the Animal Research Committee of the Veteran's Affairs Medical Center, San Diego, following all national guidelines for the care of experimental animals. Male Sprague-Dawley rats (Harlan, San Diego, CA, U.S.A.), 250 to 320 g, were housed in a temperature-controlled room in a normal 12-hour light/dark cycle, and were provided chow and water ad libitum. The published method for occluding the middle cerebral artery (MCA) with intraluminal nylon suture was adapted (Longa et al., 1989). Rats were induced with saturated halothane and then maintained with 1% to 2% halothane in nitrous oxide:oxygen (60:40) through a face mask. During surgery, the left temporalis muscle temperature was monitored with a temperature probe (Malinkrodt Anesthesia Products, St. Louis, MO, U.S.A.) linked to a controller (YSI Model 73 ATD; Yellow Springs Instrument, Yellow Springs, OH, U.S.A.) and heat lamp to maintain brain temperature normothermic. A midline neck incision was made exposing the left carotid arteries; the external carotid and pterygopalatine arteries were ligated with 5–0 silk ligatures. An incision was made in the common carotid arterial wall and a 4–0 heat-blunted nylon suture was advanced 18 mm from the bifurcation of external and internal carotid arteries to block the origin of the MCA. The skin incision was closed with the suture protruding, and the animal was allowed to awaken from anesthesia. The total duration of anesthesia was less than 20 minutes in all cases. The artery remained occluded for 4 hours and then was re-opened by withdrawing the suture 10 mm while holding the animal in a plastic restraint. Animals were given 20 U heparin in 0.2 mL normal saline intravenously at the conclusion of surgery. Animals were kept on a heated (37.5°C) water blanket (Gorman-Rupp Industries, Bellville, OH, U.S.A.) for 1 hour during recovery and then returned to their cage. Previous work in the authors' laboratory showed that this method maintains brain temperature during the ischemic period.
Neurologic examination to determine changes in behavior of the animals was performed by a blinded examiner 24, 48, and 72 hours after surgery using a dichotomized version of the published rodent neurologic grading system (Bederson et al., 1986). The criteria for abnormal score were one or more of the following: reduced exploration (obtundation), forepaw retraction on tail lifting, asymmetric forepaw grasp, axial twist, or forced circling. Each animal was rated normal or abnormal (including dead).
Animals were killed after 7, 14, 19, and 30 days of reperfusion. Normal brains were studied from 4 animals that underwent no anesthesia or surgery. For histologic preparation, all animals were anesthetized by an intraperitoneal injection with a 50% aqueous urethane solution (0.003 mL/g body weight). The authors' preliminary trials revealed that this anesthetic agent better preserved neuronal, glial, and endothelial morphology when compared with halothane or ketamine-xylazine.
Rapid delivery of a strong fixative to the nervous system after a very brief saline wash is critical in preventing artifacts (Schultz and Whitter, 1989). After a midline thoracotomy, perfusion was initiated with 15 mL saline through a left ventricle cannula; to clear the cerebrovascular system of blood, an opening was made in the right atrium to allow blood to vent freely. This volume of saline is considered optimal for washing the adult rat brain vascular system of blood before fixation; larger quantities caused unacceptable tissue swelling (Schultz and Whitter, 1989). The saline solution was immediately followed by 300 mL of half-strength Karnovsky's solution: 2% paraformaldehyde and 3% glutaraldehyde in 0.1 mol/L sodium cacodylate buffer, pH 7.4. During the first 15 seconds of perfusion, the flow rate was set so that the pressure in the ascending aorta approached normal rat arterial pressure of 100 to 120 mm Hg or slightly greater. Perfusion then was arbitrarily reduced to 30 mL/minute.
After fixation, the brain was removed from the skull and immersed overnight in the same fixative at 4°C. A midparietal, coronal brain slice (1-mm-thick) then was cut with a razor blade 7 mm from the frontal pole of the brain, using a standard rat brain mold (Braintree Scientific, Braintree, MA, U.S.A.). For normal brains, the 1-mm brain slices also were obtained from the regions 2 mm and 13 mm postfrontal pole. Each 1-mm coronal brain slice was placed in 4 changes of 0.1 mol/L sodium cacodylate buffer, pH 7.4 (2 hours each change), to wash out the aldehyde fixatives and then were postfixed in 0.1 mol/L sodium cacodylate-buffered 1% osmium tetroxide, pH 7.4, for 3 hours. Each slice was dehydrated through ethanol and infiltrated with 2 changes (30 minutes each) of propylene oxide, followed by 1:1 and 1:2 propylene oxide:Epon (6 hours each) and pure Epon (6 hours). Polybed 812 was the Epon embedding medium (Electron Microscopy Sciences, Fort Washington, PA, U.S.A.).
From each brain slice, a 4 × 2-mm piece of medial-dorsal cortical tissue was cut with a razor blade from the left (ischemic) hemisphere (Fig. 1). This 4 × 2-mm tissue piece included all 6 layers of the cortex and a portion of the corpus callosum for orientation. In those ischemic brains where a cyst occurred in the cortex, the 4 × 2-mm tissue piece was taken such that the lateral edge included the superior margin of the cyst. For evaluation of normal brains, 4 × 2-mm pieces were cut from both the medial-dorsal and the lateral cortex of the unlesioned animals. Each 4 × 2-mm tissue piece was mounted in an ultramicrotome, and a 1-μm semithin section was cut with a glass knife. Each section then was stained by floating it on a warm 1% toluidine blue solution, then washed, heat-fixed, and coverslipped using Permount. In pilot trials, the 1-μm sections minimized error associated with overestimates of microvascular parameters caused by section thickness (the Holmes effect). Moreover, thicker sections presented a poorer view of the microvessels. Thinner sections (0.5-μm-thick) offered no advantage in identifying the microvessels and were more difficult and time-consuming to cut.
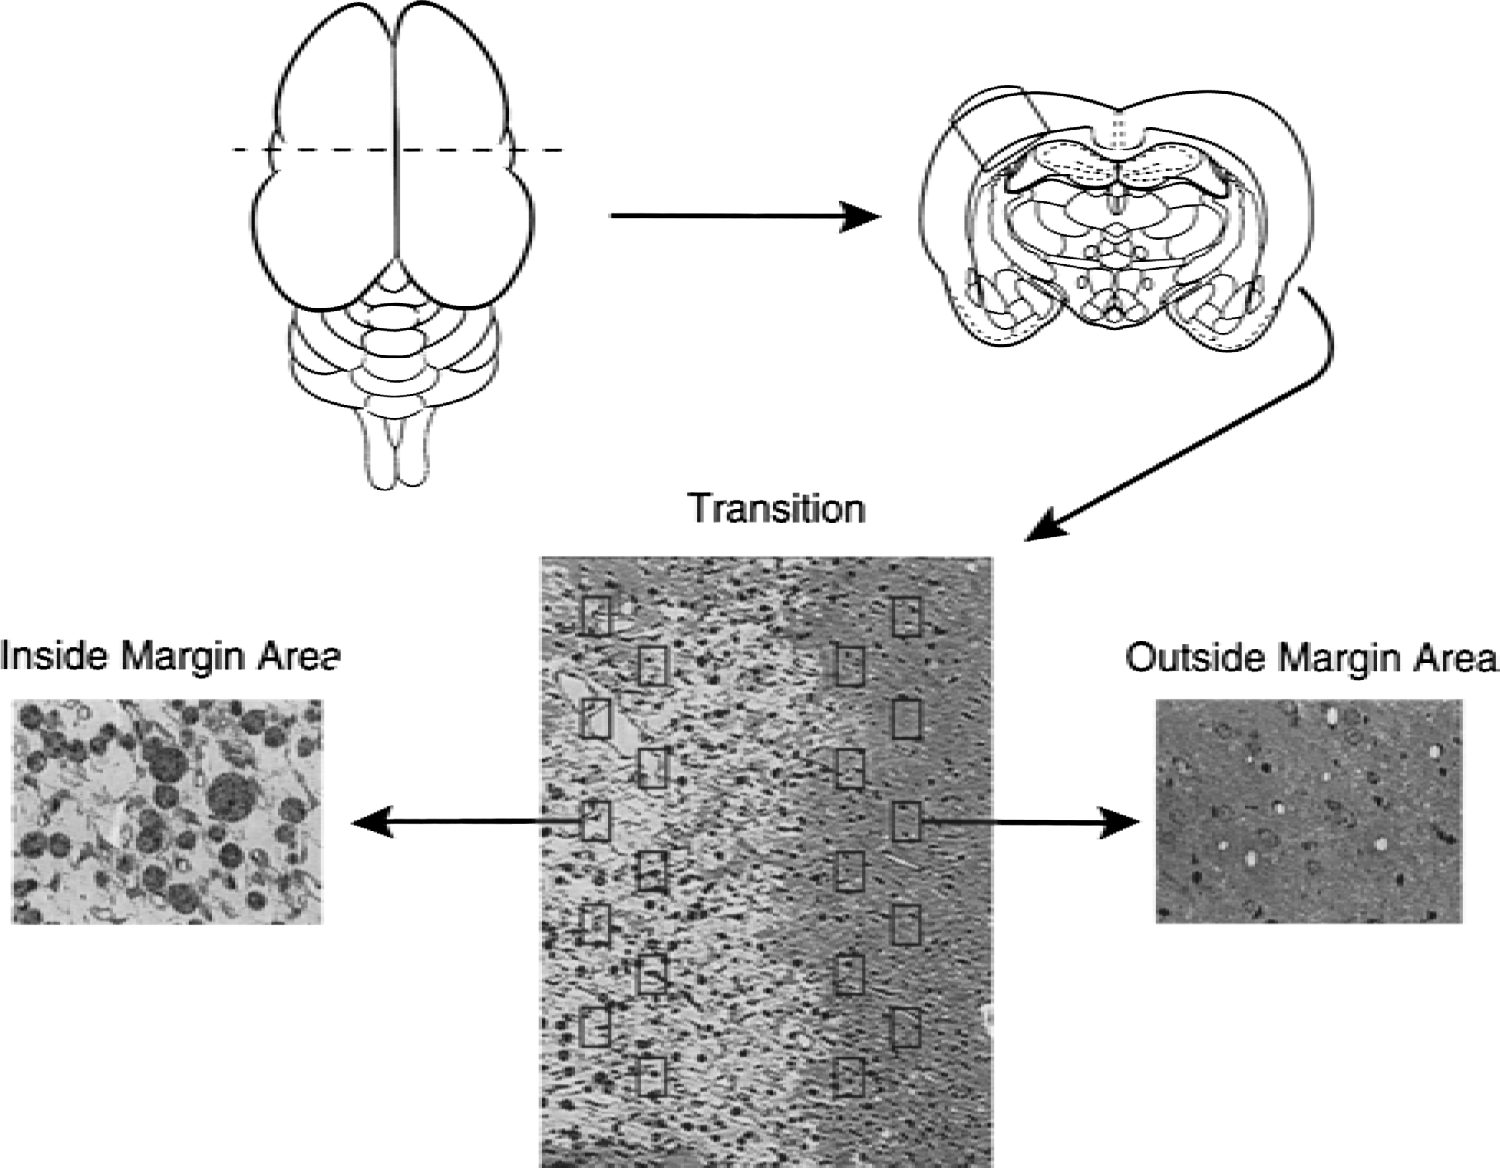
Schematic representation of the sequential steps used to obtain the cortical areas for morphometric analyses of microvascular densities. A midparietal coronal block (1-mm-thick) is cut 7 mm posterior from the tip of the frontal pole. After fixation, this coronal block is laid flat, and a 4 × 2-mm block is cut and embedded in plastic. From this embedded block, a 1-μm semithin section is cut and stained with toluidine blue. The “Inside Margin Area” (IMA) and “Outside Margin Area” (OMA) areas are identified under low power magnification if a visible cyst is present, or are arbitrarily defined (see Methods) if no cyst is visible. Using a random start point, 10 counting frames are systematically placed on the OMA and IMA and all visible microvessels are measured using standard stereologic counting rules and formulae.
Each section was analyzed using a Pulnix TMC-7 video camera attached to an Olympus CH2 microscope and the Image Pro Plus (IPP) image analyzer, version 4.0 (Media Cybernetics, Seattle, WA) installed on a Pentium II PC. The following five stereologic features of microvessels were measured (Weibel, 1989):
Numerical density (NA): total number of microvessel profiles per unit area of tissue (# of microvessels/mm2).
Volume density (Vv): total microvessel volume per unit volume of tissue (%).
Length density (Lv): total length of microvessels per unit volume of tissue (mm/mm3).
Surface density (Sv): total surface of microvessels per unit volume of tissue (mm2 /mm3).
Diameter (D): mean short-axis of the lumena of microvessels (μm).
If a cyst (area of pannecrosis) was visible on the section, the cortical region within the cyst margin was labeled “Inside Margin Area” (IMA). The “Outside Margin Area” (OMA) contained the cortical region beyond the cyst margin and faced the medial-dorsal cortex. Sections from ischemic brains with no cyst formation were oriented so that the OMA included the cingulate and motor fronto-parietal cortices, and the IMA included the somatosensory fronto-parietal cortex. In each of the tissue areas (OMA or IMA), 10 images (counting frames) of the tissue were systematically captured after a randomly chosen start point. Each digitized image was displayed (final magnification 1,160×) on the computer monitor screen using IPP. Using software features available in IPP, a rectangle of 0.0145 mm2 was positioned on each image, which was chosen because the authors' preliminary studies showed this sampling area was sufficient to allow for a standard error (eA2) ≤15% for all 5 stereologic measures. For normal brains, 10 images were obtained from the medial-dorsal and another 10 images from the lateral cortices. Only layers II to V of cortex were used because microvessels in these layers are considered to be isotropically oriented, a key assumption for the stereologic equations (McMillan et al., 1994). Neuronal cells of these cortical layers are selectively vulnerable to ischemic insults and to expressing immunoreactive VEGF. These layers also contain the most densely vascularized areas of the cortex (Mironov et al., 1994). All microvessels present within the sampling rectangle, regardless of size, were included in the study; vessels with more than one cell wall thickness, that is, arterioles or venules, were excluded. Those microvessel profiles that touched the left and/or bottom border of the rectangle were excluded (Weibel, 1989). Microvessels of all shapes (round, oblong, curved, ovoid, short, and long straight profiles) were included.
In each image, the lumenal border of all the microvessels included for analysis was manually outlined. The total number of the outlined vessels, along with the area, perimeter, and short-axis diameter of each lumen, then was automatically computed. Data collected from the 10 images were applied to the standard stereologic formulas used to calculate the Na, Vv, Sv, and Lv.
NA = total number of microvessel profiles/0.145 mm2 of tissue
Vv = (total area of microvessel profiles [in mm2]/0.145 mm2 of tissue) × 100
Lv = 2 (total number of microvessel profiles/0.145 mm2 of tissue)
Sv = (4/π) (total perimeter of microvessel profiles [in mm]/0.145 mm2 of tissue)
In each of the 10 images, the number of macrophages also was counted manually. Macrophages were characterized by morphologic evidence of phagocytic activity (inclusion of visible ingested material within the cytoplasm). At light microscopy level, these cells appear as distinct, dark circular cells with inclusions (Fig. 2I). To confirm that these cells were macrophages, the authors also observed the ultrastructural morphology. In addition to obvious evidence of phagocytic activity (phagosomes and residual bodies), fine structure of these phagocytes included an indented or kidney-shaped nucleus, presence of both primary and secondary lysosomes, and irregular surface folds and projections (lamellipodia). Heterochromatin was typically clumped around the nuclear envelope (Fig. 2J).
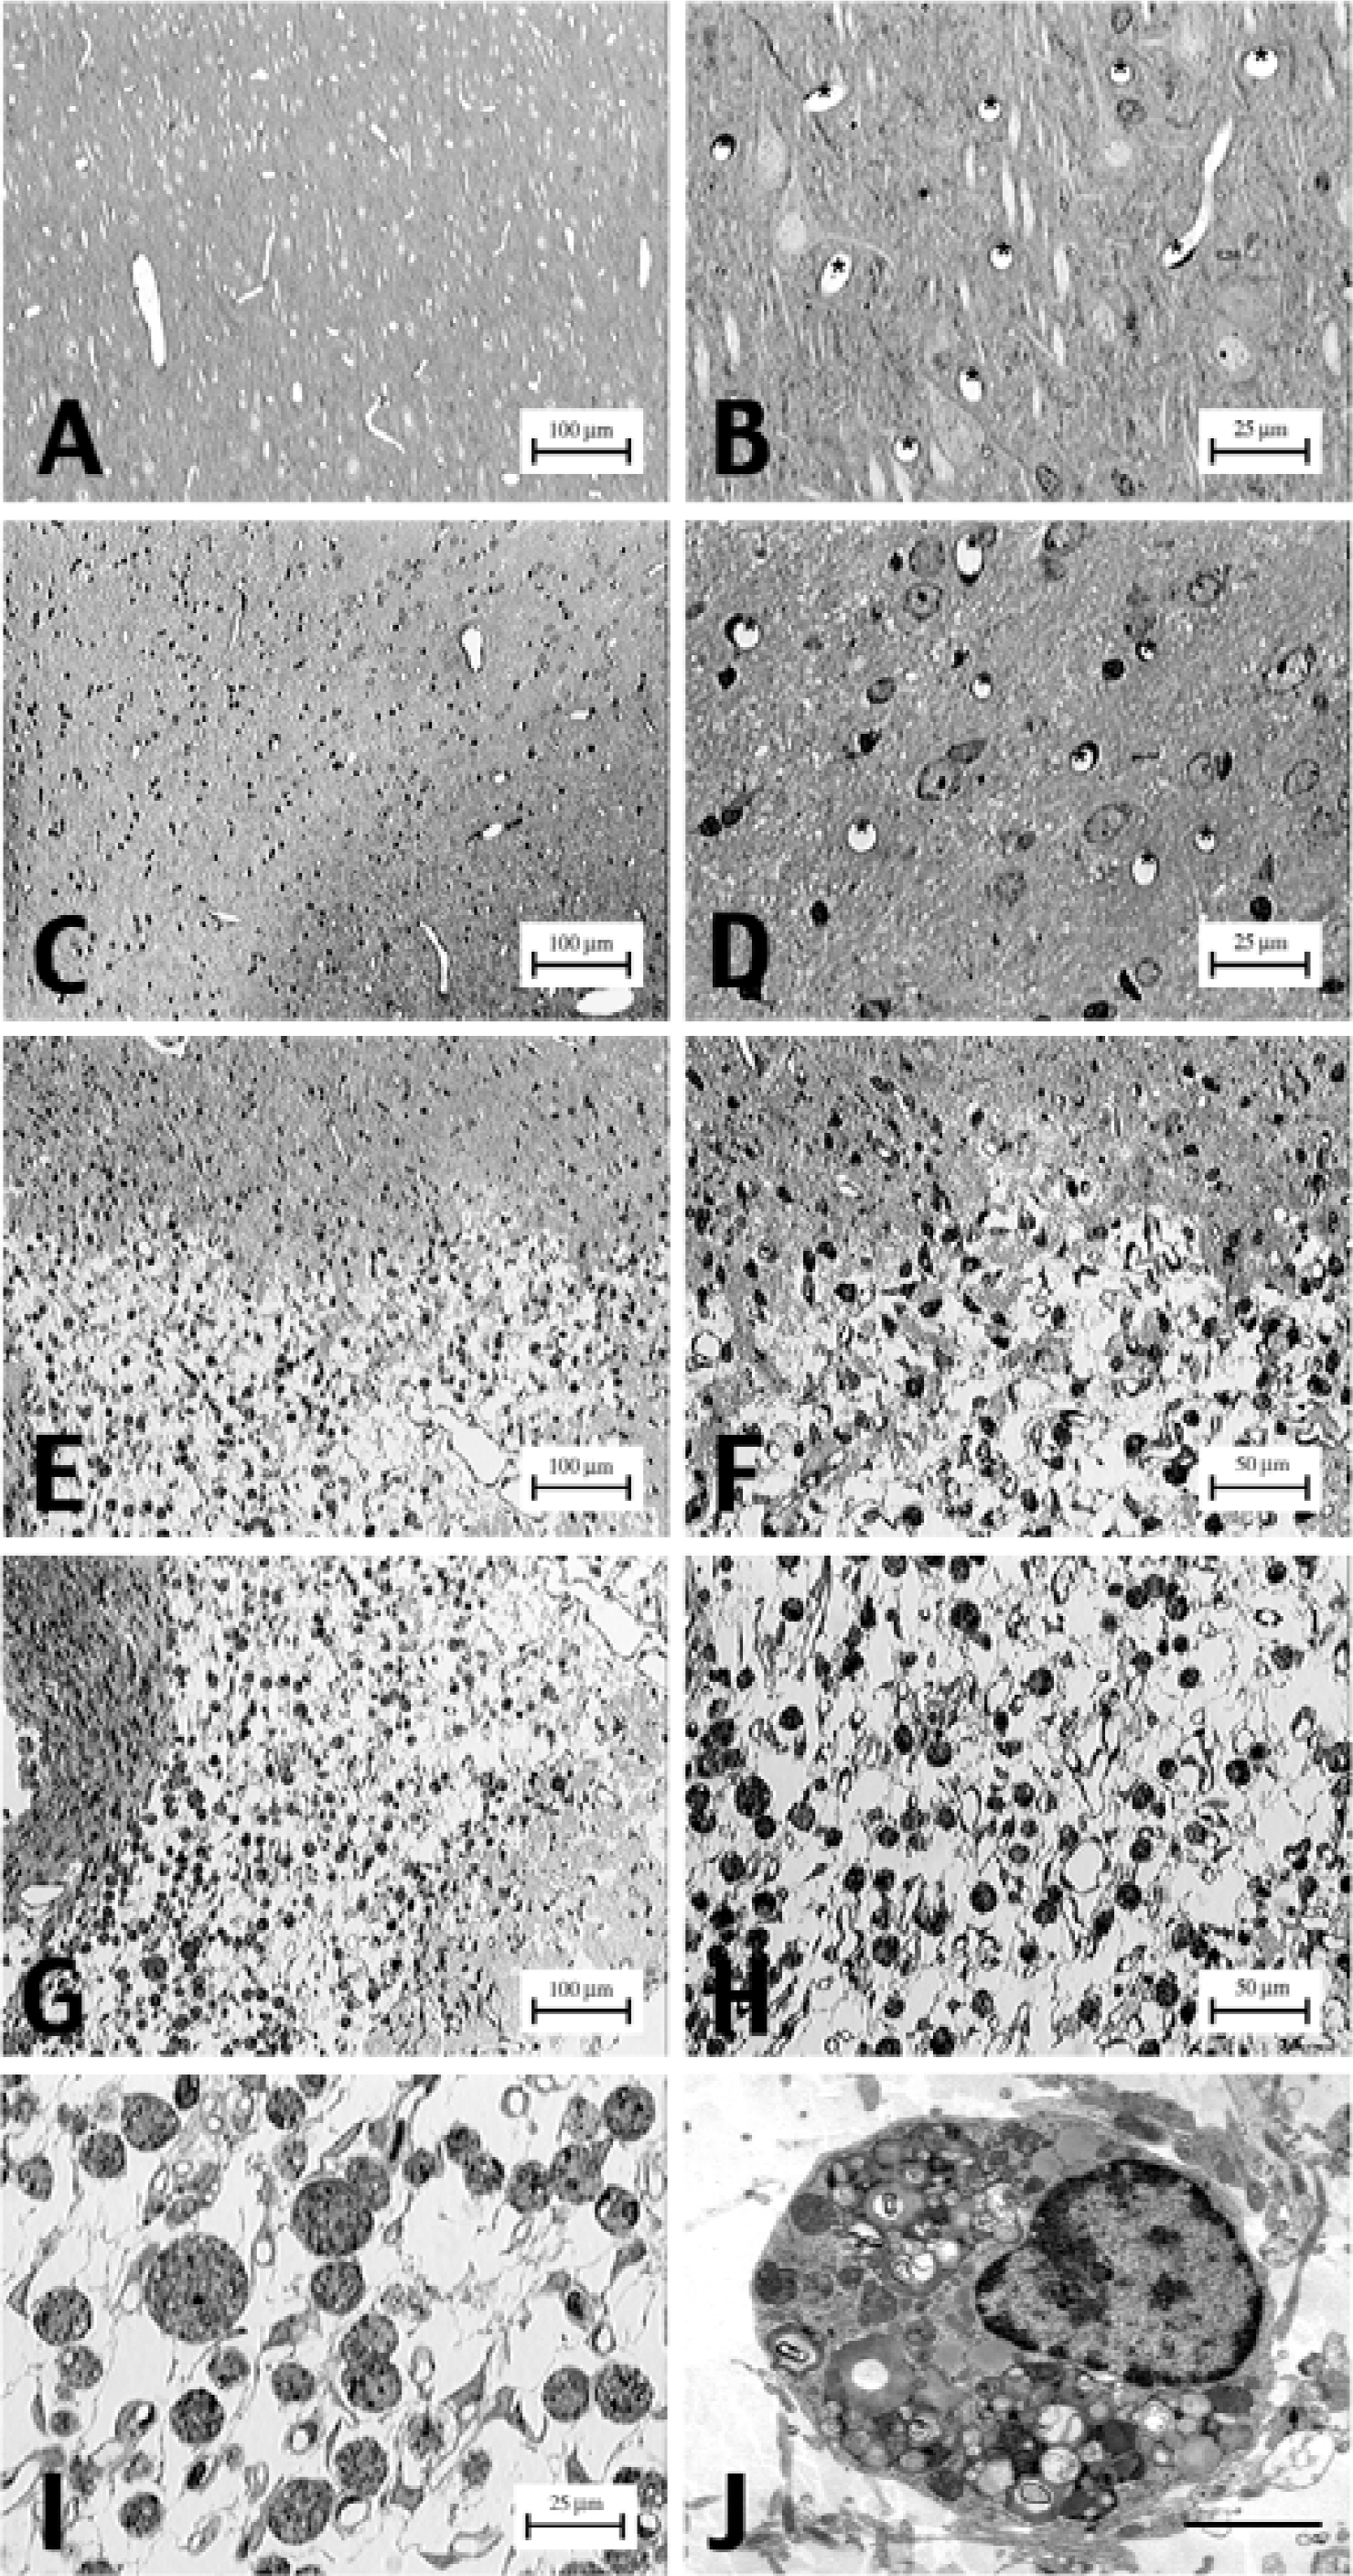
Neuropil morphology and microvessel profiles of normal and infarcted cortical tissues. Semithin sections of both normal and infarcted tissues were taken from the left brain midparietal hemisphere.
RESULTS
Histopathologic changes for all of the lesioned animals were confined to the ischemic fronto-parietal cortices supplied by the MCA; the cortical region vascularized by the ACA appeared unaffected in all subjects. Cortical lesions evolved into extensive pannecrosis between 7 to 19 days of reperfusion. Neuronal changes, including shrunken cell bodies, perineuronal vacuolations, and pyknotic nuclei, were prominent throughout neocortical layers II to VI. Increased numbers of glial cells, presumably activated microglia and astrocytes, occurred in areas of the neuronal changes. Cyst formation, that is, pannecrosis, occurred in most of the brains.
To determine whether brain regions differed, the authors initially studied frontal, midparietal, and occipital regions of normal brains. Mean and standard deviation values of the microvascular parameters from the medial-dorsal and lateral portions of each brain region are summarized in Table 1. No significant differences were found among the six brain areas studied. The mean diameter of all vessels was 5.295 ± 0.067 μm, and mean number of profiles/mm2, NA, was 426.96 ± 12.33. The mean volume density, Vv, was 1.862% ± 0.076%, the mean length density, Lv, was 853.92 ± 24.66 mm/mm3, and the mean surface density, Sv, was 13.10 ± 0.45mm2 /mm3. There was no gradient from frontal to occipital regions and no difference between dorsal-medial versus lateral cortex for any of the measures. The mid-parietal, that is, the 7-mm postfrontal section, was selected for further studies because infarct cysts were reproducibly found in this area.
Microvascular measurements in normal brain
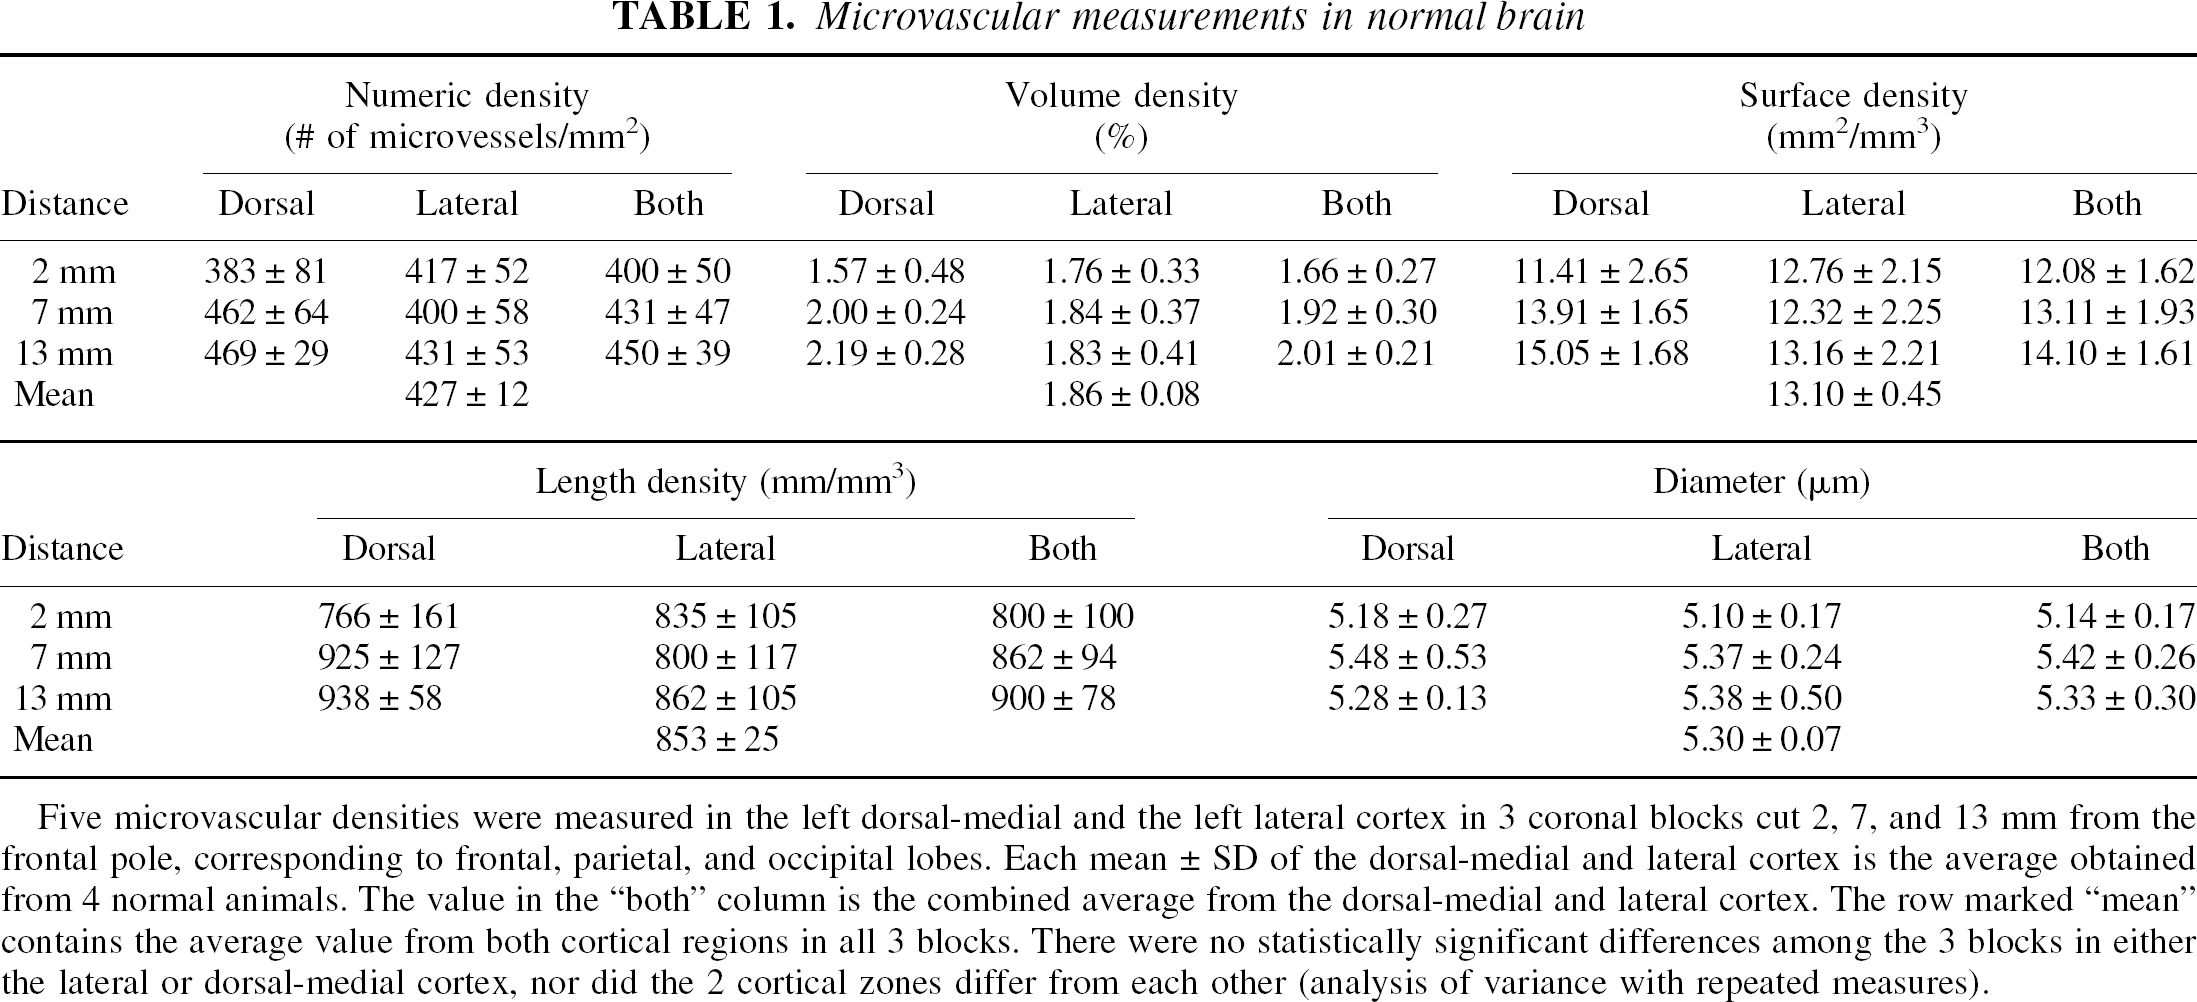
Five microvascular densities were measured in the left dorsal-medial and the left lateral cortex in 3 coronal blocks cut 2, 7, and 13 mm from the frontal pole, corresponding to frontal, parietal, and occipital lobes. Each mean ± SD of the dorsal-medial and lateral cortex is the average obtained from 4 normal animals. The value in the “both” column is the combined average from the dorsal-medial and lateral cortex. The row marked “mean” contains the average value from both cortical regions in all 3 blocks. There were no statistically significant differences among the 3 blocks in either the lateral or dorsal-medial cortex, nor did the 2 cortical zones differ from each other (analysis of variance with repeated measures).
Significantly increased microvessel density was found in the animals subjected to 4 hours MCA occlusion (Table 2). The IMA regions had significant increases in number, volume density, surface area density, and length density as compared with the OMA regions (Table 2, paired t-test, P < 0.05). After correcting for multiple comparisons (Bonferroni), the differences in volume density and surface area density remained significant. Macrophages were found only in the IMA. There was no difference in the microvessel diameter in the IMA compared with the OMA. Comparing the measurements over the several days of reperfusion, there were no significant differences, although the number of subjects studied at each time point is small, raising the possibility of Type 2 error. Compared with the parietal lobe measurements from the normal subjects (Table 1), all IMA measurements, but none of the OMA measurements, were significantly elevated (uncorrected t-test, P < 0.05).
Microvascular measurements in ischemic brain
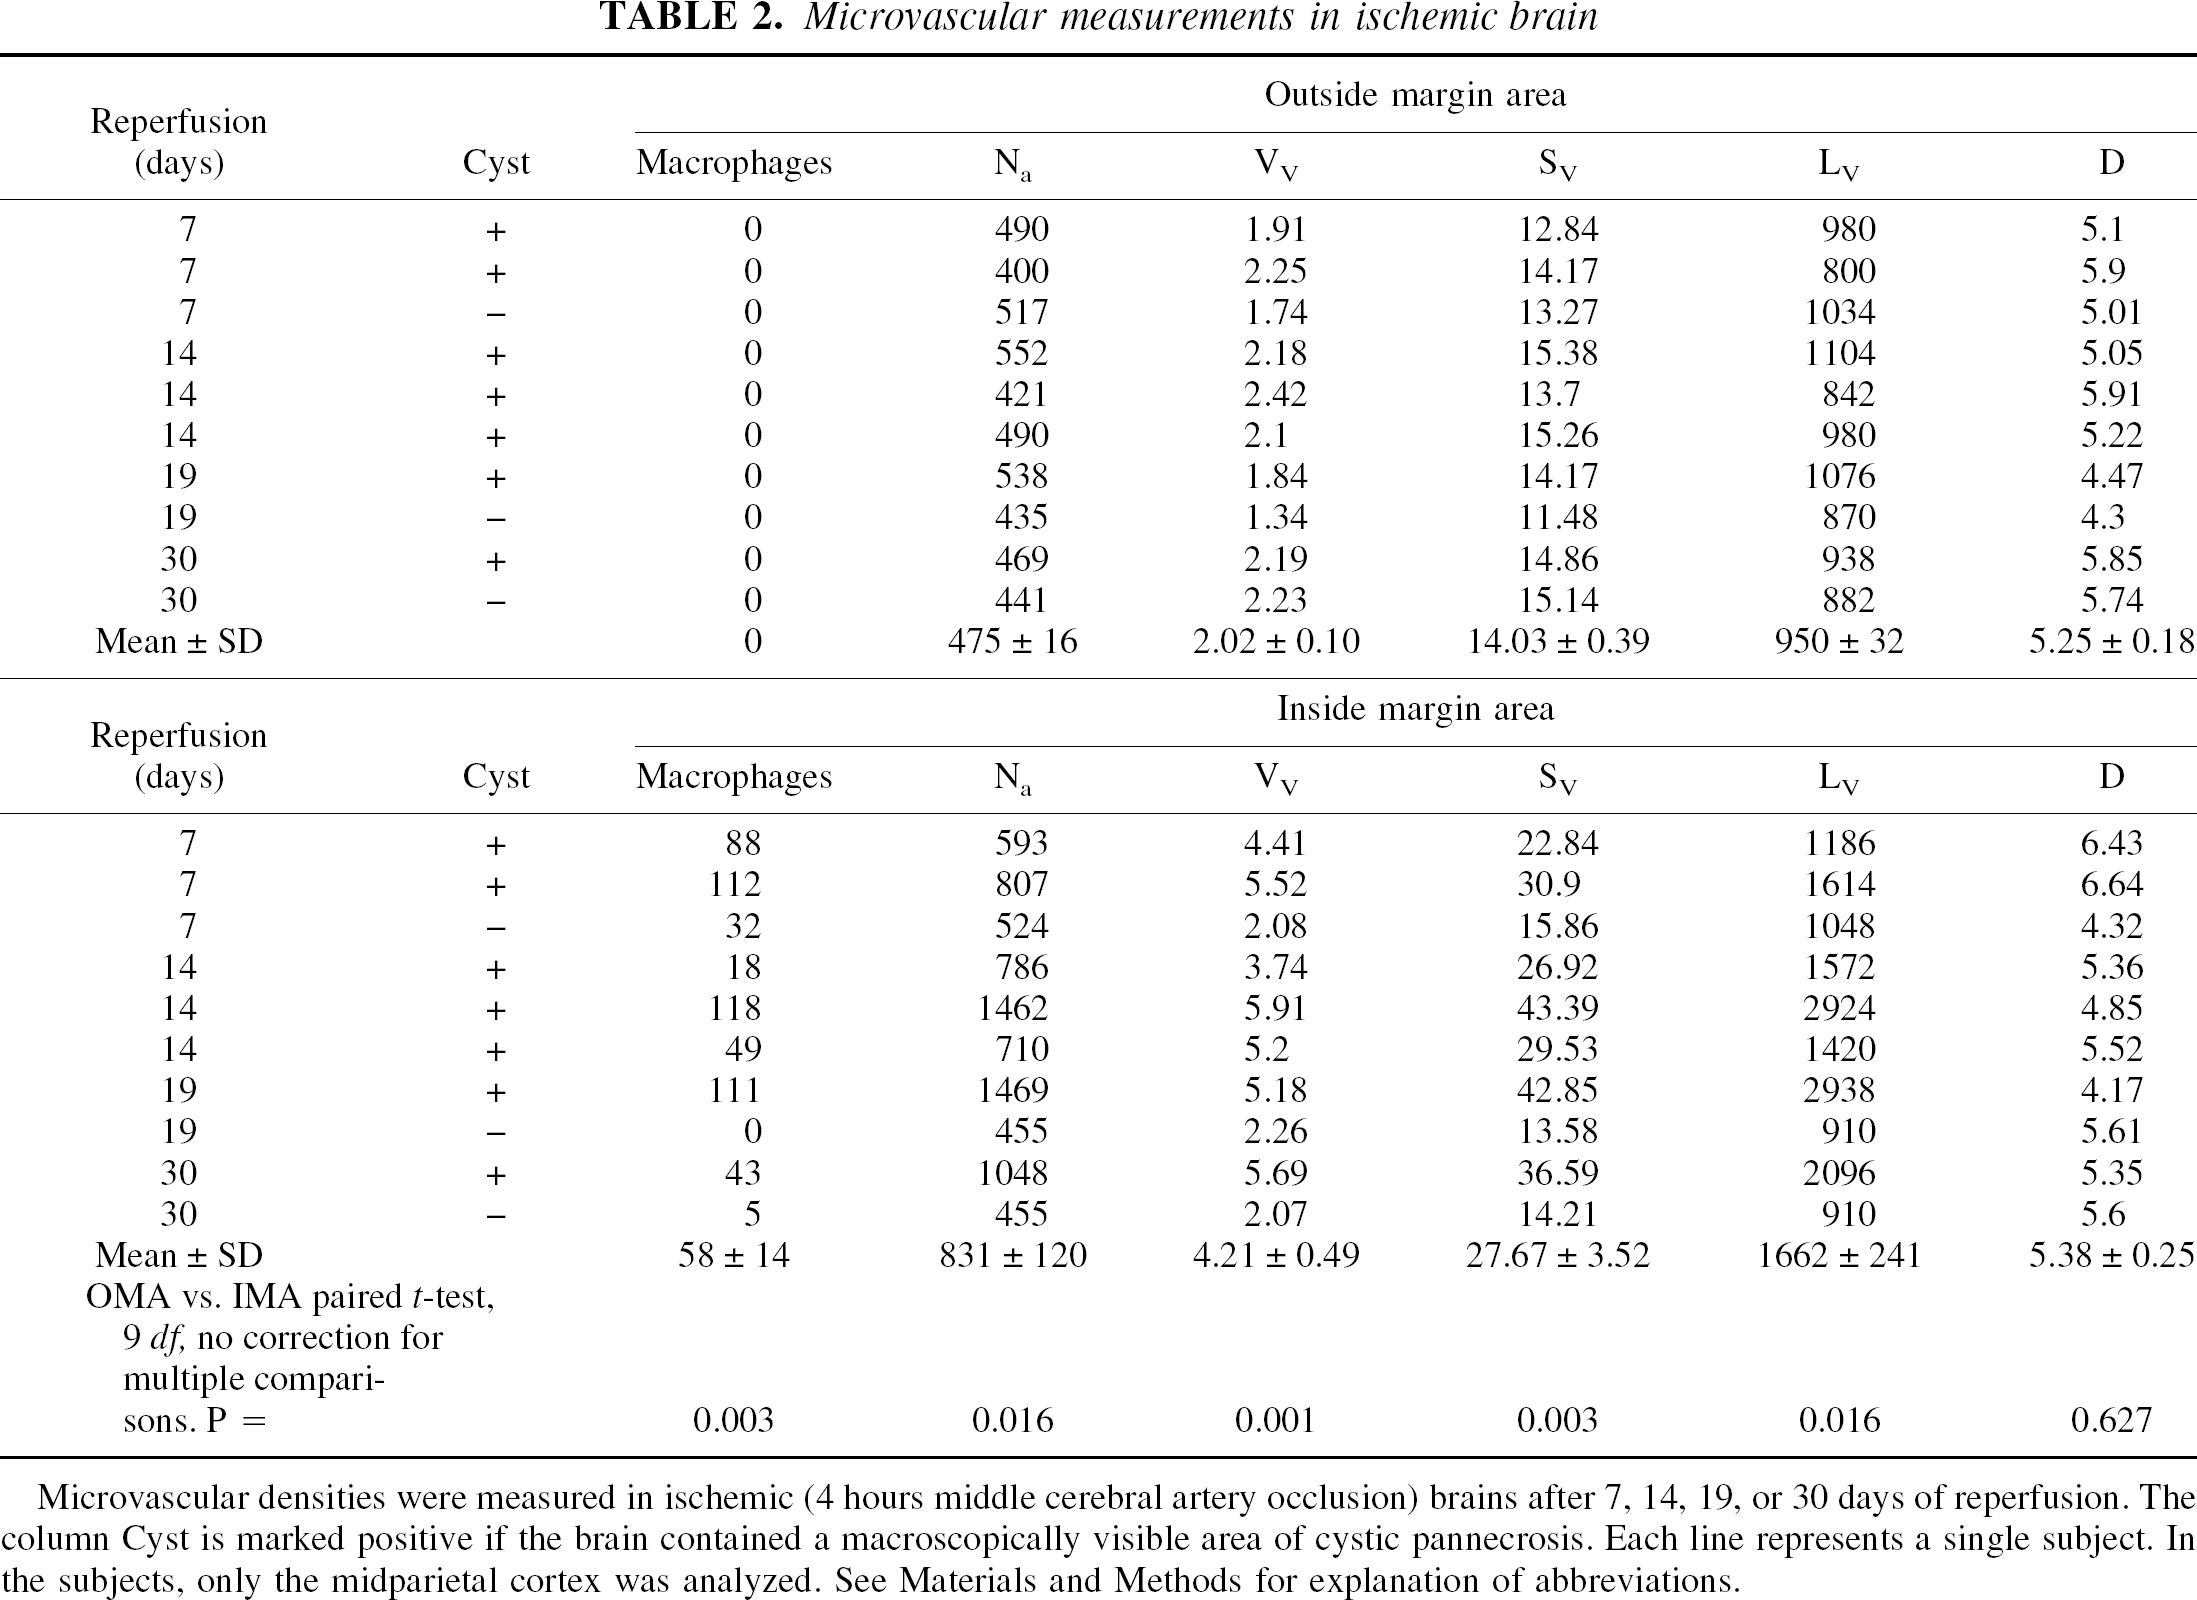
Microvascular densities were measured in ischemic (4 hours middle cerebral artery occlusion) brains after 7, 14, 19, or 30 days of reperfusion. The column Cyst is marked positive if the brain contained a macroscopically visible area of cystic pannecrosis. Each line represents a single subject. In the subjects, only the midparietal cortex was analyzed. See Materials and Methods for explanation of abbreviations.
Cystic pannecrosis was noted in 7 of 10 subjects. Around the cysts, elevated microvessel densities were noted only in those sections containing macrophages in the IMA (Table 2). The OMA of these cyst-containing cortices, in contrast to the IMA, possessed microvascular parameter values within normal range (Table 3). Typical sections are shown in Fig. 2. In the three subjects with no cystic pannecrosis, IMA macrophages were seen in two and microvessels did not appear to be elevated significantly. In the injured, noncystic areas (OMA of brains with cysts and the IMA of brains without cysts), increased numbers of microglial cells were observed. These microglial cells did not contain inclusions and therefore were not considered as mature macrophages nor were they included in the current study.
Effect of cystic pannecrosis on microvascular densities
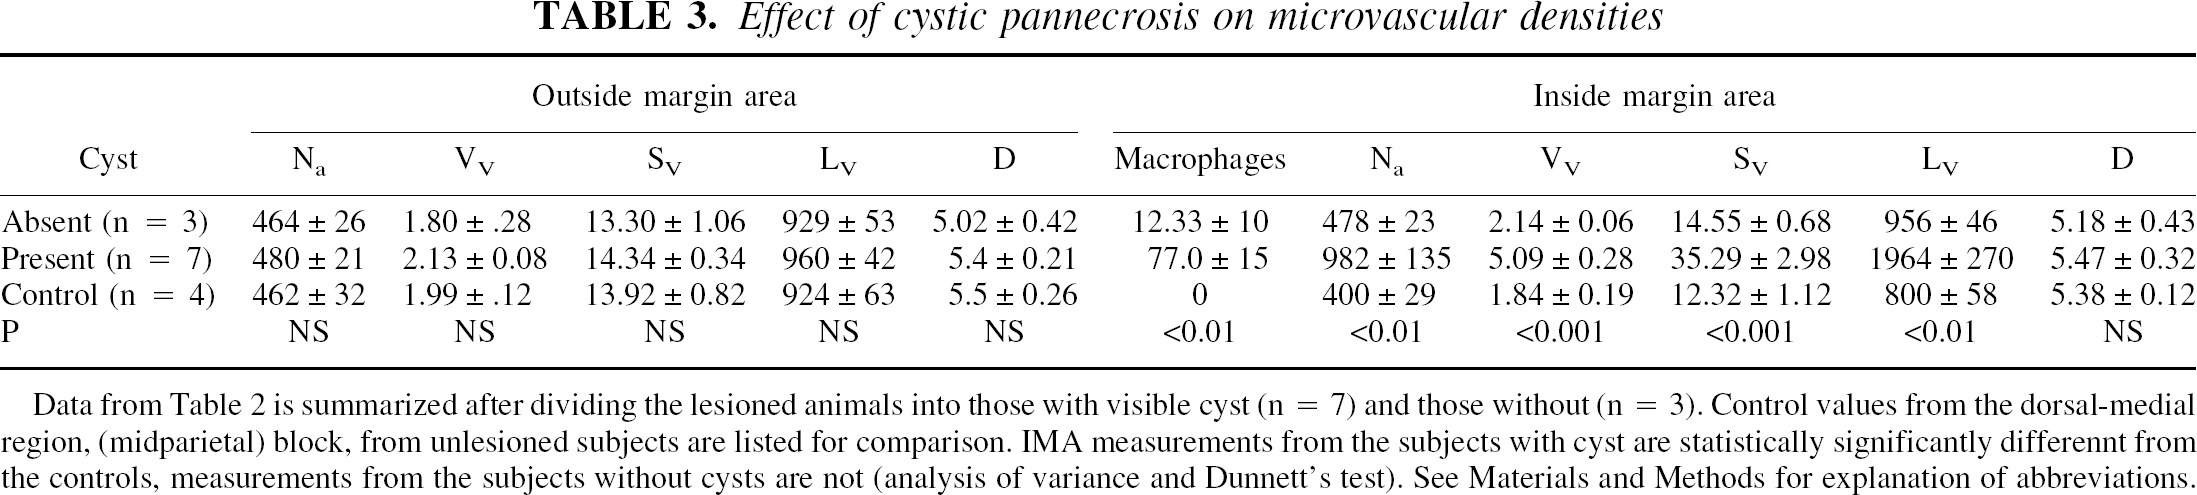
Data from Table 2 is summarized after dividing the lesioned animals into those with visible cyst (n =7) and those without (n =3). Control values from the dorsal-medial region, (midparietal) block, from unlesioned subjects are listed for comparison. IMA measurements from the subjects with cyst are statistically significantly differennt from the controls, measurements from the subjects without cysts are not (analysis of variance and Dunnett's test). See Materials and Methods for explanation of abbreviations.
Figure 2A to 2I shows the neuropil morphology and microvessel profiles of normal and ischemic tissues at light microscopy level. Note that in Fig. 2B, which represents normal cortex at high power magnification, the number of microvessel profiles seen is 10; each profile is marked by an asterisk. In Fig. 2D, which is the OMA of a 19-day brain with a cyst, the number of microvessel profiles is 8. In Fig. 2I, which represents the IMA of the same 19-day brain with a cyst, the number of profiles is 29. This area also shows increased numbers of macrophages (circular cells with inclusions). Figure 2J demonstrates the ultrastructure of one of the macrophages, confirming the light microscopic impression that these cells are macrophages.
To quantify the relation between microvessel density and macrophage numbers, data from all sections using regression analysis were compared. Data from the OMA were not included because no increase in macrophage number or change in microvascular parameters was seen. Volume density showed positive linear correlation with increased number of macrophages (Pearson r = 0.85, R2 = 0.7, P < 0.001). Similar correlations were noted for numeric, surface, and length densities. No significant change in average microvessel diameters occurred with increased numbers of macrophages, although the average diameter tended to decrease with increasing numbers of macrophages (r = 0.02, R2 = 0.083, P = 0.94).
DISCUSSION
The current data demonstrate a quantitative relation between changes in microvascular densities and increased numbers of macrophages in ischemic brain after stroke. The authors used 4 hours of MCA occlusion to produce large cystic infarctions; shorter occlusion times did not reproducibly cause cystic infarctions. Changes in microvascular densities occurred only in the brain regions infiltrated by macrophages, which were almost exclusively the cortical areas immediately adjacent to the cyst formed after about 1 week of reperfusion after 4 hours MCA occlusion. In ischemic brains without cysts or macrophages, microvascular densities were similar to those of normal brains. These data are consistent with a ‘clean-up’ hypothesis for angiogenesis after ischemia: new microvessels are formed to facilitate removal of necrotic debris and then are degraded when no longer necessary. However, the data do not exclude other functions of angiogenic signals after ischemia.
Many angiogenic growth factors up-regulate after ischemia, including acidic and basic fibroblastic growth factors, transforming growth factor-α, transforming growth factor-β, tumor necrosis factor-α, angiogenin, and interleukin-8, but none appear to be as pivotal as VEGF (Ferrara and Davis-Smyth, 1997). Vascular endothelial growth factor is a potent mitogen for endothelial cells but not other cells. Vascular endothelial growth factor also is known as vascular permeability factor and may play an essential role in ischemic edema caused by blood–brain barrier opening (Senger et al., 1983). Infusions of VEGF produce a robust increase in endothelial cells, capillaries, and up-regulation of the receptors flk-1 and flt-1 (Rosenstein et al., 1998).
The “clean-up” hypothesis requires a degradation-signaling event late after ischemia, and Angiopoieitin-2 (Ang2) appears to be a suitable candidate (Davis et al., 1996; Maisonpierre et al., 1997). Consistent with this, Hsu and colleagues recently documented an increase in Ang2 mRNA (whole hemisphere rt-PCR) 2 weeks after MCA occlusion (Lin et al., 2000). Therefore, the authors propose the following framework for the “clean-up” hypothesis: after ischemia, VEGF increases immediately, followed by Ang2, causing destabilization of the blood–brain barrier. Granulocytes enter during the first 6 to 12 hours, followed by edema and macrophage infiltration over several days. Vascular endothelial growth factor is continuously secreted over 7 days, whereas Ang2 expression abates. At 14 days, as VEGF levels wane, there is a degradation of microvessels, which may be complete by 30 days. The authors hypothesize that a second increase in Ang2 at approximately 14 days provides the signal for microvessel degradation.
The involvement of leukocytes and monocytes/macrophages in ischemic brain after stroke has been well characterized. These inflammatory cells contribute primarily to phagocyte-mediated tissue debridement and scar formation days to weeks after stroke and are involved with postischemic hypoperfusion, neuronal dysfunction, and blood–brain barrier permeability (Garcia and Kamijyo, 1974). Maximal numbers of inflammatory cells accumulate in the ischemic area at different times. Accumulation of polymorphonuclear leukocytes is maximal at 24 to 72 hours, followed by monocytes and macrophages at approximately 7 to 16 days (Garcia and Kamijyo, 1974). Because increased numbers of microvessels were not visible until 7 to 14 days after ischemia, the authors chose to study the macrophages in relation to cortical microvascular parameters at different days of reperfusion after MCA occlusion.
After ischemia, macrophages arise from two sources: parenchymal microglial cells and the blood-borne monocytes. Microglial cells may develop into amoeboid microglia (brain macrophages) when neurons are lethally injured. Both the activated microglial cells and the monocyte-derived macrophages are capable of inducing neuronal cell death and neurologic dysfunction through secretion of cytotoxic factors (Yamasaki et al., 1996). Furthermore, macrophages produce a wide range of angiogenic factors (Weihrauch et al., 1994; Yamasaki et al., 1996; Leek et al., 2000). The current results suggest that increased numbers of macrophages must be present in the ischemic brain before changes in microvascular parameters are observed, but the data do not reveal whether the macrophages promote angiogenesis, or vice versa, or whether one initiating signal elicits both the inflammatory cellular response and angiogenesis. Immunocytohistochemical staining could not be performed for activated microglia because the sections were plastic embedded. Further investigations should focus on elucidating this interaction.
Regional cerebral blood flow correlates strongly with the number and volume fraction of microvessels (Pawlik et al., 1981; Bell and Ball, 1985; Gross et al., 1986; Klein et al., 1986; Buchweitz-Milton and Weiss, 1988). Volume density relates to the maximum volume of blood that could be flowing within the microvascular system. Changes in volume density and diameter are important descriptors of microvessel hypertrophy or fusion. The resistance to blood flow through microvessel networks is a function of microvessel diameter, as well as microvessel length, density, and branching. The rate of blood–brain exchange is proportional to microvessel surface area and length density. Each of these morphologic descriptions can be determined from application of stereologic principles for tubular profiles, such as those of the microvessels in planar sections (Weibel, 1989). The authors measured all of them because they could not predict which variables might best describe microvascular changes after ischemia. An equivalent effect of ischemia was found on all measurements except mean diameter, suggesting that in future studies fewer parameters could be measured. The authors propose that volume density and diameter measurements could fully describe the changes after ischemia.
Because changes in microvascular parameters were seen only in areas of increased numbers of macrophages, it could be argued that the increase in microvessel parameters was because of necrotic shrinkage of tissue (atrophy). The “angiogenesis” in ischemic brain observed in the current study and by other investigators (Persson et al., 1989; Krupinski et al., 1997) could result from shrunken tissue caused by neuropil phagocytosis and retention of the microvessels. Although tissue shrinkage cannot be ruled out, it is more likely that the increased number of microvessel profiles stemmed from formation of new vessels, because densities were elevated in the 7-day-old infarcts where there is little tissue shrinkage. Detailed studies using markers of neovascularization are needed clarify this point.
The authors relied solely on the morphologic characteristics of macrophages for identifying the cells. Immunohistochemical methods for identifying macrophages were not used because no marker exists that labels transformed brain microglial phagocytes separately from blood-borne monocytes. To minimize error in identifying the cells, the current study included only the cells that displayed characteristics of mature macrophages. The authors confirmed their light microscopy observation by examining the ultrastructural features of these cells (Fig. 2J). Their reliance on morphology may appear limiting because it does not allow for the differentiation of activated microglia from the blood-borne macrophages. This is not problematic because their focus was to evaluate the correlation of microvascular parameters with mature macrophage number in ischemic brain, regardless of the sources of these macrophages. Using morphology to identify macrophages in ischemic brain also was used by other investigators (Persson et al., 1989; Chen et al., 1994). Using commonly used immunohistochemical methods for identifying macrophages would have unnecessarily complicate the current study for a number of reasons: there may have been variable preservation of the target antigens after ischemia, fixation, postfixation embedding, and staining. Also, markers such as OX42 (CR3 receptor or CD11b) localize for resting, activated, and phagocytic microglial cells, along with other leukocytes in addition to macrophages. Similarly, ED1, CD11a (LFA-1α), CD18 (LFA-1β), OX18 (MHC class I), OX6 (MHC class II), nonspecific esterase, Mac-1, d-galactosyl–specific B4 isolectin, and acetylated low-density lipoprotein receptors localize to activated microglial cells, monocytes, and leukocytes (Kato et al., 1996; Gregersen et al., 2000). Therefore, relying on morphology from 1-μm semithin sections offered not only convenience but also sufficient precision to identify mature macrophages without the confounds inherent in using immunohistochemical markers.
The authors avoided the term “penumbra” when referring to the different cortical areas used in these analyses. Rather, the terms “Outside Margin Area” (OMA) and “Inside Margin Area” (IMA) were arbitrarily coined when referring to the two cortical areas evaluated on the tissue sections. Because the tissue preparation negated the possibility of regional cerebral blood flow measurements, the authors could not identify the penumbra based on known regional cerebral blood flow. The current findings reflect events associated spatially with pannecrosis and cyst formation, that is, in or outside of the cyst margin. Whether these areas were supplied by penumbral levels of blood flow remains to be determined.
The authors demonstrated a powerful relation between macrophages and microvessel density after cerebral ischemia. Increased microvessel density was detected only in regions also containing macrophages, suggesting a role in postischemic “clean-up” of necrotic debris. Further studies are necessary to clarify the signaling events that control these vascular changes and to determine if there are other protective or recovery-promoting actions arising from postischemic angiogenic and other regulatory signals.