
Abstract
We have previously shown by direct comparison with autoradiographic and biochemical measurements that the
Introduction
The
The present study was undertaken to test the sensitivity of the
Materials and methods
Kinetic Model
The model for the behavior of leucine in brain (Figure 1) includes four rate constants: K1 and k2 for carrier-mediated transport from plasma to brain and back from brain to plasma, respectively; k3 for metabolism of leucine to yield CO2; and k4 for incorporation of leucine into protein. The rate constants are identical for the labeled and unlabeled species, except that we have included a rate constant for breakdown of unlabeled tissue protein, k5, in the model; we assume that there is no significant breakdown of the labeled protein during the experimental interval. Unlabeled leucine is assumed to be in a steady state.
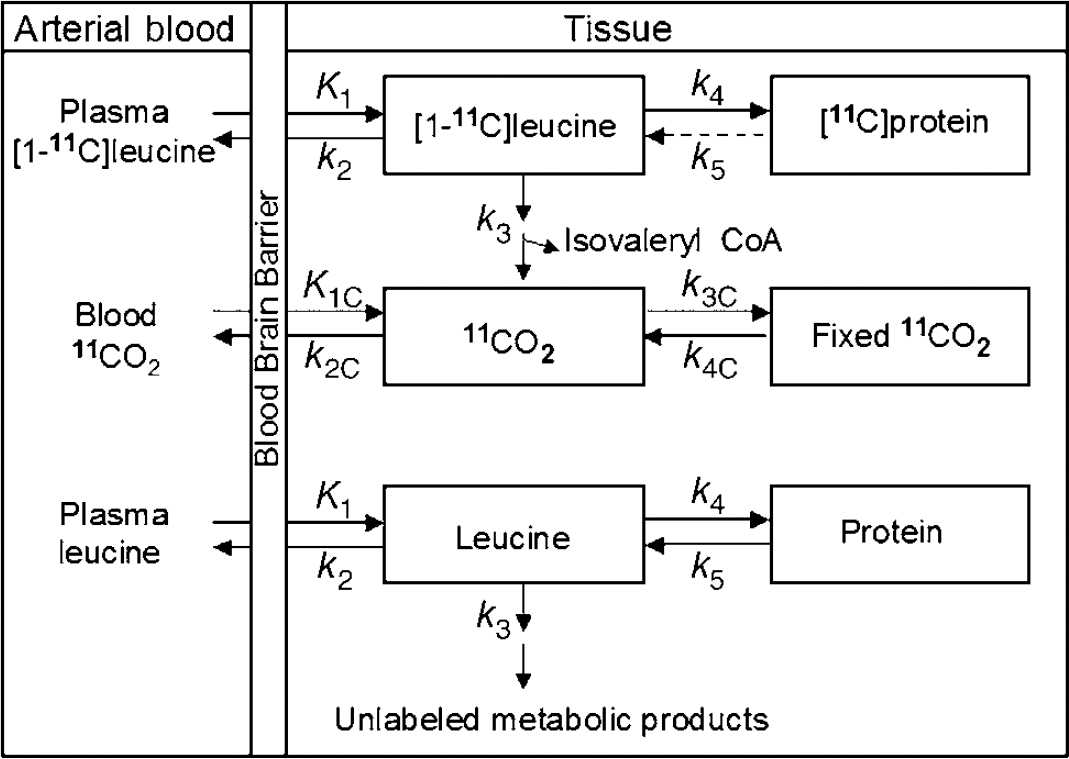
Compartmental model of leucine in brain. The exchangeable pool in brain (either labeled or unlabeled) includes intracellular, extracellular, and tRNA-bound leucine. K1 and k2 are the rate constants for carrier-mediated transport of leucine from plasma to tissue and from tissue to plasma, respectively. k3 is the rate constant for the first two steps in the catabolism of leucine, which includes a transamination reaction followed by a rapid decarboxylation. The rate constant for leucine incorporation into protein is represented by k4, and that for release of free leucine by protein degradation is k5. Unlabeled leucine is assumed to be in a steady state. Owing to the long half-life of proteins in brain, it is assumed there is no significant loss of label from the radioactive protein within the experimental period, i.e., k5 [(11C)protein] = 0. After an injection of leucine labeled on the carboxyl carbon, the only possible labeled metabolites in brain are α-ketoisocaproic acid (α-KIC), CO2, and products of CO2 fixation. As there is very little labeled α-KIC in brain (Keen et al, 1989), this pool is not explicitly represented in the model and k3 combines the transamination and decarboxylation reactions, as noted above. Labeled CO2 can arise either through catabolism of labeled leucine in brain or through influx from the blood after the breakdown of labeled leucine in other tissues; once in the brain it may be either transported from brain to blood or fixed in brain. Pools of labeled CO2 in the arterial blood and brain and labeled products of CO2 fixation in the tissue are also represented in the model. K1c and k2c are the rate constants for influx and efflux of labeled CO2 between brain and blood, respectively, and k3c and k4c represent the rate constants for fixation and loss of fixed CO2, respectively.
The total concentration of 11C in the field of view of the PET camera (C T *) at time T is comprised of free [11C]leucine and [11C]protein in the tissue (CE* and P*, respectively), diffusible 11CO2 in the tissue (CD*), products of 11CO2 fixation (CF*), and activity in the blood in the brain (VbCb*), where Vb is the fraction of the volume occupied by blood and Cb* is the measured total activity in whole blood. It is assumed that 11CO2 in brain is rapidly equilibrated with the arterial blood (Buxton et al, 1987), so that CD* ≈ VDCa*, where Ca* is the measured 11CO2 activity in whole blood and VD is the brain/blood equilibrium distribution volume of 11CO2 (VD = 0.41; Smith et al, 2005). We also assumed negligible fixation of 11CO2 during the experimental period (Buxton et al, 1987; Siesjö and Thompson, 1965), that is, CF* ≈ 0. Therefore,

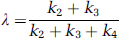
In the course of a study, labeled leucine in the tissue is derived solely from the arterial plasma. Unlabeled leucine, however, is derived from both the arterial plasma and the steady-state breakdown of protein in the tissue. The fraction (Λ) of unlabeled leucine in the precursor pool derived from arterial plasma is defined as

Substituting from the kinetic model
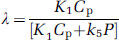
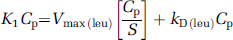
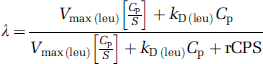
where Cp is the steady-state concentration of unlabeled leucine in arterial plasma and P is the concentration of unlabeled protein in the tissue. The influx of leucine from arterial plasma (K1Cp) not only depends on Cp but also on the plasma concentrations of large neutral amino acids competing with leucine for the transporter at the blood—brain barrier. From Michaelis—Menten kinetics for competitive inhibition at the transporter,
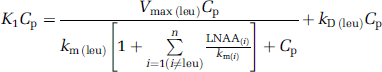
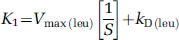
where Vmax(leu) is the maximal transport rate of the saturable transport component for leucine, km(leu) is the half-saturation constant of the saturable component for leucine, LNAA(i) is the arterial plasma concentration of the ith large neutral amino acid that competes with leucine for the transporter (i = methionine, valine, isoleucine, tyrosine, and phenylalanine), km(i) is the corresponding half-saturation constant for the amino acid, and kD(leu) is the rate constant for nonsaturable transport of leucine across the blood—brain barrier. Equation (4) can be rearranged to
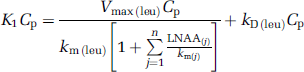
where the sum is now comprised of all the large neutral amino acids that share the carrier, including leucine (j = methionine, valine, isoleucine, leucine, tyrosine, and phenylalanine). If we define S as the denominator in equation (5), that is, as the sum of concentrations of the large neutral amino acids that share the carrier, weighted by their respective half-saturation constants and by km(leu), that is,
then equation (5) can be rewritten as
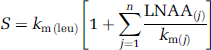
Dividing both sides of equation (7) by Cp yields
Equation (8) defines the relationship between the weighted sum of the large neutral amino acids that share the
The effect of large neutral amino-acid concentrations on influx relates to their effect on Λ (see equation (3)). Recall that unlabeled leucine is in steady state; hence the rates of protein synthesis and degradation are equal, that is,
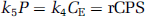
where CE is the concentration of free leucine in the tissue. Substituting equations (7 and 9) into equation (3) yields
Equation (10) explicitly describes the effects that leucine and the weighted sum of the large neutral amino acids have on Λ. As Cp approaches 0, Λ → 0, that is, the only source of unlabeled leucine in the precursor pool for protein synthesis is from protein breakdown. As Cp increases, the weighted sum of all the amino acids (including leucine) necessarily also increases, and Λ → 1, that is, the unlabeled leucine in the precursor pool derived from protein breakdown is negligible, compared with that derived from the arterial plasma. Equation (10) also predicts that an increase in S, with no change in Cp or rCPS, will result in a decrease in Λ. In this study, equation (10) was not used to predict the value of Λ as estimates of the parameters Vmax(leu), kD(leu), and rCPS that are independent of the present data were not available, but rather the equation was used to predict the direction of the change in Λ that would result from the changes in plasma amino acids.
Animals
All procedures were performed in accordance with the National Institutes of Health Guidelines on the Care and Use of Animals and an animal study protocol approved by the Clinical Center Animal Care and Use Committee. We studied four adult male rhesus monkeys (10 to 15 kg). Surgical preparation of the animals under isoflurane anesthesia took place at least 4 weeks before the study and consisted of inserting a polyurethane catheter attached to a Port-A-Cath vascular port (Sims Deltec Inc., St Paul, MN, USA) into a femoral artery and securing the port under the skin of the ipsilateral thigh. Catheters were flushed weekly with heparinized saline to maintain patency. Each animal was studied two to three times under control and once under hyperphenylalaninemic conditions.
Magnetic Resonance Imaging
Magnetic resonance images (MRI) used to identify regions of interest (ROIs) on the PET images were obtained from each of the monkeys while under ketamine anesthesia. Animals were positioned in an MRI-compatible stereotactic head holder. Two animals were scanned with a General Electric Signa 1.5 T scanner (GE Medical Systems, Milwaukee, WI, USA) with a 5-inch GP surface coil. A T1-weighted three-dimensional (3D) gradient echo sequence with RF spoiling (TR (repetition time)/TE (echo time)/flip angle, 25/6 ms/30°) was used with a field of view of 10 cm and slice thickness of 1 mm. Two animals were scanned with a 4.7-T vertical Bruker magnet (Bruker BioSpin Corp., Billerica, MA, USA). A T1-weighted 3D MDEFT (modified-driven equilibrium Fourier transform) was used with 0.5 mm3 isotropic voxel size.
Preparation of l-[1-11C]Leucine
Phenylalanine Infusion
To achieve hyperphenylalaninemia, animals were administered intravenously a programmed infusion of 1.5% (w/v) phenylalanine in normal saline. The infusion was initiated 60 mins before the scheduled
PET Studies
Before each PET study, animals were fasted overnight. In the morning, the animals were sedated with ketamine and intubated, and intravenous lines were inserted into both legs. The head was immobilized in a stereotactic head holder, and the animal was positioned in the PET scanner face forward so that scanning was in a coronal plane. The sedated animal was then anesthetized and studied under isoflurane anesthesia. Isoflurane was maintained at a mean alveolar concentration of 1.0% to 1.1%. Studies were performed with an ECAT High Resolution Research Tomograph (HRRT) (CPS Innovations, Knoxville, TN, USA). Each leucine study was preceded by a 6-min transmission scan to correct for attenuation and three 60-sec H215O (0.15 GBq per scan) scans 15 mins apart to aid in registering PET and MR images. Leucine studies were initiated by the intravenous infusion of
Analysis of Blood Samples
Arterial blood samples were collected every 4 to 10 secs for the first 2 mins and at increasing intervals thereafter to measure the time courses of total 11C and 11CO2 activity in arterial blood and the concentrations of leucine and [11C]leucine in plasma over the 60 mins scan duration. Blood samples were apportioned for the various determinations as follows: (1) Approximately 0.2 to 0.3 mL of blood was transferred to a tube containing 1 N NaOH; the tube was weighed and counted in a gamma counter (Cobra II Auto Gamma, Packard Instrument Co. Inc., Downers Grove, IL, USA) to obtain total activity in whole blood. (2) Approximately 0.5 mL was centrifuged to remove red cells, and 0.2 mL of plasma from each sample was diluted in distilled water and deproteinized at 4°C by the addition of a solution of 16% (w/v) sulfosalicylic acid containing
Positron Emission Tomography Data Analysis
Three-dimensional volumes were constructed for the average of the three [15O]water scans and for each frame of the [11C]leucine scan. The reconstructed [15O]water volume was aligned to the MRI volume by the use of the Automated Image Registration program with a 3D rigid body transformation (Woods et al, 1993); the transformation parameters were subsequently applied to each frame of the [11C]leucine scan to effect its alignment to the MRI volume. Regions of interest were drawn on the MRIs and transferred to the [11C]leucine volumes to compute tissue time activity curves (TACs). We analyzed the brain as a whole, cerebellum, somatosensory cortex, striate cortex, putamen, and corona radiata; and in the four animals studied, volumes (mean ± s.d.) were 100.7 ± 16.3, 10.1 ± 3.5, 0.8 ± 0.2, 4.3 ± 1.2, 1.2 ± 0.5, 2.2 ± 2.0 mL, respectively. For each ROI, the rate constants K1, k2 + k3, and k4, and Vb were estimated by a weighted nonlinear least squares fit of the model to the measured blood curves and tissue TACs (equation (1)) (Schmidt et al, 2005). Assuming Poisson statistics, weights were inversely proportional to the s.d. of the decay-corrected activity in each frame of data as follows:

where γ is the decay constant for 11C, t i the midpoint of Frame i, and Δ i the length of Frame i. (Under Poisson statistics, the s.d. in the number of counts (x i ) in each frame of data equals √x i . Therefore, before decay correction, the mean count rate in each frame of data (y i = x i /Δt i ) has s.d. √y i /Δt i , and the s.d. for the decay-corrected mean count rate (C T (t i ) = eγ t i y i ) is given by √eγti C T (t i )/Δt i ). In equation (11) N is a proportionality coefficient that encompasses other noise effects that are constant in a given region throughout the study; any additional noise effects were not included in the weights. The difference between the tracer arrival time in the brain and the arterial sampling site was estimated by shifting the blood TAC 0 to 10 secs, fitting the whole brain TAC, and selecting the delay time that produced the best fit of the data. Since in human studies, differences in tracer appearance time in various parts of the brain differ from the brain as a whole by not more than ± 2 secs (Iida et al, 1988), the whole brain value was used for all regions in our studies. Label in CO2 fixation products in the tissue was assumed to be negligible. Λ was then calculated from the ratio of rate constants (Schmidt et al, 2005) as follows:
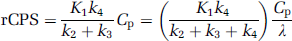
rCPS was computed from the mean arterial plasma leucine concentration, Cp (nmol/mL), and the fitted values for the rate constants (and Λ) for each ROI as
For each study, S, the sum of the amino acids that share the large neutral amino-acid carrier (methionine, valine, isoleucine, leucine, tyrosine, and phenylalanine), weighted by their respective half-saturation constants, km, was computed by equation (6). As km has not been measured in the monkey, values determined in the adult rat were used (Smith et al, 1987). The least squares best fitting straight line between estimates of K1 and 1/S (see equation (8)) were determined for all regions and whole brain.
Statistical Analyses
Paired comparisons were made between the mean of baseline studies in each monkey and its phenylalanine-infused study. Differences in mean values of time-weighted average LNAA concentrations during the 60 min PET study, regional values of Λ and rCPS were analyzed for statistical significance by means of two-tailed paired t-tests. An F-test was used to assess whether the slope of the best fitting line between K1 and 1/S was different from zero.
Results
After initiation of the programmed infusion of
Physiological variables at the time of the PET study
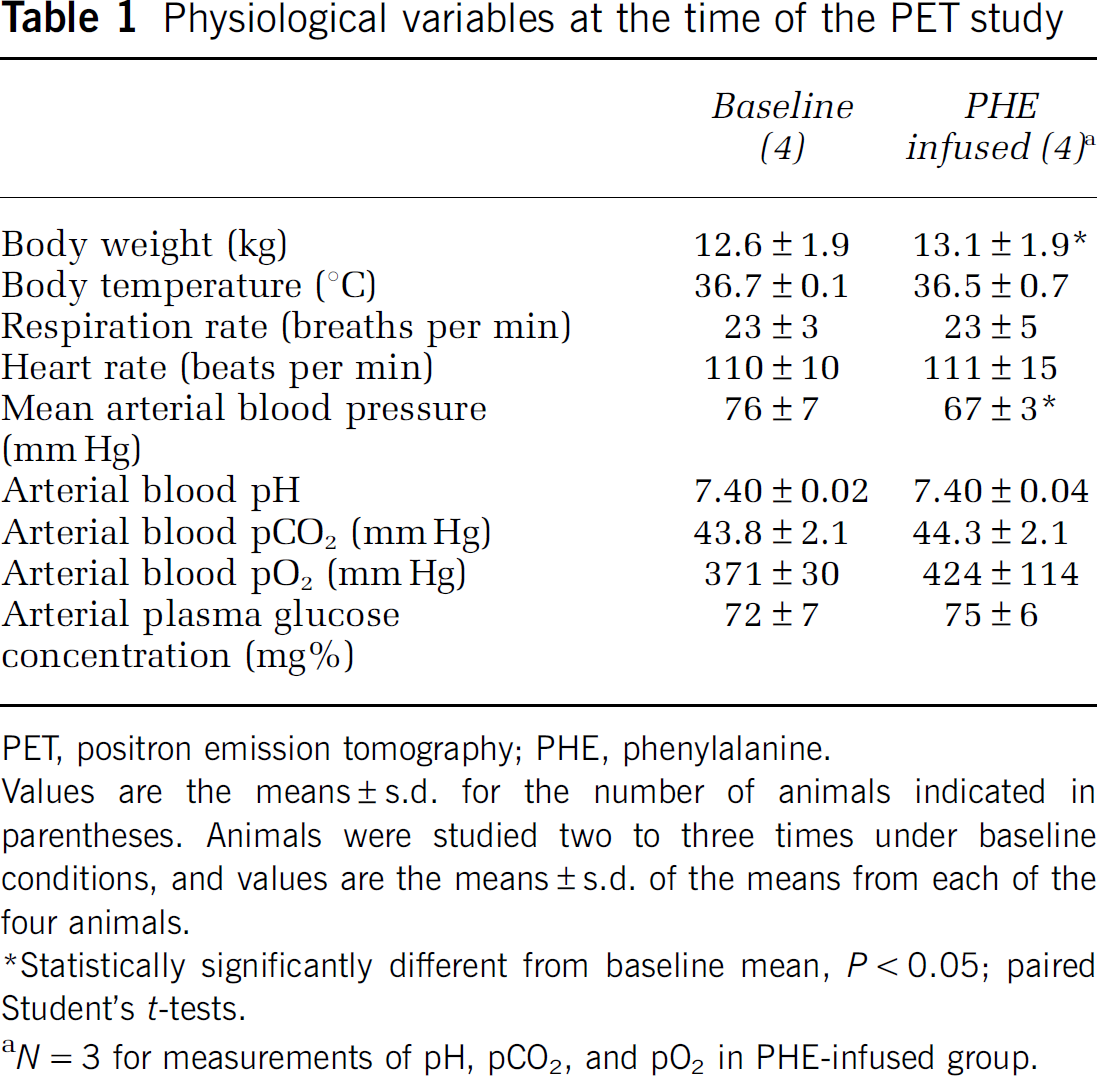
PET, positron emission tomography; PHE, phenylalanine.
Values are the means ± s.d. for the number of animals indicated in parentheses. Animals were studied two to three times under baseline conditions, and values are the means ± s.d. of the means from each of the four animals.
Statistically significantly different from baseline mean, P < 0.05; paired Student's t-tests.
N = 3 for measurements of pH, pCO2, and pO2 in PHE-infused group.
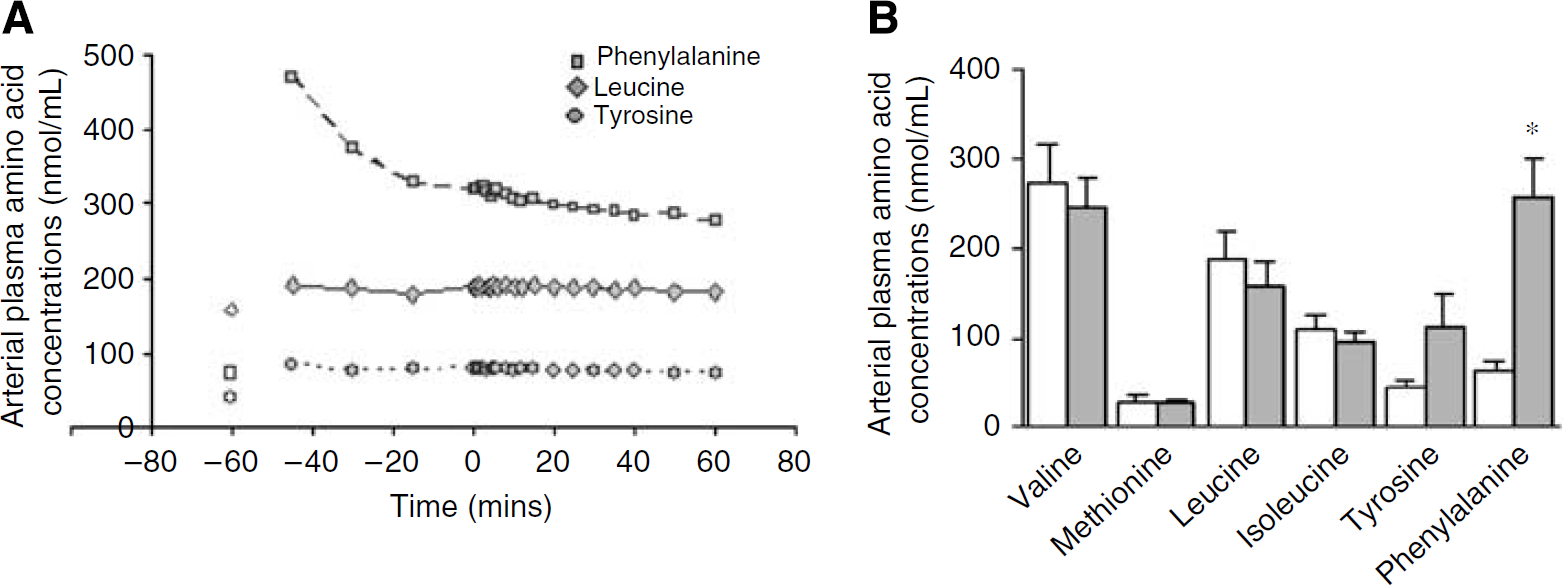
Arterial plasma concentrations of large neutral amino acids. (
Typical clearance curves for total 11C activity in whole blood, 11CO2 in whole blood, and free [11C]leucine in arterial plasma in a baseline and phenylalanine infusion study are shown in Figures 3A and 3B, respectively. Except for the first few minutes, curves were similar under both conditions. In this particular pair of studies, activity in the blood increased earlier in the phenylalanine-infused animal compared with the baseline study (Figure 3C). Across all studies, we found that the lag between the start of the [11C]leucine infusion and the appearance of activity in the arterial blood varied between 14 and 29 secs. This variability is probably due to slight differences in the mechanics of injection among the studies. In these two studies, differences in the blood activity during the first 2 mins are reflected in the very early parts of the measured time courses of total activity in visual cortex (Figure 3F). Full measured time courses of total activity for primary visual cortex in the same studies are shown in Figures 3D and 3E, respectively. Also shown in Figures 3D and 3E are the model-predicted time courses of 11C activity in the tissue distributed among the blood, free leucine, CO2, and protein pools. Despite the higher activity in blood in the hyperphenylalaninemic animal (Figure 3B compared with 3A), the total activity in visual cortex is lower (Figure 3E) compared with the baseline study (Figure 3D). The model-predicted activity in the free leucine pool increases steadily and at a similar rate in the first 5 mins under both conditions, but in the hyperphenylalaninemic animal, it peaks at a lower level and as it clears remains below the level in the baseline study. Under both baseline and hyperphenylalaninemic conditions, predicted activity in the protein compartment increases progressively so that by 60 mins it comprises 83% and 84% of the activity, respectively. In whole brain, predicted activity in the free leucine compartment in control and hyperphenylalaninemic animals increases for the first 5 mins to an average of 73% and 71% of the total activity, respectively, and progressively decreases thereafter to 12% and 9% of the total at 60 mins, respectively; predicted activity in the protein compartment is an average of 79% and 84%, respectively, at 60 mins. Under both conditions, most (50% to 90%) of the predicted activity is in blood during the first 1.5 mins, but by 10 mins blood accounts for about 7% of the total and by 60 mins 3%. Predicted activity in CO2 increases to 4% of the total by 5 mins and remains fairly constant thereafter in both control and phenylalanine-infused animals.
The estimated rate constants and blood volumes in whole brain and five ROIs are shown in Table 2. The half-life of leucine in the tissues (ln (2)/[k2 + k3 + k4]) was between 4 and 6 mins under both conditions. Consistent with a partial saturation of the transporter by the elevated plasma phenylalanine concentration, estimates of K1, the influx rate constant from plasma to brain, were lower in the hyperphenylalaninemic animals, ranging from 18% lower in primary visual cortex to 27% lower in putamen. Effects were statistically significant in whole brain and in four of the five regions examined. We found a linear relationship between estimates of K1 and 1/S (Figure 4) in whole brain and in all regions examined. Slopes were positive and statistically significantly different from zero (P < 0.05) in all regions and whole brain.
Regional estimates of parameters of the leucine model
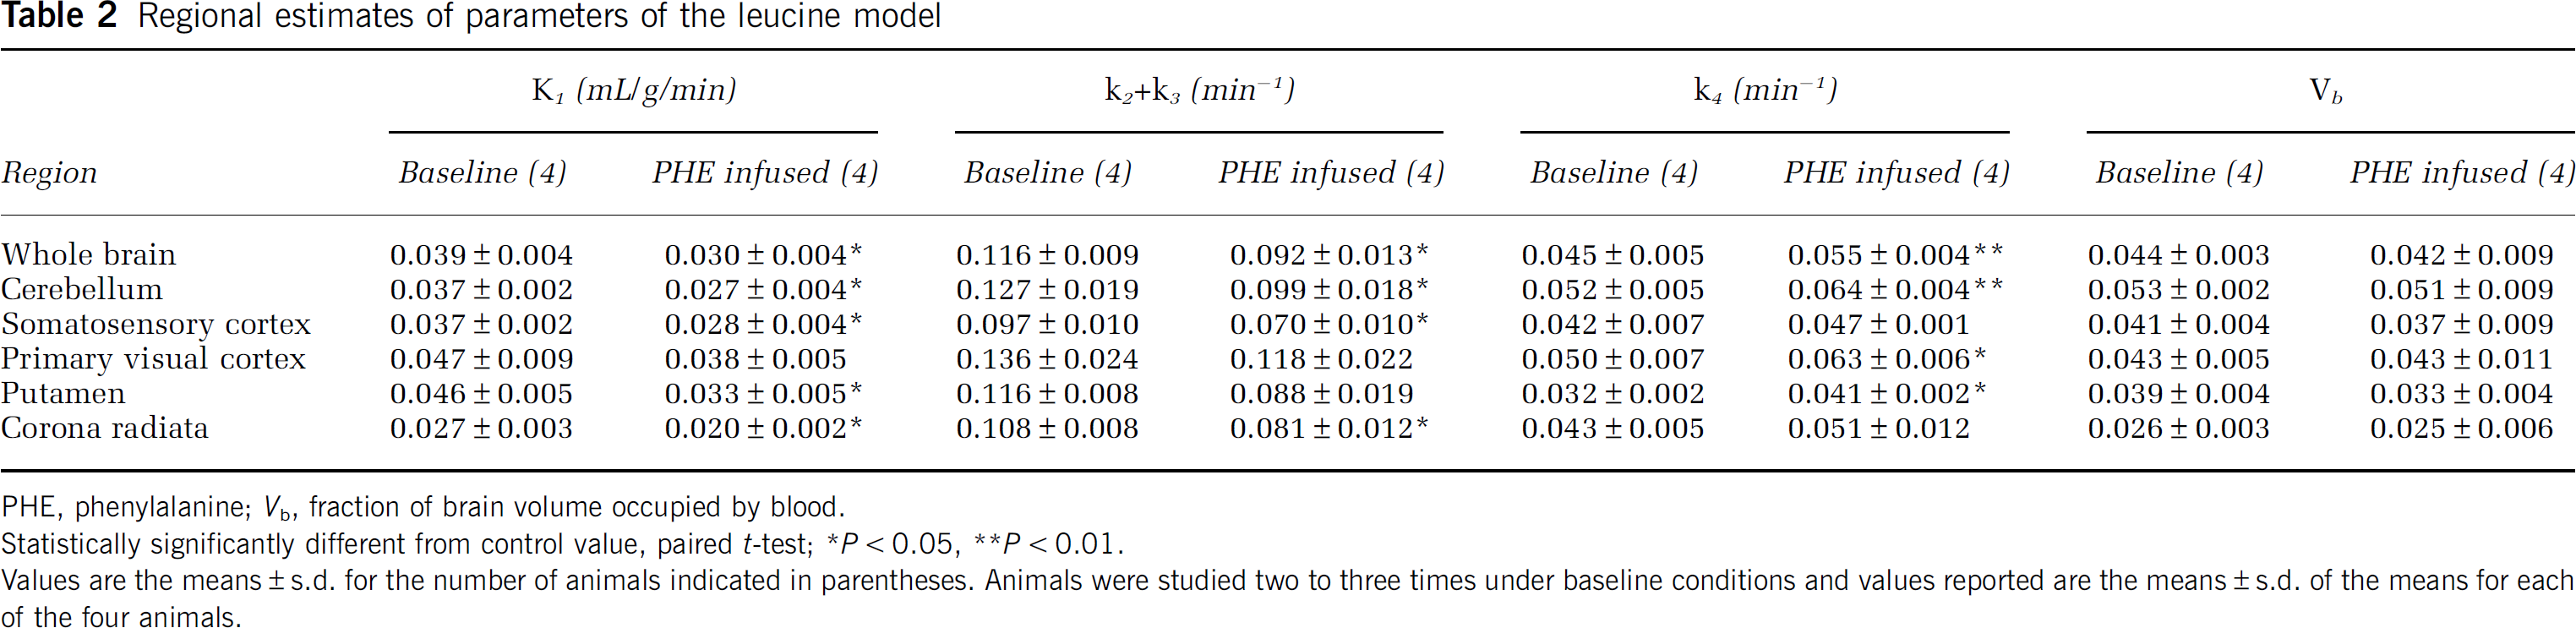
PHE, phenylalanine; Vb, fraction of brain volume occupied by blood.
Statistically significantly different from control value, paired t-test
P < 0.05
P < 0.01.
Values are tde means ± s.d. for the number of animals indicated in parentheses. Animals were studied two to three times under baseline conditions and values reported are the means ± s.d. of the means for each of the four animals.
Estimates for the sum (k2 + k3) of the rate constants for efflux from the brain to plasma and for metabolism of leucine in the brain had a tendency to be lower in the phenylalanine-infused animals, whereas estimates for the rate constant for leucine incorporation into protein, k4, tended to be higher in hyperphenylalaninemic animals (Table 2). We found statistically significant linear relationships between estimates of k2 + k3 and 1/S in whole brain and in somatosensory cortex and putamen; the r2 for the linear relationship between k2 + k3 and 1/S was 0.3257 (P = 0.03), 0.3552 (P = 0.02), and 0.3093 (P = 0.04) in whole brain, somatosensory cortex, and putamen, respectively. There were no statistically significant linear relationships between estimates of k4 and 1/S in whole brain or any of the regions. Estimates of Vb tended to be slightly lower in the phenylalanine-infused animals, but these differences were not statistically significant (Table 2). In controls, mean estimates of Λ ranged from 0.70 to 0.78 in whole brain and regions, whereas in hyperphenylalaninemic animals, estimates of Λ were 11% to 15% lower, ranging from 0.60 to 0.68 (Figure 5A).
Computed rCPS were similar in both groups of animals (Figure 5B). Average rates (± s.d.) for baseline studies ranged from 2.01 ± 0.58 in corona radiata to 3.18 ± 0.14 nmol/g/min in primary visual cortex. Regional rate of cerebral protein synthesis in white matter was about 40% of the rate in cortical grey matter. Coefficients of variation for the four animals were 2% to 11% in grey matter regions and 29% in corona radiata.
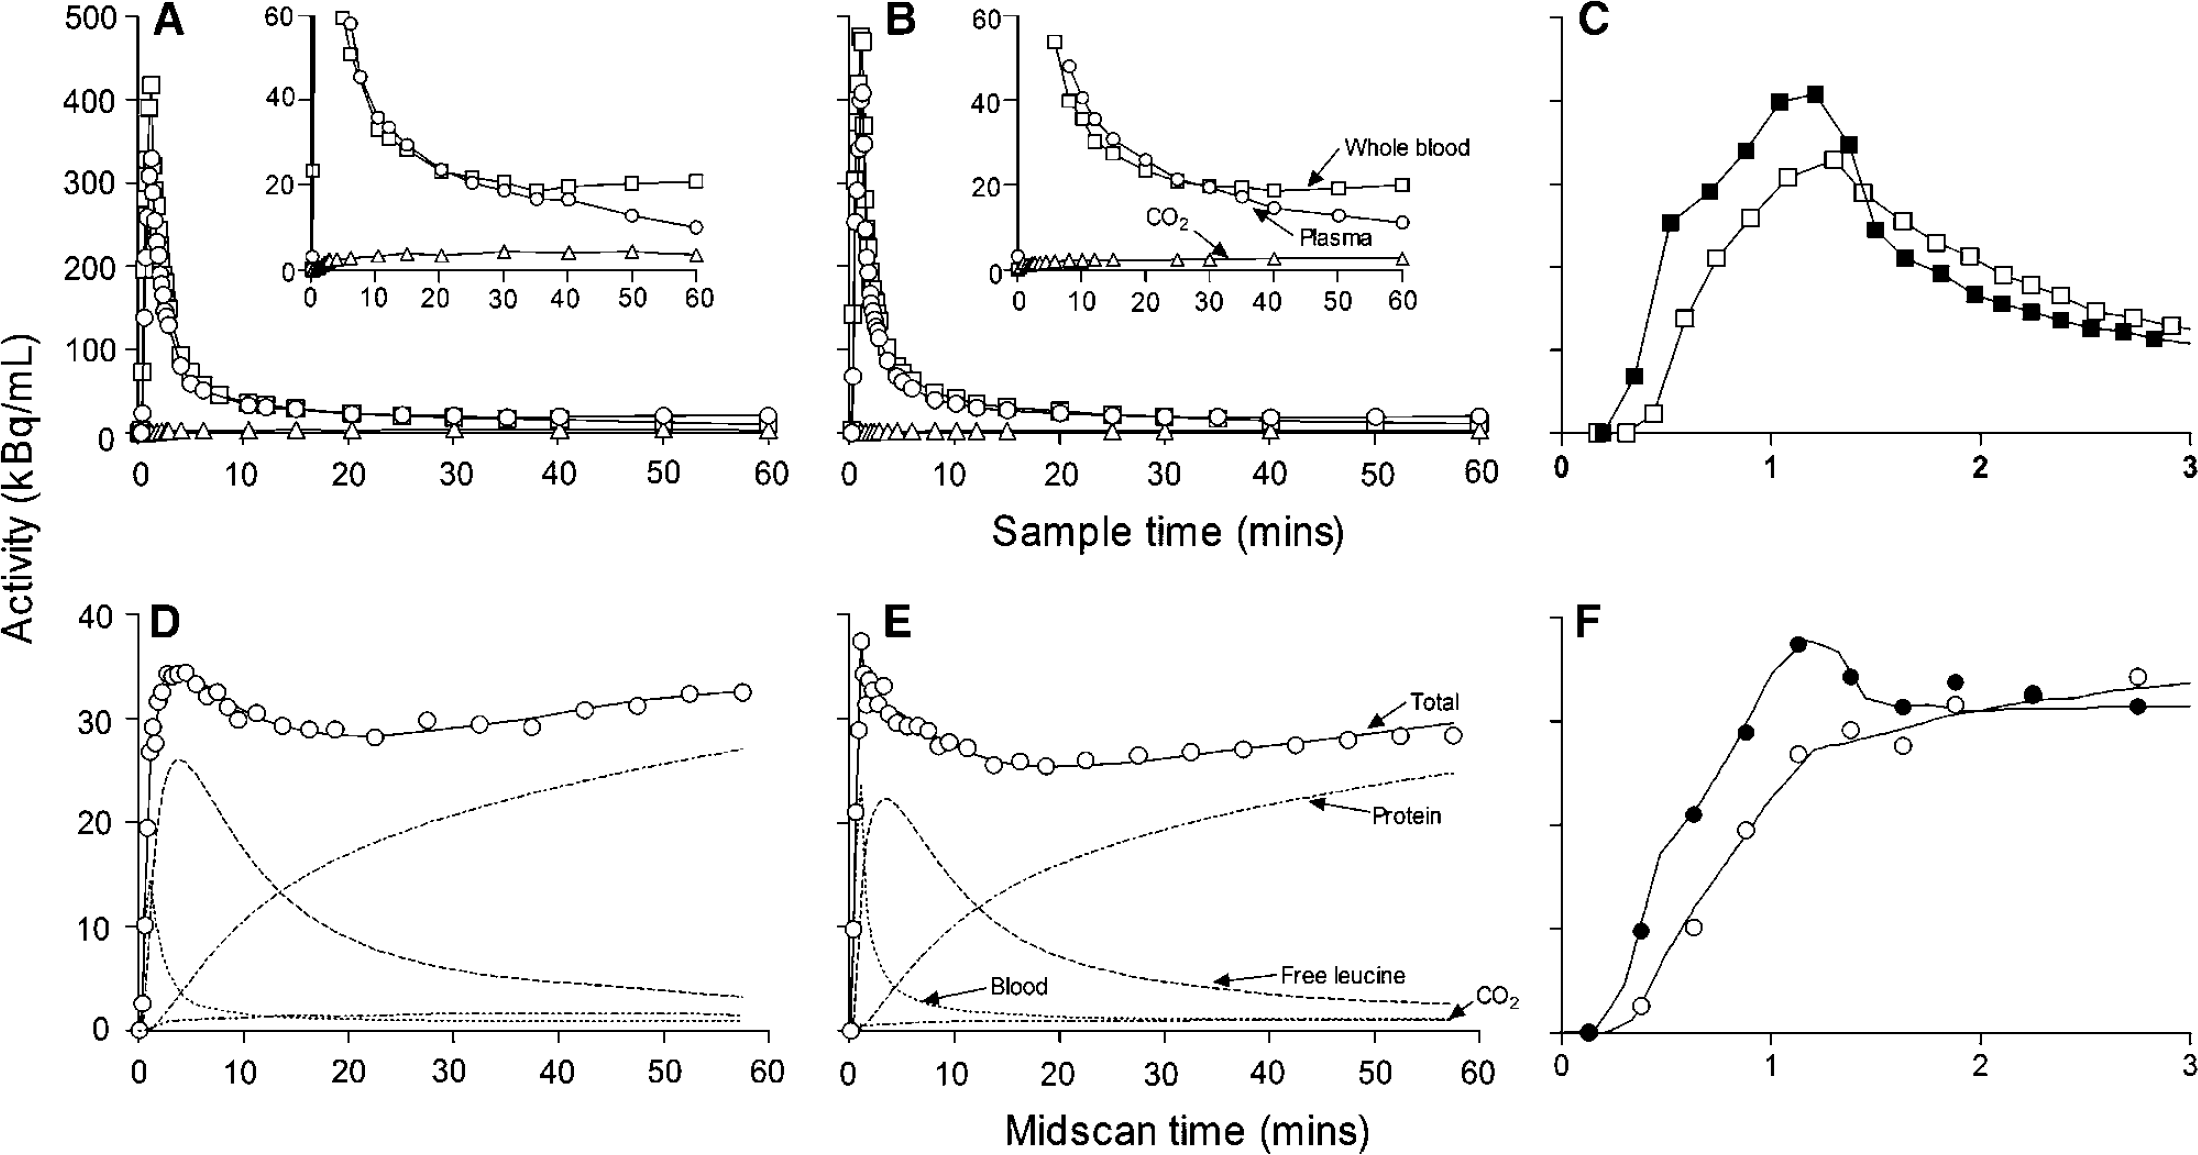
Arterial clearance curves from a typical baseline (
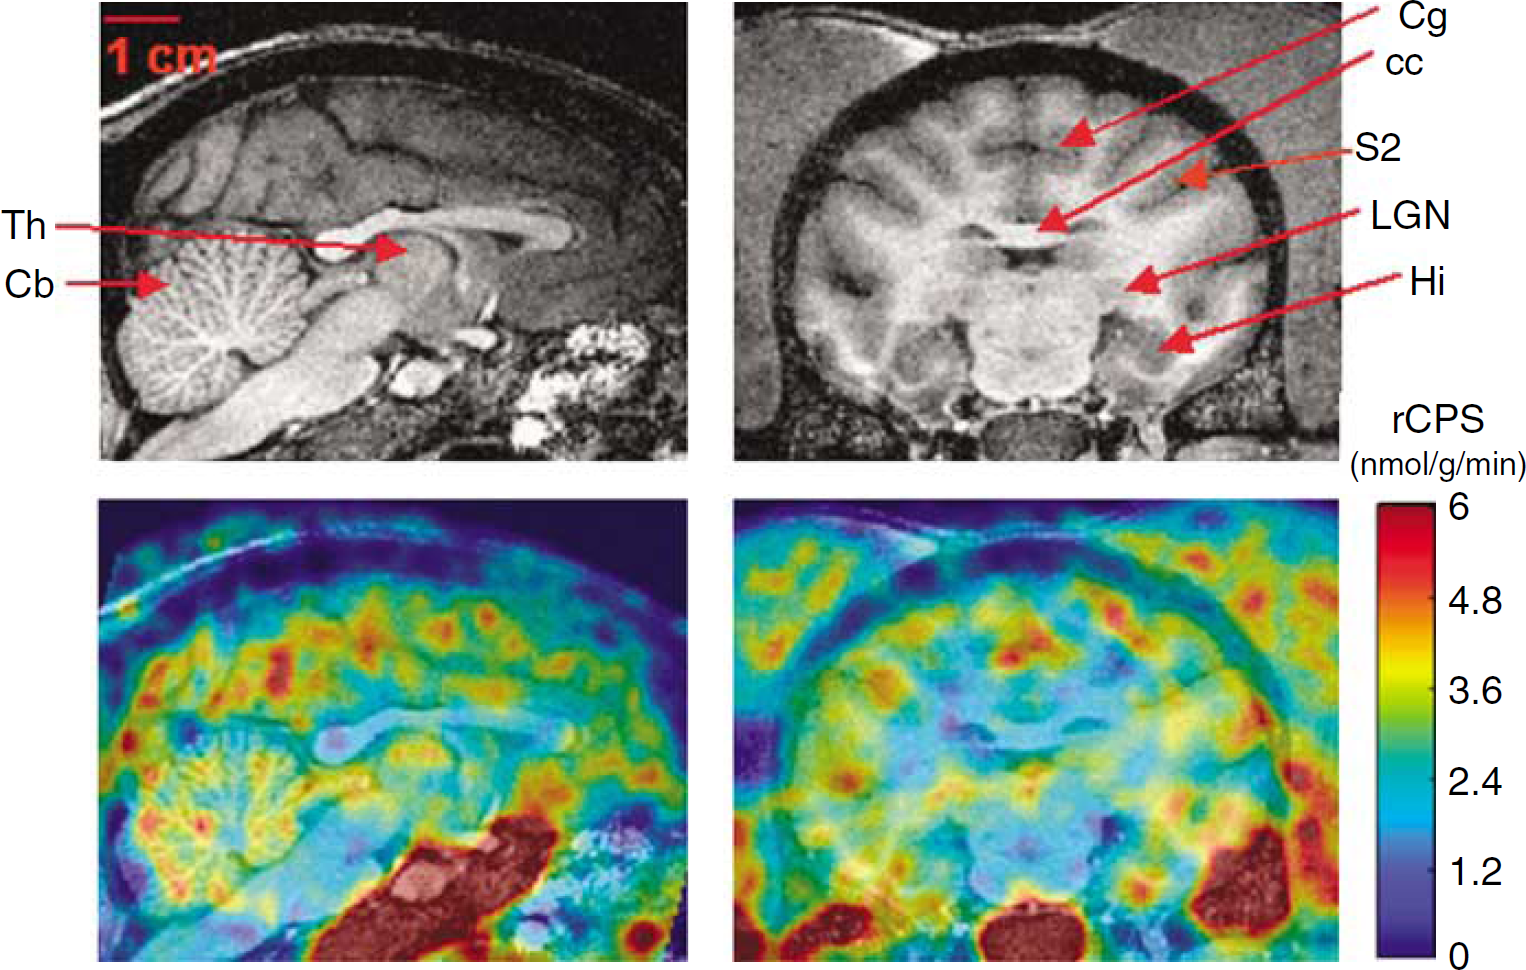
Parameteric images of rCPS from one of the studies are shown in Figure 6. Differences in rCPS between grey and white matter areas are clear, and the heterogeneity of rCPS within cortex and in subcortical grey matter is apparent. In extracerebral structures, there is a clear incorporation of leucine into protein in scalp muscle and salivary glands.
Discussion
Our results show both the sensitivity and robustness of the
The
Estimates of K1 and Λ and measurements of rCPS in this series of animals studied under baseline conditions agree well with results reported previously in a different series of monkeys (Smith et al, 2005). In whole brain, estimates of Λ and rCPS were within 0.1% and 5% of previously reported values, respectively. In all five regions examined, values of Λ were almost identical and measured rCPS were within 8% of previously reported values. The agreement between the results of this study and our previous study in a different series of animals studied with a lower resolution camera attest to the reproducibility and stability of the measurements.
In this study, we have examined the sensitivity of the PET method to detect changes in the value of Λ. The PET method requires dynamic scanning for 60 mins to estimate the parameters. In these initial studies, we have been careful to measure (rather than fit or estimate from population averages) any variable that can be directly measured. For example, in each study, we have measured the time courses in arterial blood of total 11C, 11CO2, and [11C]leucine and unlabeled leucine in plasma over the entire course of the study. We used a 60-min scanning interval having determined previously that rCPS values measured at 60 mins were in very good agreement with rates determined with the autoradiographic
We are encouraged by the low variability of our estimates of Λ and the relatively low variability of our determinations of rCPS. In whole brain and the five regions examined, COVs of Λ estimates ranged from 3% to 5% in the 10 control studies and from 4% to 9% in the four phenylalanine infusion studies. Coefficients of variation of rCPS measurements in all 14 studies ranged from 11% in primary visual cortex to 25% in the corona radiata. The COV for the measurement of rCPS in whole brain was 11%. Knowledge of the variance in rCPS measurements is critical for the design of future studies and the consideration of the number of subjects required to detect changes of < 20%.
The effects of hyperphenylalaninemia on estimates of K1 for an amino acid competing for the
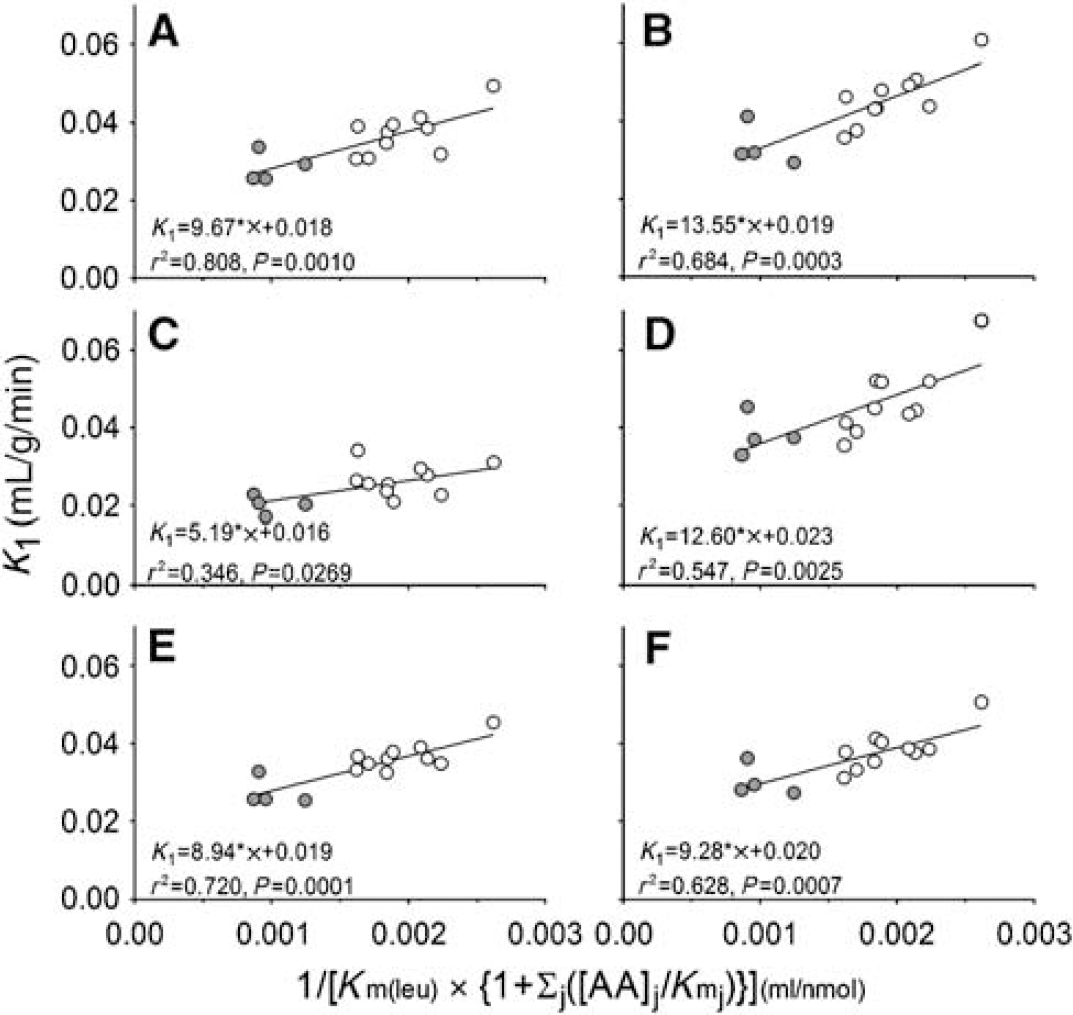
The linear relationship between estimates of K1 and
The sensitivity of the [11C]leucine method to detect these expected effects on one (K1) of the four estimated parameters was not known. The linear relationship between estimates of K1 and the reciprocal of the Michaelis—Menten expression for competitive inhibition further describes the behavior of the saturable carrier under these conditions. From the slopes of the lines, we can estimate Vmax for transport of leucine into the brain in monkey under these experimental conditions. In primary visual cortex, Vmax is estimated to be 13 nmol/g/min and the intercept, kD, 0.02 mL/g/min. These estimates are within the range of values for Vmax and kD reported for the adult rat (Smith et al, 1987).
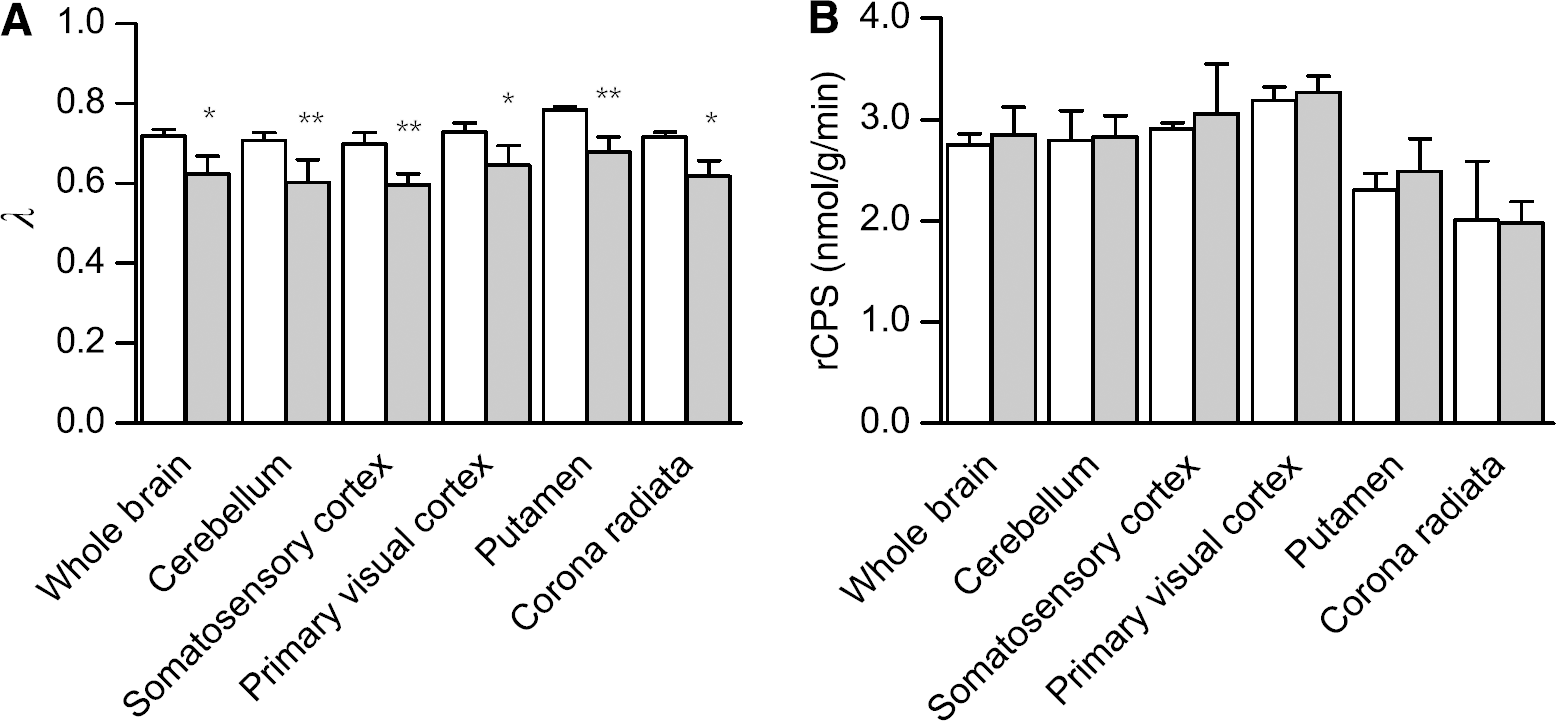
Effects of phenylalanine infusion on values of (
We had also predicted that under hyperphenylalaninemic conditions, the value of Λ would be decreased. This prediction was based on the partial saturation of the transporter by elevated plasma phenylalanine concentrations coupled with normal leucine concentrations. Phenylalanine has the highest affinity for the transporter with a km of 0.011 μmol/mL; the km for leucine is 0.029 μmol/mL (Smith et al, 1987). Normally, the transporter is saturated about equally with phenylalanine (37%) and leucine (36%). With a three- to five-fold elevation in plasma phenylalanine concentration, the transporter is 70% saturated with phenylalanine and 15% saturated with leucine. With this limitation in transport of leucine, we predicted a decrease in the ratio in equation (3). Our data show that the
In spite of the effect of hyperphenylalaninemia on Λ, rCPS remained unchanged in our monkeys. This result agrees with the results in adult rats in which plasma phenylalanine concentrations were acutely elevated about 10-fold with no effects on rCPS (Dunlop et al, 1994). It is in neonatal animals that hyperphenylalaninemia appears to affect brain protein synthesis. Hyperphenylalaninemia resulted in a disaggregation of brain polyribosomes (Aoki and Siegel, 1970), an increase in 80S monoribosomes (Taub and Johnson, 1975), and a decrease in Met-tRNA i met (Hughes and Johnson, 1977) in neonatal mice. The decreased concentration of Met-tRNA i met suggested a decreased rate of initiation of brain protein synthesis possibly through a decrease in the initiation complex (Taub and Johnson, 1975). In accord with the results in neonatal mice and in contrast with the findings of this study, our studies of a genetic mouse model of PKU showed 20% decreases in rCPS throughout the brain in untreated adult mice (Smith and Kang, 2000). There are two important differences between our previous study on the adult mouse PKU model and this study. First, in this study, phenylalanine concentrations were increased three- to five-fold, whereas in our study of the PKU mouse model, plasma phenylalanine concentrations were about 21 times normal. There may be a critical concentration of plasma phenylalanine where brain protein synthesis is affected in the adult. Second, there may be a difference between the effects of acute and chronic hyperphenylalaninemia. In the mouse study, animals were hyperphenylalaninemic for their entire lives even during brain development. In this study, hyperphenylalaninemia was induced 1 h before the initiation of the PET measurement of rCPS. Further, the brains of adult mice with genetic PKU were smaller than controls (Smith and Kang, 2000), suggesting that the period of hyperphenylalaninemia during brain development may have caused deficiencies in brain structure. Decreased rCPS in adult mice with genetic PKU may reflect developmental structural abnormalities.
Our data not only show the sensitivity of the
Footnotes
Acknowledgements
We thank the following members of the PET department: G Jacobs, S Sestrich, W Kong, M Der, RPh; J Divel, RPh; C Barker, PhD, S Conant, and S Thada. We thank the Neurophysiology Imaging Facility, NIMH for MR imaging of monkeys and N Phipps for monitoring animals during the procedure. We thank J Bacher, DVM, for surgical implantation of the arterial ports and the staff of the Division of Veterinary Resources, NIH, for care of the animals.
The authors state no duality of interest.