
Abstract
The confounding effect of recycling of amino acids derived from tissue protein breakdown into the precursor pool for protein synthesis has been an obstacle to adapting in vivo methods for determination of regional rates of cerebral protein synthesis (rCPS) to positron emission tomography (PET). We used a kinetic modeling approach to estimate λ, the fraction of the precursor pool for protein synthesis derived from arterial plasma, and to measure rCPS in three anesthetized adult monkeys dynamically scanned after a bolus injection of L-[1-11C]leucine. In the same animals, λ was directly measured in a steady-state terminal experiment, and values showed excellent agreement with those estimated in the PET studies. In three additional monkeys rCPS was determined with the quantitative autoradiographic L-[1-14C]leucine method. In whole brain and cerebellum, rates of protein synthesis determined with the autoradiographic method were in excellent agreement with those determined with PET, and regional values were in good agreement when differences in spatial resolution of the two methods were taken into account. Low intrasubject variability was found on repeated PET studies. Our results in anesthetized monkey indicate that, by using a kinetic modeling approach to correct for recycling of tissue amino acids, quantitatively accurate and reproducible measurement of rCPS is possible with L-[1-11C]leucine and PET.
Introduction
The adaptation of in vivo autoradiographic methods for the measurement of regional rates of cerebral protein synthesis (rCPS) for use with positron emission tomography (PET) has been stymied by the problem of dilution of the specific activity of the tissue precursor amino acid pool for protein synthesis with amino acids, largely unlabeled, that come from the steady-state breakdown of protein in the tissue. We have shown in experimental animals (Smith et al, 1988; Smith and Kang, 2000) that degradation of protein is a significant source of leucine in brain and that it is essential to correct for its contribution to calculate a true tissue precursor amino acid pool integrated specific activity. We have proposed a kinetic modeling approach to this correction (Schmidt et al, 2005), which should allow for the first time quantitative measurement of rCPS with L-[1-11C]leucine and PET. The correction is encompassed in a factor λ defined as the fraction of the precursor pool for protein synthesis derived from arterial plasma; the fraction that comes from recycling is 1-λ (Smith et al, 1988). Our feasibility study suggests that low-bias estimates of λ can be achieved with PET data (Schmidt et al, 2005).
In the present study, we have applied the kinetic modeling approach in three adult monkeys dynamically scanned with PET after a bolus injection of L-[1-11C]leucine. Model-based estimations of λ were validated by direct biochemical measurements of λ in terminal experiments in the same animals. Positron emission tomography measurements of rCPS were validated by comparison with autoradiographic determinations of rCPS with L-[1-14C]leucine in a separate group of monkeys. In whole brain and cerebellum, rates of protein synthesis determined with the autoradiographic method were in excellent agreement with those determined with PET, and regional values were in good agreement when differences in spatial resolution of the two methods were taken into account.
Materials and methods
Kinetic Modeling Approach
The kinetic modeling approach for determination of λ and rCPS with L-[1-11C]leucine (Schmidt et al, 2005) is based on the kinetic model shown in Figure 1. Briefly, the total concentration of 11C in the field of view of the PET camera (CT*) at time T is comprised of free [11C]leucine and [11C]protein in the tissue (CE* and P*, respectively), diffusible 11CO2 in the tissue (CD*), products of 11CO2 fixation (CF*), and activity in the blood in the brain (VbCb*, where Vb is the fraction of the volume occupied by blood and Cb* is the total activity in whole blood). It is assumed that 11CO2 in brain is rapidly equilibrated with the arterial blood (Buxton et al, 1987), so that CD*≈VDCa* (where Ca* is the 11CO2 activity in whole blood and VD is the brain:blood equilibrium distribution volume of 11CO2), and there is negligible fixation of 11CO2 during the experimental period (Buxton et al, 1987; Siesjö and Thompson, 1965), that is, CF*≈0. Therefore
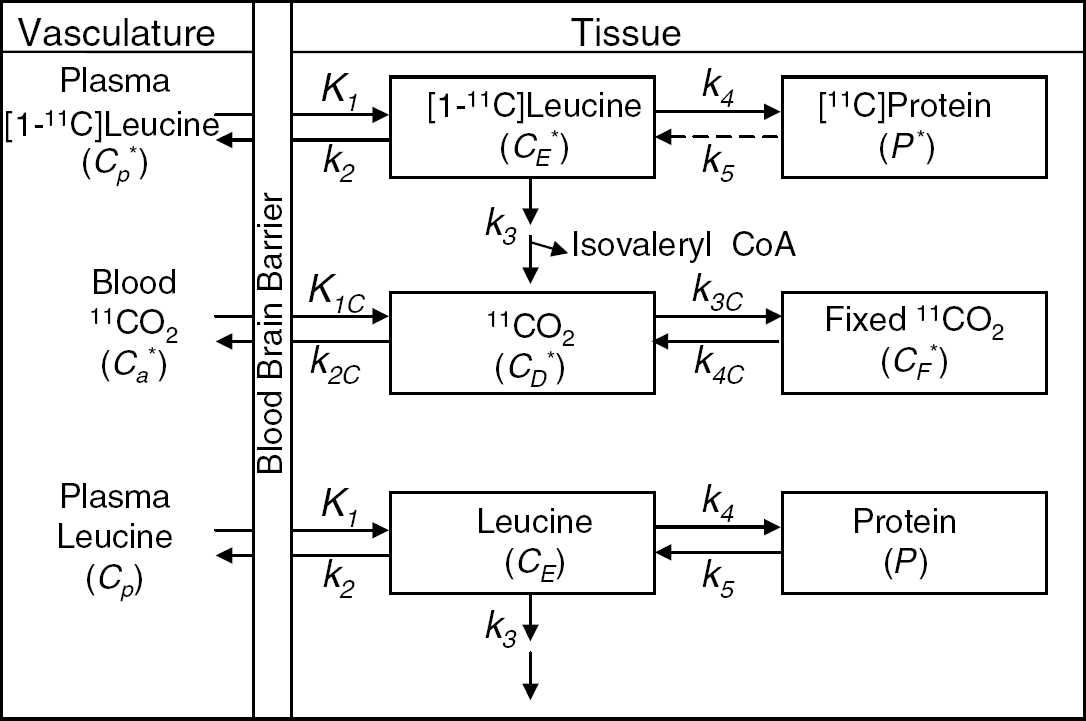
Compartmental model of leucine in brain. CE* represents the labeled exchangeable pool in brain, which includes intracellular, extracellular, and tRNA-bound leucine. The unlabeled exchangeable pool is represented by CE. Cp* and Cp represent the arterial plasma concentrations of labeled and unlabeled leucine, respectively. K1 and k2 are the rate constants for carrier-mediated transport of leucine from plasma to tissue and from tissue to plasma, respectively. k3 is the rate constant for the first two steps in the catabolism of leucine which includes a transamination reaction followed by a rapid decarboxylation. The rate constant for leucine incorporation into protein is represented by k4, and that for release of free leucine by protein degradation is k5. P* and P represent tissue concentrations of labeled and unlabeled proteins, respectively. Unlabeled leucine is assumed to be in a steady state. Due to the long half-life of proteins in brain, it is assumed there is no significant loss of label from the radioactive protein within the experimental period, that is, k5 P*=0. After an injection of leucine labeled on the carboxyl carbon, the only possible labeled metabolites in brain are α-ketoisocaproic acid (α-KIC), CO2, and products of CO2 fixation. Since there is very little labeled α-KIC in brain (Keen et al, 1989), this pool is not explicitly represented in the model and k3 combines the transamination and decarboxylation reactions, as noted above. Labeled CO2 can arise either through catabolism of labeled leucine in brain or through influx from the blood after the breakdown of labeled leucine in other tissues; once in the brain, it may be either transported from brain to blood or fixed in brain. In the model, Ca* and CD* represent the pools of labeled CO2 in the arterial blood and brain, respectively, and CF* represents the concentration of the labeled products of CO2 fixation in the tissue. K1C and k2C are the rate constants for influx and efflux of labeled CO2 between brain and blood, respectively, and k3C and k4C represent the rate constants for fixation and loss of fixed CO2, respectively.

when diffusible 11CO2 in the tissue is a negligible fraction of CT*, the term VDCa* can be omitted from equation (1).
The model for labeled leucine includes four rate constants: K1 and k2 for carrier mediated transport from plasma to brain and back from brain to plasma, respectively; k3 for metabolism of leucine to yield CO2; and k4 for incorporation of leucine into protein. The rate constants are identical for the labeled and unlabeled species, except that in the model for unlabeled leucine (Figure 1) we have included a rate constant for breakdown of tissue protein, k5; we assume that there is no significant breakdown of the labeled leucine in the experimental period. Unlabeled leucine is assumed to be in a steady state. The model equations that describe the concentrations in all pools, both labeled and unlabeled, are provided in the accompanying paper (Schmidt et al, 2005).
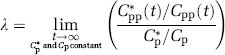
The first step in the kinetic modeling approach is to estimate model rate constants (K1, k2+k3, and k4) from the time courses of the total concentration of 11C in the field of view measured by dynamic PET scanning and the measured concentrations of [11C]leucine (Cp*) in arterial plasma, and 11CO2 (Ca*) and total activity (Cb*) in whole blood sampled from an arterial catheter. The fraction of the precursor pool for protein synthesis derived from arterial plasma, λ, is then calculated from the ratio of rate constants
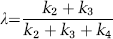
(Schmidt et al, 2005). Once regional values for the rate constants and λ have been estimated in each animal, the rate of incorporation of leucine into protein in the tissue (rCPS) can be determined by either of two computation methods: method ‘A’, which is similar to that of the autoradiographic [14C]leucine equation, and method ‘B’, which is mathematically equivalent to that of ‘A’ but might have different sensitivities to errors in the estimated rate constants and λ. The operational equation for method ‘A’ is
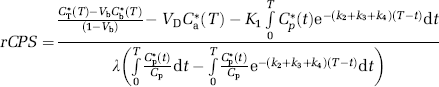
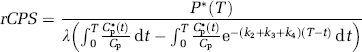
where Cp is the arterial plasma concentration of leucine and all other terms are as defined above. In the operational equation, the numerator represents the total amount of labeled product (in this case labeled protein) formed in the tissue over the experimental interval, and the denominator represents the specific activity of the precursor pool integrated over the same interval. When diffusible 11CO2 in the tissue is negligible compared with CT*, the term VDCa* can also be omitted from equation (3). The operational equation for method ‘B’ is
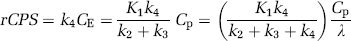
in which rCPS is determined directly from the estimated rate constants and λ and measured arterial plasma leucine concentration.
Animals
All procedures were performed in accordance with the National Institutes of Health Guidelines on the Care and Use of Animals and an animal study protocol approved by the National Institute of Mental Health Animal Care and Use Committee. We studied six adult rhesus monkeys, five male and one female. Surgical preparation of the animals under isoflurane anesthesia took place at least 4 weeks before the study by inserting a polyurethane catheter attached to a Port-A-Cath vascular port (Sims Deltec, Inc., St. Paul, MN, USA) into a femoral artery and securing the port under the skin of the ipsilateral thigh. Catheters were flushed weekly with heparinized saline to maintain patency.
Magnetic Resonance Imaging
Magnetic resonance images (MRIs) used to identify regions of interest (ROIs) on the PET images were obtained from each of the monkeys while under ketamine anesthesia. Animals were positioned in an MRI-compatible stereotaxic head-holder and scanned with a General Electric Signa 1.5 T scanner (GE Medical Systems, Milwaukee, WI, USA) with a 5-in GP surface coil. A T1-weighted 3-D gradient echo sequence with RF spoiling (TR/TE/flip angle, 25 msec/6 msec/30°) was used with a field of view of 10 cm and slice thickness of 1 mm.
Preparation of L-[1-11C]leucine
D,L-[1-11C]Leucine was prepared from H11CN with a modified Strecker-Bucherer reaction sequence (Iwata et al, 1987). The isolation of the pure L-amino-acid isomer from the racemic mixture was achieved by chiral HPLC with a Chirobiotic T column (10 × 250 mm) (Advanced Separation Technologies Inc., Whippany, NJ, USA), mobile phase of ethanol/20 mmol/L ammonium acetate buffer, pH 6 (20/80, v/v), and a flow rate of 2 mL/min. Retention times of the L- and D-isomers were approximately 8 and 10 mins as determined by the corresponding standards. L-[1-11C]leucine was obtained with a radiochemical purity of >99% and an estimated specific activity of 11 GBq/μmol.
Positron Emission Tomography Studies
Before each PET study, the animal was sedated with medetomidine and torbutrol, intubated, and intravenous lines were inserted into both legs. The head was immobilized in a stereotaxic head-holder and the animal was positioned in the PET scanner face forward so that scanning was in a coronal plane. The sedated animal was then anesthetized with isoflurane and treated with atipamezole to reverse the effects of medetomidine. All animals were maintained on isoflurane anesthesia (mean alveolar concentration generally 1.3% to 1.6%) for the duration of the PET study. Studies were performed with a GE Advance PET Scanner. Each leucine study was preceded by a 15-min transmission scan to correct for attenuation and three 60-sec [15O]water (0.74 GBq/scan) scans 15 mins apart to aid in registering PET images and MRIs. Leucine studies were initiated by the intravenous infusion of L-[1-11C]leucine (0.11 to 0.33 GBq in 10 mL of normal saline) over 1 min. Dynamic PET acquisition in both 2-D and 3-D mode began at the time of injection (scanning schedule: 6 × 30, 3 × 60, 2 × 120, 3 × 200, 1 × 100 (3-D mode), 2 × 200, 1 × 100 (3-D mode), 2 × 200, 1 × 100 (3-D mode), 2 × 200, 1 × 100 (3-D mode), 2 × 200 sec). Due to ∼45 second delay times for retraction/extension of septa when switching acquisition between 2-D and 3-D modes, scanning required a total of ∼60 mins. Except where noted above, scans were acquired in the 2-D mode and reconstructed with a filtered backprojection. All data used for analyses presented here were acquired in the 2-D mode. Spatial resolution was 6 to 7 and 4 to 5 mm (full-width at half-maximum) in the transverse and axial planes, respectively. In all, 35 slices of the head, 4.25 mm in thickness, were acquired. The field of view was 55 cm (transverse plane) by 15.3 cm (axial plane). To assess reproducibility, two animals underwent four PET studies each on separate days.
Analysis of [11C]Leucine Blood Samples
Arterial blood samples were collected every 4 to 10 sec for the first 1.5 mins and at increasing intervals thereafter to measure the time courses of total 11C activity in arterial blood and the concentrations of leucine and [11C]leucine in plasma over the 60-min scan duration. To measure total activity in whole blood, all of the labeled products including volatile CO2 were trapped at the time of collection. This was accomplished by collecting samples of whole blood in 1 N NaOH, which captured the CO2 as bicarbonate along with the other labeled products. To measure the input function, that is, the time course of [11C]leucine in arterial plasma, red cells were separated from plasma by an initial centrifugation, and the plasma [11C]leucine separated from other labeled products by acidification with sulfosalicylic acid, which released [11C]bicarbonate as 11CO2 and precipitated labeled protein. The procedure used was to apportion blood samples as follows: (1) Approximately 0.2 to 0.3 mL of blood was transferred to a preweighed tube containing 1 N NaOH; the tube was reweighed and immediately counted in a gamma counter (Cobra II Auto Gamma, Packard Instrument Co., Inc., Downers Grove, IL, USA) to obtain total activity in whole blood. (2) Approximately 0.5 mL was centrifuged to remove red cells and 0.2 mL of plasma from each sample was diluted in distilled water and deproteinized at 4°C for 30 mins by the addition of a solution of 16% (W/V) sulfosalicylic acid containing L-norleucine (0.04 mmol/L) as an internal standard for amino acid analysis. Labeled and unlabeled leucine concentrations in the acid-soluble fraction were assayed by gamma counting (Cobra II, Packard Instrument Co., Downers Grove, IL, USA) and by amino acid analysis (Beckman Model 7300 Amino Acid Analyzer, Beckman Instrument Co, Inc., Fullerton, CA, USA), respectively. 11C activities in all samples were corrected for decay to the time of injection.
Positron Emission Tomography Data Analysis
Three-dimensional volumes were constructed for the average of the three [15O]water scans and for each frame of the [11C]leucine scan. The reconstructed [15O]water volume was aligned to the MRI volume by use of the Automated Image Registration program with a 3D rigid body transformation (Woods et al, 1993); the transformation parameters from the [15O]water–MRI alignment were subsequently applied to each frame of the [11C]leucine volume to effect its alignment to the MRI volume. Regions of interest (whole brain, cerebellum, primary visual cortex, secondary somatosensory cortex, putamen, corona radiata, and internal/external capsule) were drawn on the MRIs and transferred to the [11C]leucine scans to compute the time courses of total activity. For each ROI, the rate constants K1, k2+k3, and k4, and blood volume were estimated by an unweighted linear least-squares fit of the model to the measured time courses of total activity in blood, plasma [11C]leucine activity, and total activity in the ROI (Schmidt et al, 2005). Label in CO2 and CO2 fixation products in the tissue was assumed to be negligible. The value of λ was calculated (equation (2)) from the rate constants. Regional rates of cerebral protein synthesis were computed (equation (3), method ‘A’) from the 11C concentration between 45 and 60 mins and the animal's fitted values for the rate constants and λ for each ROI or (equation (4), method ‘B’) from the animal's fitted values for the rate constants and the plasma leucine concentration.
Biochemical Determination of λ
λ was evaluated in terminal steady-state experiments by measuring the steady-state ratio of leucine specific activity in the tissue tRNA-bound pool to that of the arterial plasma as described previously (Smith et al, 1988). Monkeys were prepared as described above and studied under isoflurane anesthesia. L-[3,4,5-3H(N)]Leucine (specific activity, 6.4 TBq/mmol; Perkin-Elmer Life Sciences, Boston, MA, USA) was administered over 120 mins by means of a programmed intravenous infusion designed to achieve and maintain a constant arterial plasma [3H]leucine concentration (Patlak and Pettigrew, 1976). The total infusion contained 3.7 GBq of [3H]leucine in a volume of approximately 10 mL. The specific activities of [3H]leucine in the arterial plasma and tRNA-bound pool in brain were determined as described below. Timed arterial blood samples (c. 0.2 mL) were collected at 1, 2.5, 5, 15, and every 15 mins thereafter during the infusion and centrifuged immediately to separate plasma, which was then deproteinized by addition of one-third of a volume of 16% (W/V) sulfosalicylic acid containing L-norleucine (0.04 mmol/L) as an internal standard for amino acid analyses. The deproteinized samples were stored at −70°C until assayed for leucine and [3H]leucine concentrations. At the end of the infusions the monkey was killed with saturated KCl administered intravenously. The brain was quickly removed, chilled to 0°C in ice-cold 0.25 mol/L sucrose, and samples of cerebral cortex, cerebellum, putamen, and corona radiata were dissected.
Each tissue sample was weighed and homogenized in 10 mL of 0.25 mol/L sucrose (0°C) containing 10 mmol/L vanadyl ribonucleoside complex to inhibit ribonuclease, 25 mg of uncharged tRNA as carrier, and L-norleucine (0.02 mmol/L) added as an internal standard and centrifuged at 100,000g for 1 h. The tRNA-bound amino acids were purified as described previously (Smith et al, 1988). Briefly, the cytosolic protein and RNA in the supernatant fraction were precipitated in trichloroacetic acid and the precipitates were washed repeatedly with perchloric acid. Protein was extracted with water-saturated phenol and residual phenol was removed by extraction of the aqueous phase with anhydrous diethylether. The aminoacyl-tRNA was precipitated overnight at −20°C in ethanol containing 0.12 mol/L potassium acetate, pH 5.5. The pure tRNA fraction was dissolved in 50 mmol/L sodium carbonate (pH 10) and incubated at 37°C for 90 mins to deacylate the aminoacyl-tRNA. Deacylated tRNA was precipitated overnight at −20°C in ethanol and removed by centrifugation (12,000g, 20 mins). The supernatant solution, which contained the previously tRNA-bound but now free amino acids, was dried in a stream of N2 and redissolved in 40 μL of 0.2 mol/L sodium citrate (pH 2.2). Deproteinized plasma samples and tissue deacylated aminoacyl-tRNA pools were assayed for leucine concentration by post-column derivatization with o-phthaldehyde and fluorometric assay, and column eluates were collected every 0.5 min and assayed for 3H with liquid scintillation counting (Packard 2250CA, Packard Instrument Co., Downers Grove, IL, USA). Specific activity of each sample was calculated from total 3H in all fractions in the leucine peak and the total measured leucine content in the peak. Values of λ were calculated as the ratios of the measured steady-state specific activity of leucine in the tissue tRNA-bound pool to that of the free leucine in arterial plasma.
Autoradiographic Determination of Regional Rates of Cerebral Protein Synthesis
Monkeys were prepared as described above and studied under isoflurane anesthesia. The experimental period was initiated by an intravenous infusion over 1 min of 3.7 MBq/kg of L-[1-14C]leucine (spec. act. 1.8 to 2.2 GBq/mmol; Perkin-Elmer Life Sciences, Boston, MA, USA), contained in c. 10 mL of physiological saline. Timed arterial samples were collected during the following 60 mins for determination of the time courses of plasma concentrations of leucine and [14C]leucine and 14C concentrations in whole blood and blood CO2. Blood sampling was more frequent during the period of most rapid change in the plasma concentration of [14C]leucine. Blood samples were processed in one of three ways: (1) Approximately 0.1 mL of blood was transferred to a preweighed scintillation vial containing 1 N NaOH; the vial was reweighed and counted to obtain total activity in whole blood. (2) Approximately 0.05 mL of blood was injected through the septum of a preweighed sealed vial containing a polyethylene cup with a filter paper soaked with 1 N NaOH. The vial was reweighed and after allowing 24 h for the evolution of 14CO2 the filter paper was removed and counted. (3) Blood samples were immediately centrifuged to remove the red cells, and 0.05 mL of plasma from each sample was diluted and deproteinized with sulfosalicylic acid as described above. Labeled leucine concentrations in the acid-soluble fractions were assayed by liquid scintillation counting, and total concentrations of free plasma leucine were determined by amino acid analysis as described above.
At the end of the experimental interval, monkeys were killed by an intravenous injection of saturated KCl, the cranium was opened, and small samples of cortex were rapidly removed from one hemisphere, weighed, and frozen in liquid nitrogen to determine the 14CO2 concentration in brain tissue. The other hemisphere was divided into blocks in the coronal plane and frozen on dry ice. Sections, 20-μm thick, were cut in a Leica 1850 cryostat (Leica Microsystems, Inc., Deerfield, IL, USA) at −17°C, thaw-mounted on gelatin-coated slides, and air-dried. One series of sections was exposed on BAS-SR phosphorimaging plates (FUJIFILM Medical Systems USA, Inc., Stamford, CT, USA) along with calibrated [14C]methylmethacrylate standards. After an initial exposure, tissue sections were fixed and washed in 10% formalin and re-exposed on phosphorimaging plates. Phosphorimaging plates were read on the BAS 5000 Image Analysis System (FUJIFILM Medical Systems USA, Inc., Stamford, CT, USA) with a pixel size of 25 μm. All other tissue sections were fixed and washed as described above and exposed to EMC-1 film (Kodak, Rochester, NY, USA) along with calibrated [14C]methylmethacrylate standards (Sun et al, 1995). Autoradiograms were digitized (42 μm pixel size) by means of a Multirad 850 Howtek Film Digitzer (Howtek, Hudson, NH, USA) and images were analyzed with the MCID Elite Image Analysis Software System (Imaging Research Inc., St Catharines, Ontario, Canada). The concentration of 14C in each ROI was determined from the optical density versus 14C concentration curve determined from the calibrated plastic standards, and rCPS was calculated from the pixel-weighted average local tissue 14C concentration, the time courses of plasma [14C]leucine and leucine concentrations, the values of the rate constants for whole brain estimated in the dynamic PET studies, and the biochemically determined value of λ as follows:
Equation (5) is identical to equation (3) used to calculate rCPS in the PET studies (method ‘A’) except for the numerator. The numerator of equation (3) is an expression for P*(T) calculated from the total activity in the field of view of the PET scanner at time T corrected for activity in blood, free leucine, and labeled metabolites. In the autoradiographic studies, the only activity remaining in the tissue after the fixation and washing procedure is in the protein product, P*(T).
Statistical Analyses
Values of λ determined in the same animal with the dynamic PET and direct biochemical methods were compared by means of paired Student's t-tests.
Results
Magnetic resonance image, [15O]water PET, and [11C]leucine PET coregistered slices of one of the monkey studies are shown in Figure 2. Areas of white and gray matter located on the MRI have low and high blood flow, respectively, as seen on the [15O]water image. In the [11C]leucine image, concentrations of 11C show a two- to three-fold range with corona radiata having the lowest and cortex and midbrain areas having the highest activity. Extracerebral activity lateral to the brain appears to correspond to scalp muscle.
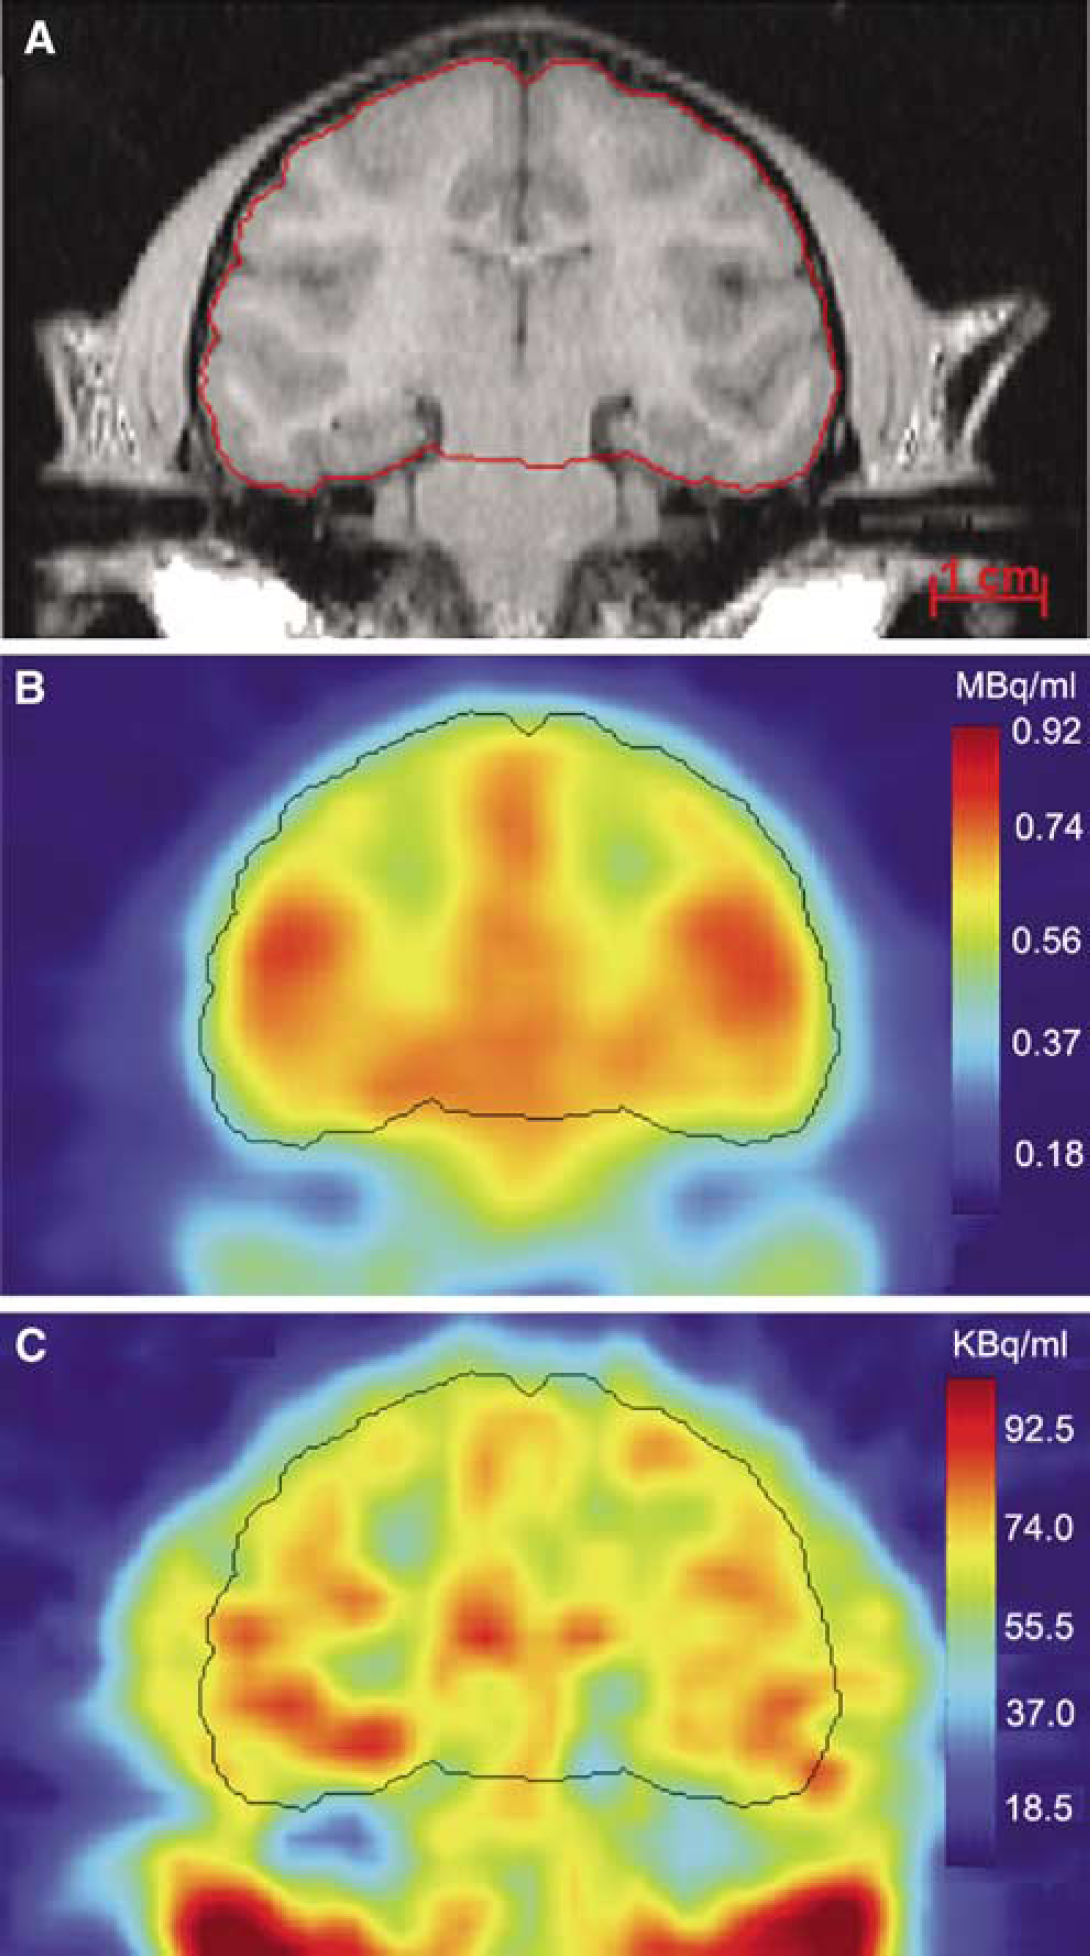
Magnetic resonance (
The estimated rate constants, λ, and blood volume in whole brain and six ROIs are shown in Table 1. Estimates of K1, the influx rate constant from plasma to brain, were higher in gray matter than in white matter. Estimates for the rate constant for leucine incorporation into protein, k4, also had a tendency to be higher in gray matter structures. Estimates of λ ranged from 0.72 to 0.77. The half-life of leucine in the tissue (ln(2)/[k2+k3+k4]) was approximately 5 to 8 mins. In Figure 3, the measured time courses of total activity for primary visual cortex and the internal/external capsule are shown. Also shown are the model-predicted time courses of 11C activity distributed among the blood, free leucine, and protein pools. In both the gray and white matter regions illustrated, predicted activity in the protein compartment increases progressively so that by 60 mins it comprises 80% and 77% of the activity, respectively. In whole brain predicted activity in the free leucine compartment increases for the first 5 mins to an average of 78% of the total activity and progressively decreases thereafter to 15% of the total at 60 mins; predicted activity in the protein compartment is an average of 84% at 60 mins.
Parameter estimates in whole brain and brain regions
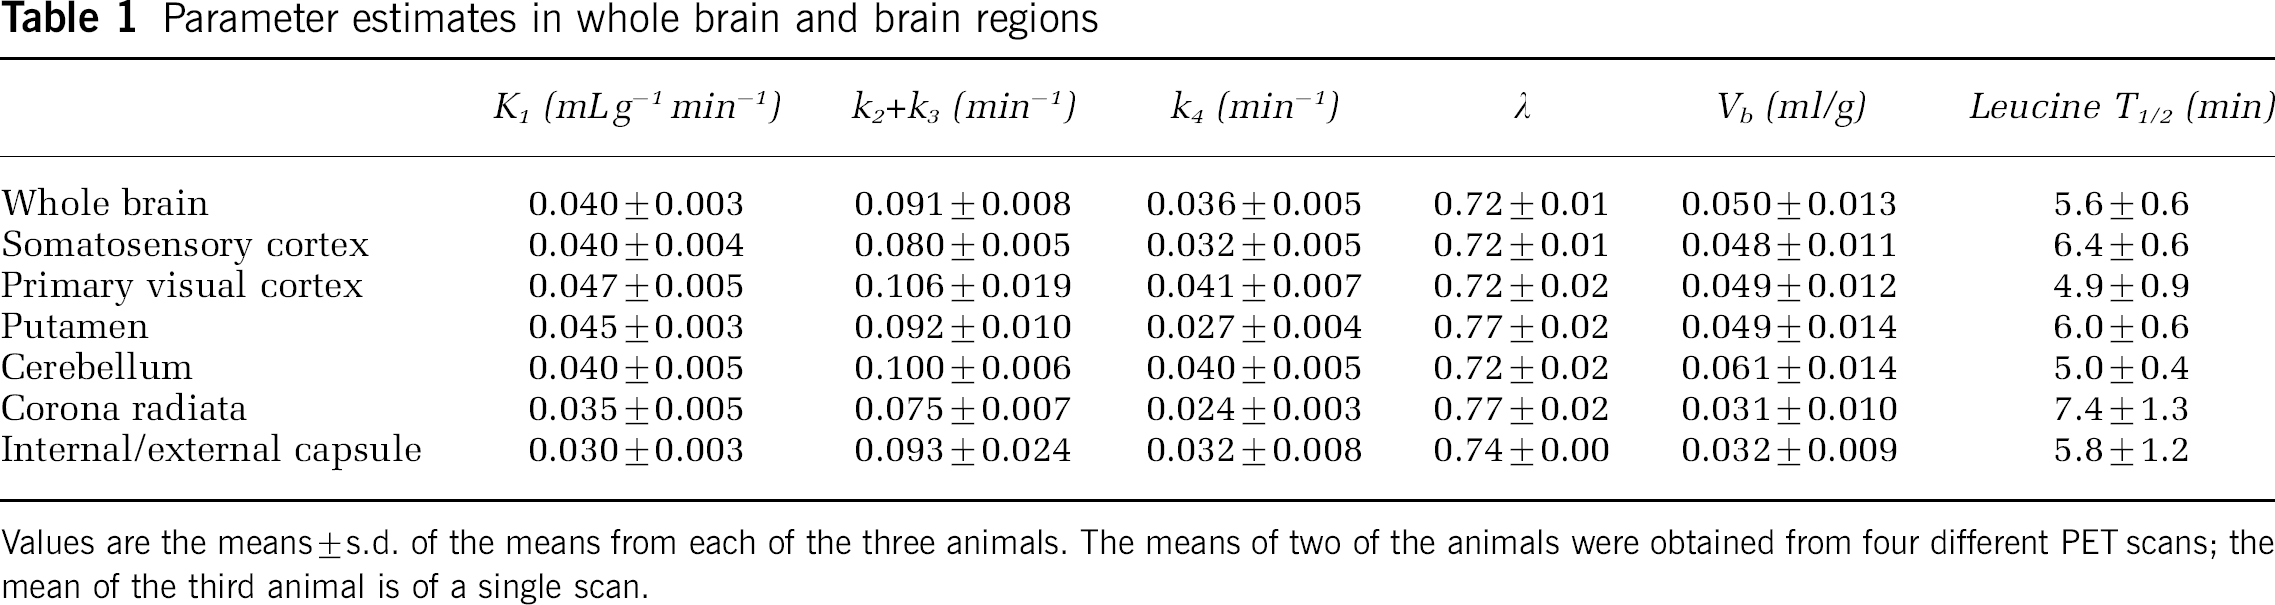
Values are the means±s.d. of the means from each of the three animals. The means of two of the animals were obtained from four different PET scans; the mean of the third animal is of a single scan.
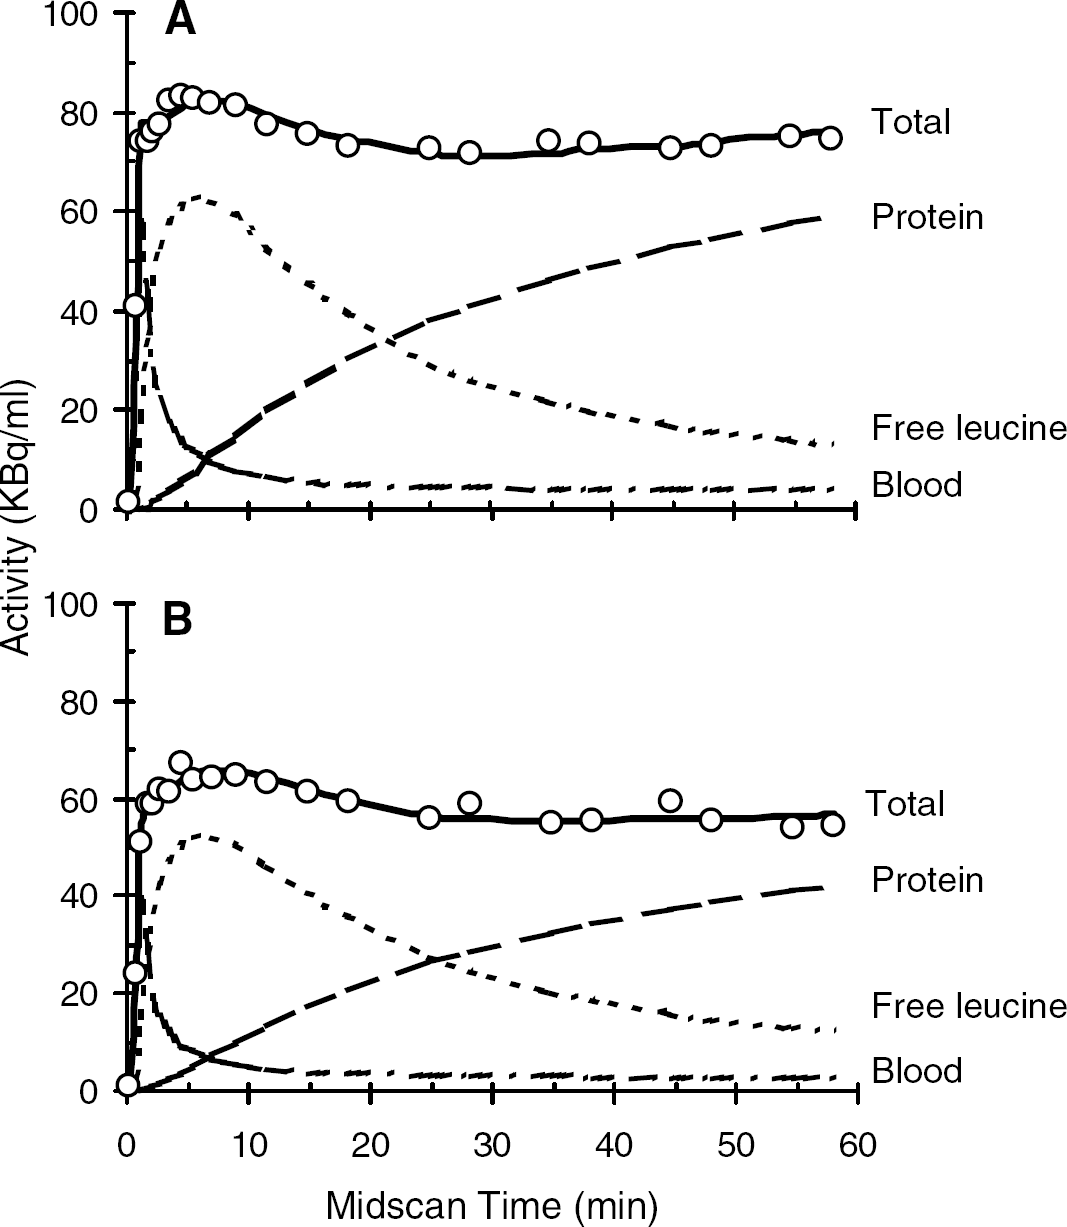
Time courses of 11C activity from a typical study after an intravenous injection over 1 min of 0.31 GBq L-[1-11C]leucine in primary visual cortex (
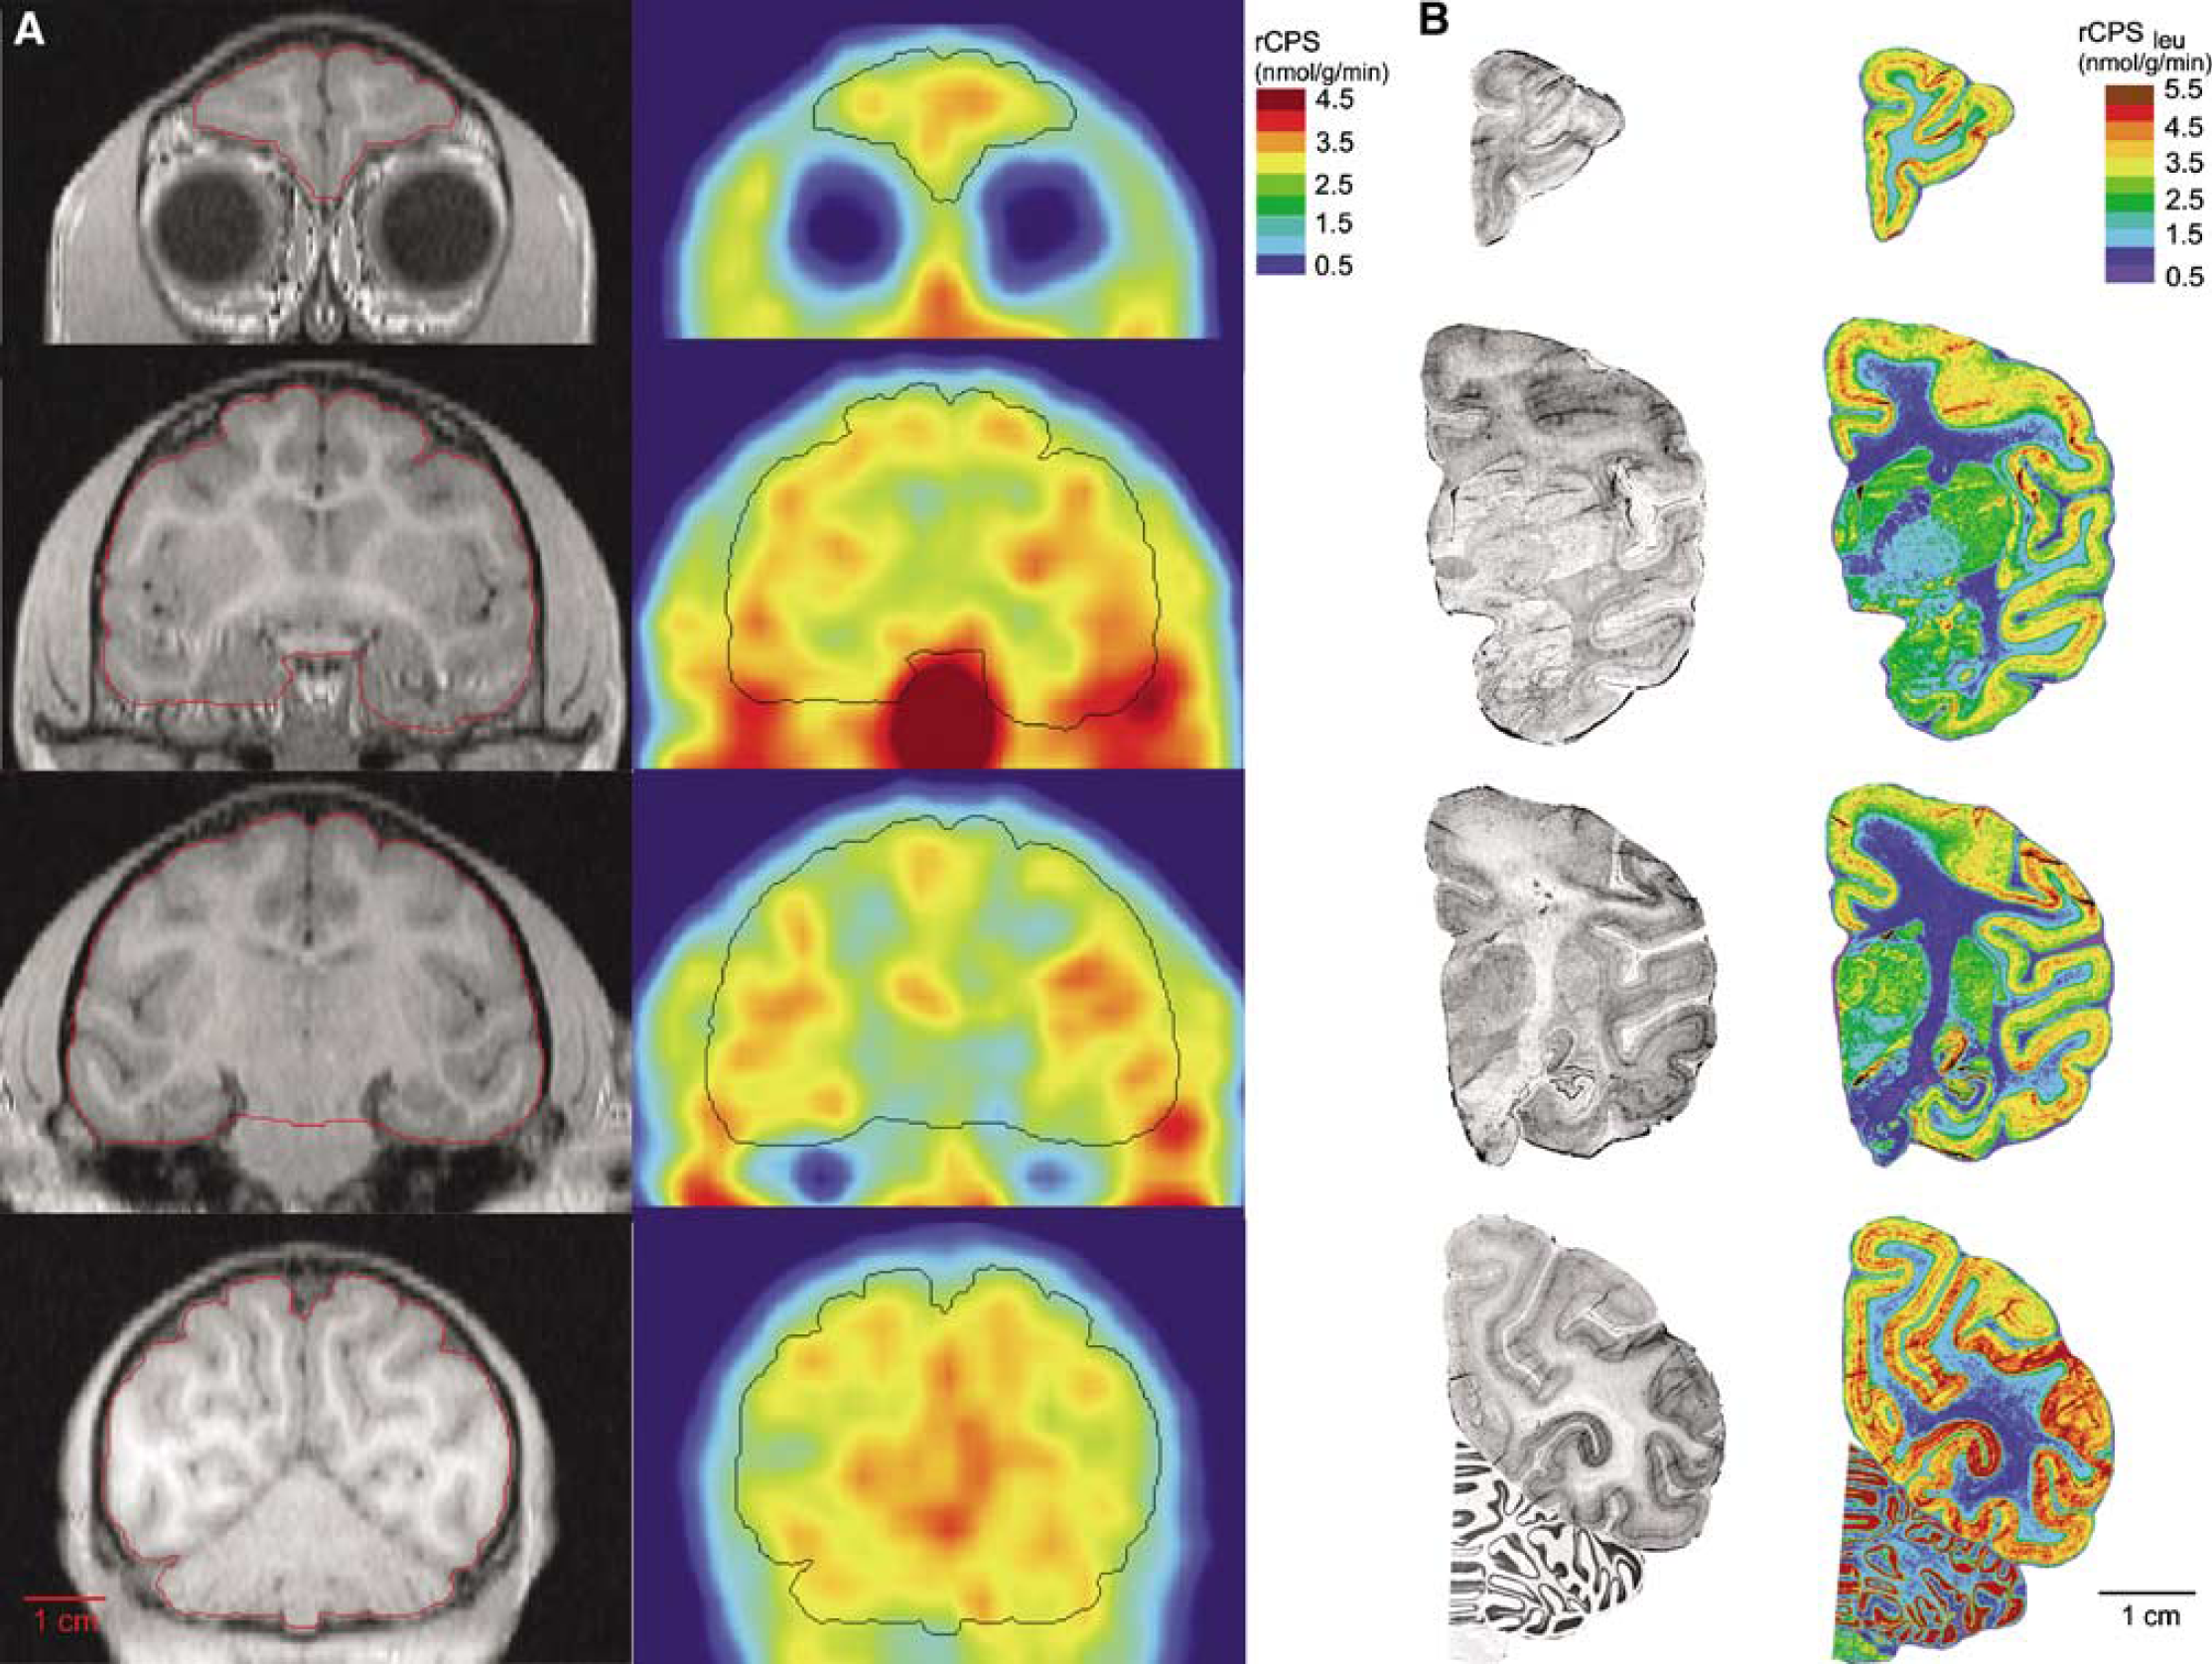
Rates of leucine incorporation into protein in the whole brain, cerebellum, and five regions were computed by both methods ‘A’ and ‘B’ (Tables 2 and 3). With both methods highest values are in the primary visual cortex, lowest values are in the white matter, and the high gray to white matter ratio is 1.4 to 2.1. Two of the animals were studied four times each and agreement among repeated studies is good as is agreement among the three animals (Table 2). Values of rCPS computed with method ‘B’ are generally 10% to 15% higher than those computed with method ‘A’. Variances are also higher with method ‘B’. In whole brain, intraanimal coefficients of variation are 7% to 8% with method ‘A’ and 10% to 12% with method ‘B’ (Table 2), and interanimal coefficients of variation are 4% and 9% with methods ‘A’ and ‘B’, respectively (Table 3). Average arterial plasma concentrations of free leucine in the nine PET studies ranged from 142 to 248 nmol/mL (178±32; mean±s.d.) with a coefficient of variation of 32%. There was no apparent correlation between whole brain CPS and plasma leucine concentration (ρ=0.13, method ‘A’; ρ=0.45, method ‘B’). Parametric images of rCPS at the levels of the prefrontal cortex, caudate nucleus, secondary somatosensory cortex, and the primary visual cortex are shown in Figure 4A.
Comparison of L-[1-11C]leucine PET (
rCPS (nmol g−1 min−1) in adult rhesus monkeys determined with L-[1-11C]leucine PET: comparison of computation methods A and B
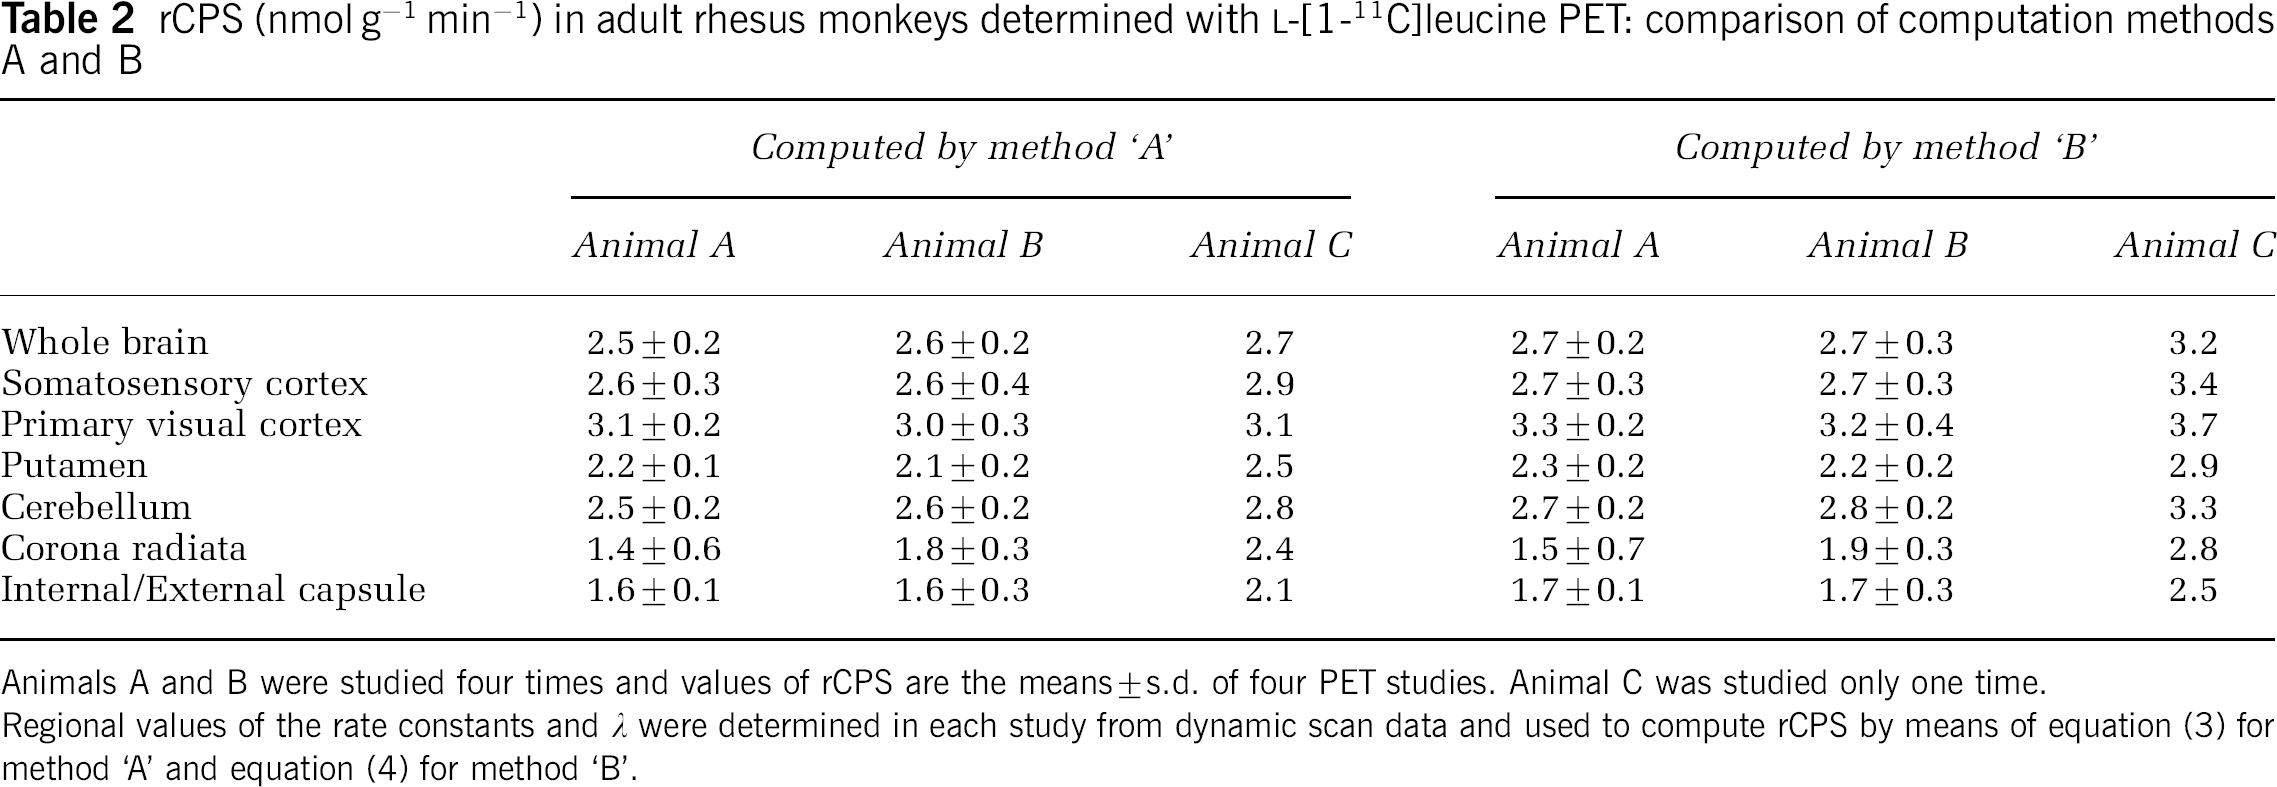
Animals A and B were studied four times and values of rCPS are the means±s.d. of four PET studies. Animal C was studied only one time.
Regional values of the rate constants and λ were determined in each study from dynamic scan data and used to compute rCPS by means of equation (3) for method ‘A’ and equation (4) for method ‘B’.
Comparison of rCPS (nmol g−1 min−1) in adult rhesus monkeys determined with L-[1-11C]leucine PET and L-[1-14C]leucine autoradiographic methods
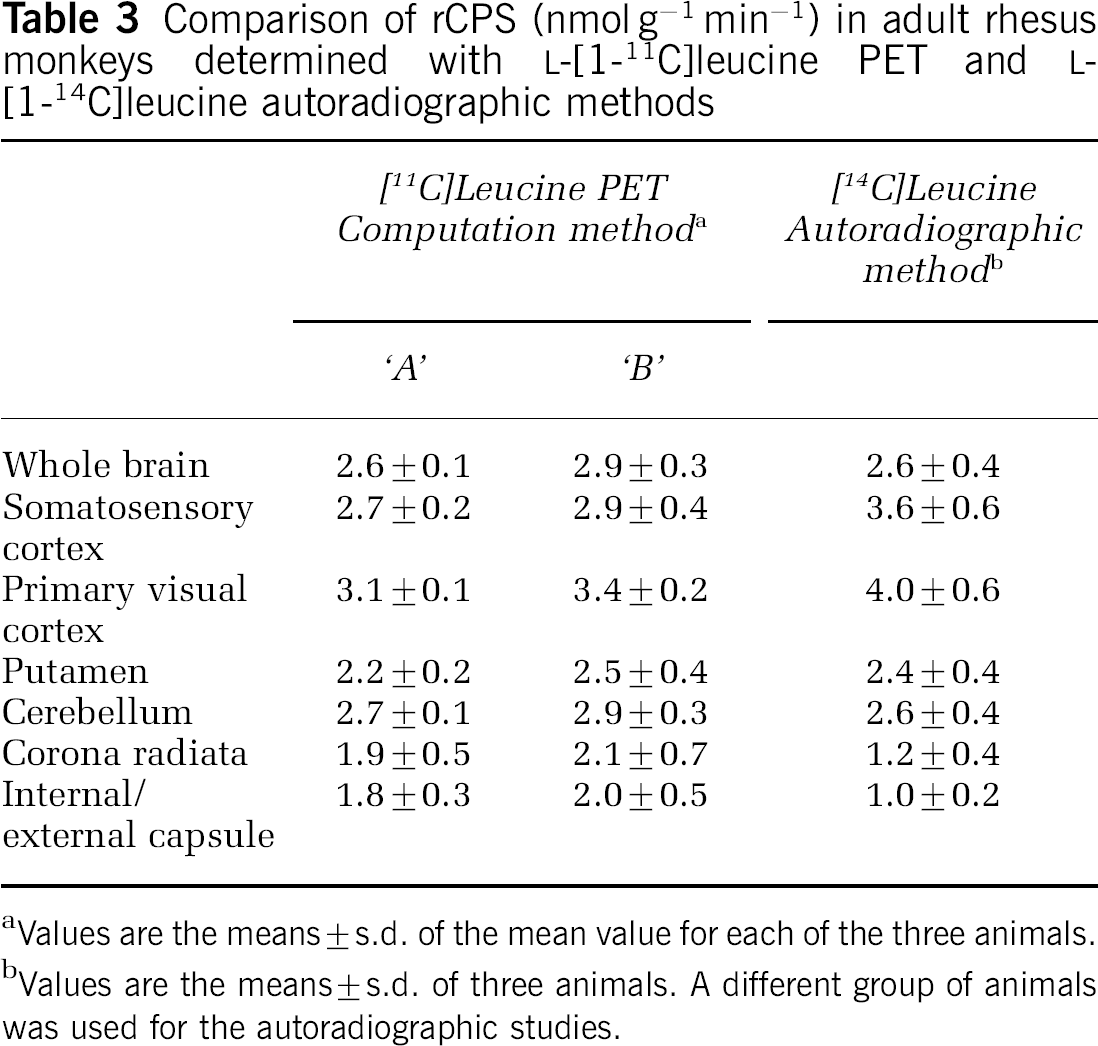
Values are the means±s.d. of the mean value for each of the three animals.
Values are the means±s.d. of three animals. A different group of animals was used for the autoradiographic studies.
Biochemical determinations of λ were conducted in animals A, B, and C subsequent to the PET studies. Arterial plasma [3H]leucine specific activity was maintained fairly constant for the last 40 mins of the 120-min infusion (within 5% of the mean) (Figure 5). The [3H]leucine specific activity in the brain tRNA-bound pool was on average 75% of that of the arterial plasma (Table 4), indicating that 25% of the leucine in the precursor pool comes from protein breakdown. There was minimal variation among the three animals (<3%). There was no statistically significant difference between the values of λ determined by the PET kinetic modeling method and the biochemical method (paired Student's t-test).
Specific activity of [3H]leucine in plasma and of tRNA-bound [3H]leucine in brain from a typical steady-state experiment to determine λ, the fraction of the precursor pool for protein synthesis that is derived from the arterial plasma. A programmed infusion was administered to achieve and maintain a constant specific activity of [3H]leucine in the plasma (◇) over 120 mins. Arterial plasma leucine concentration (□) was also relatively constant over this interval. After 120 mins, the animal was killed and the specific activity of the tRNA-bound leucine in brain (○) was measured. λ is the steady-state ratio of the specific activity of leucine in the tissue tRNA-bound fraction to that in the arterial plasma, that is,
Comparison of estimated and measured values of λ for whole brain in the same animals
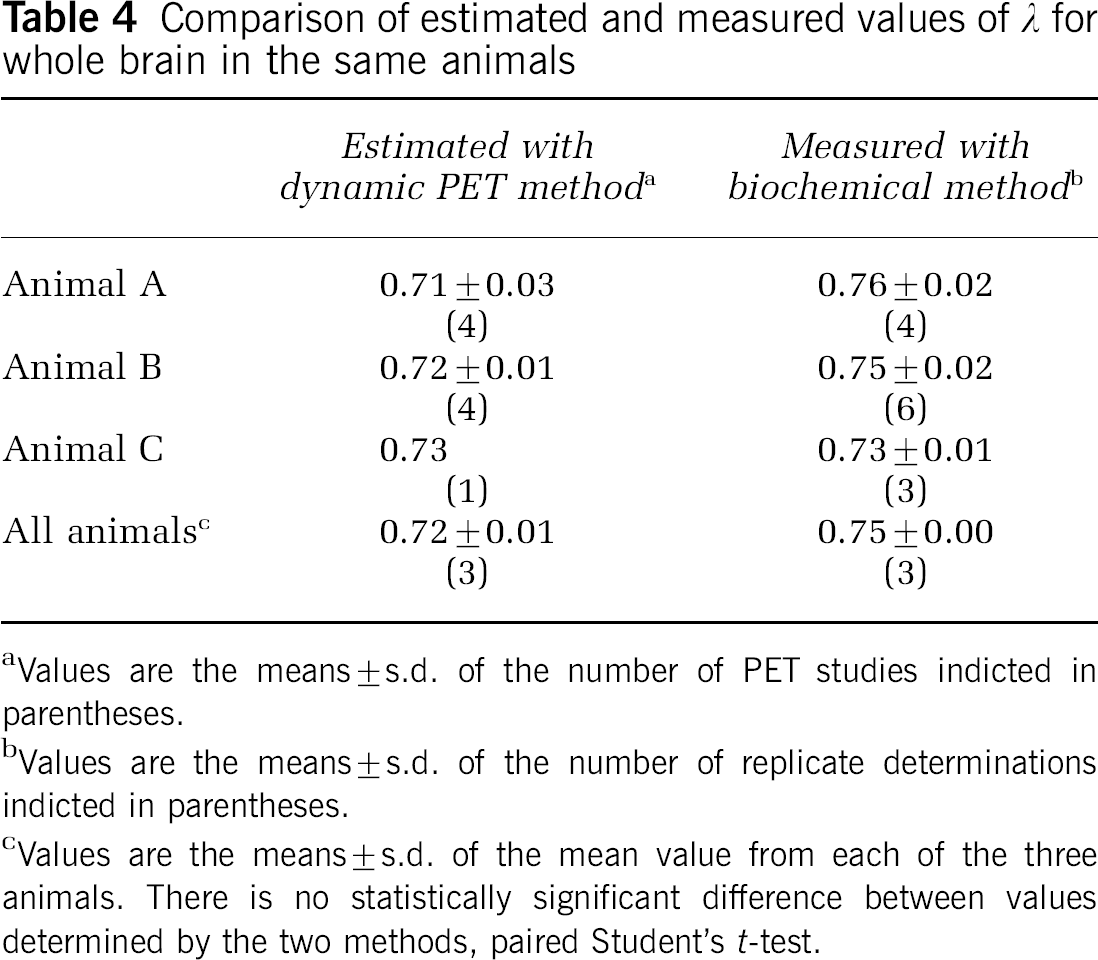
Values are the means±s.d. of the number of PET studies indicted in parentheses.
Values are the means±s.d. of the number of replicate determinations indicted in parentheses.
Values are the means±s.d. of the mean value from each of the three animals. There is no statistically significant difference between values determined by the two methods, paired Student's t-test.
A separate series of three monkeys was subjected to the procedure for the autoradiographic determination of rCPS with L-[1-14C]leucine. Typical clearance curves for total 14C activity in whole blood, 14CO2 in whole blood, and free [14C]leucine in arterial plasma are shown in Figure 6. Free [14C]leucine concentration reached a peak value in the plasma at approximately 1.3 mins and cleared to 10% of the peak value by 8 mins. Activity in blood CO2 steadily rose during the first 10 mins and leveled off remaining at approximately 19% of the total activity in blood for the duration of the experiment (Figure 6, inset). Measurements of 14C activity in the compartments in brain could only be performed at the 60-min time point. For comparison with [11C]leucine PET studies, we calculated activities in each compartment as a percent of total activity in brain including both the blood and the 14CO2 in brain. 14CO2 was on average 4% to 5% of the total activity and the brain:blood ratio of 14CO2 concentrations was 0.41±0.06 (n=3) at 60 mins. Free [14C]leucine was estimated from the difference between activity in tissue sections determined by the quantitative autoradiographic method before and after formalin fixation and washing. Activity in 14CO2 might also have washed out of the tissue sections with the free leucine if it had not already been lost at the time of thaw-mounting of tissue sections to glass microscope slides. Taking this uncertainty into consideration, on average 14% to 17% of the total 14C activity is in free leucine and 77% to 79% is in protein 60 mins after [14C]leucine administration.
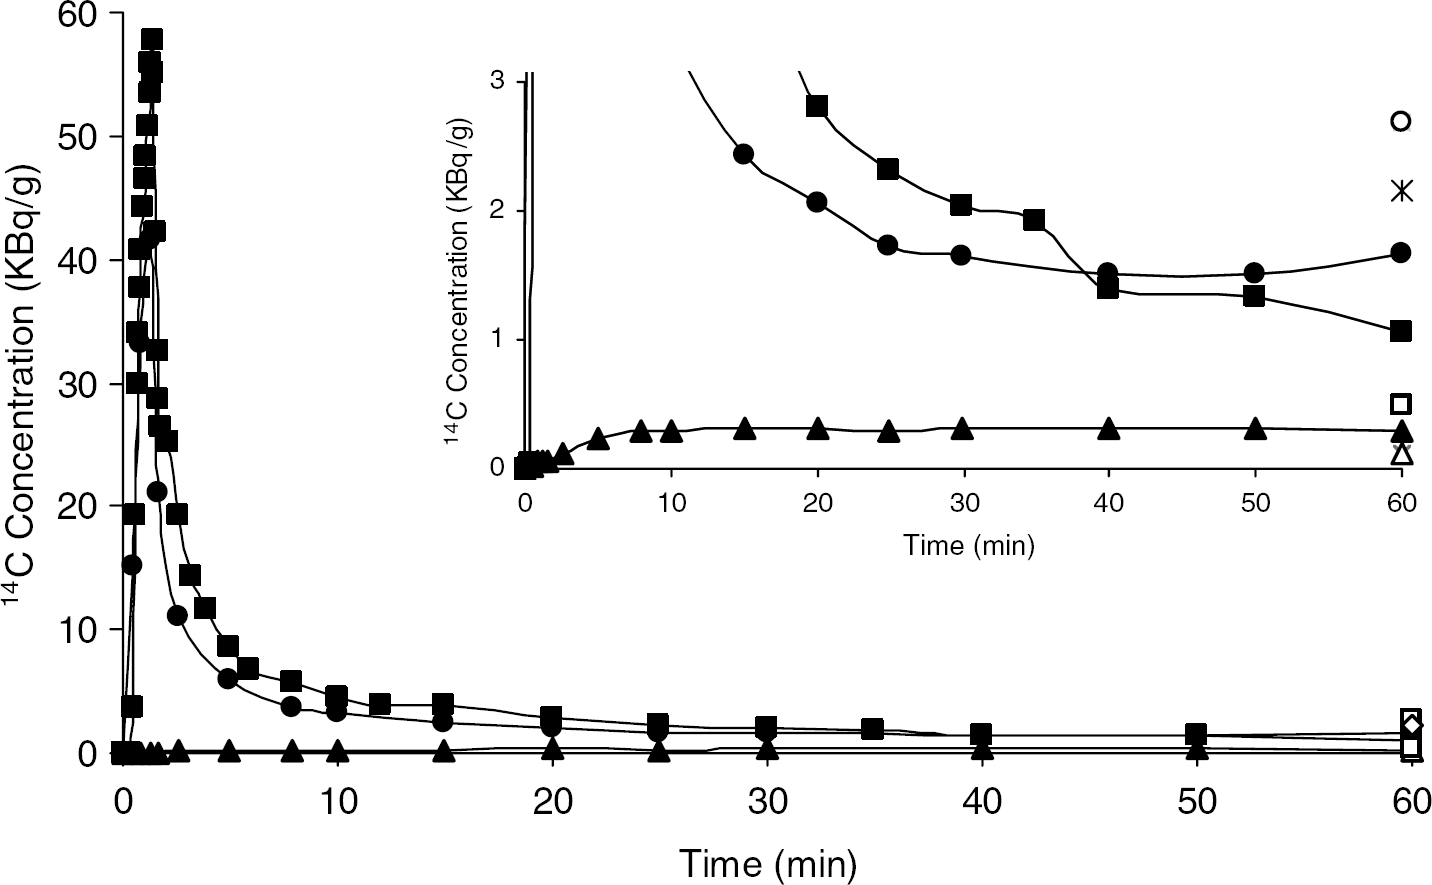
Typical arterial clearance curve after a 1 min intravenous injection of L-[1-14C]leucine (3.7 MBq/kg). Filled circles (•) and triangles (▴) represent total activity and activity in CO2 in whole blood. Filled squares (▪) represent activity in free leucine in plasma. The inset shows the same data with the ordinate scale expanded. Open symbols represent activity in brain tissue as follows: total activity (○), activity in protein (*), activity in free leucine (□), activity in CO2 (▵).
In the [14C]leucine autoradiographic studies, rCPS was determined in the brain as a whole, cerebellum, and in the same regions of gray and white matter analyzed in the [11C]leucine PET studies (Table 3, Figure 4B). Agreement between the autoradiographic and PET studies computed with method ‘A’ is excellent in whole brain and cerebellum. CPS in whole brain and cerebellum determined with PET and computed by method ‘B’ are 12% to 15% higher than the autoradiographic results. Rates determined with the autoradiographic method in gray and white matter are generally higher and lower, respectively, than rates determined with PET most likely due to the effect of partial volume in the PET analysis.
Discussion
The present study in monkeys is the first fully quantitative measurement of rCPS with PET. The PET method is adapted from the autoradiographic L-[1-14C]leucine method; it uses L-[1-11C]leucine and a kinetic modeling approach employing dynamic PET scanning to estimate rate constants, calculate λ, and measure rCPS. We have confirmed the validity of this method by determining λ and rCPS in adult monkeys with established biochemical and autoradiographic methods, respectively. We used adult rhesus monkeys for these studies to be able to differentiate among brain regions with a 11C-labeled tracer and PET. In all three types of studies (PET, biochemical, and autoradiographic), animals were maintained under identical conditions of isoflurane anesthesia during the entire procedure.
The autoradiographic [1-14C]leucine method developed for use in experimental animals is based on a comprehensive model for the behavior of leucine in brain. In its implementation, the operational equation of the method (Smith et al, 1988) is simplified by two experimental procedures: (1) fixing and washing tissue sections to wash out all labeled compounds except the protein product and (2) administering the tracer as a pulse and allowing a long enough time for the lag of the specific activity of the precursor pool behind the plasma to become very small (second integral in the denominator of equation (5)). These procedures reduce the operational equation of the method to a very simple form and minimize the dependence on estimated values of the kinetic model rate constants. The correction factor (λ) for dilution of the precursor pool specific activity by unlabeled leucine from protein breakdown remains and must be determined in a separate group of animals with a model-independent biochemical method.
In the adaptation of the method for use with PET, we cannot use the first simplifying procedure and we cannot determine λ with a biochemical method. We must rely on the compartmental model and the estimated parameters to determine the activity in the protein product in brain and to calculate λ. It was necessary, therefore, to simplify the compartmental model to reduce the number of parameters and improve the likelihood of reliably estimating their values. The simplified model includes a single tissue compartment for leucine not incorporated into protein and a tissue compartment of labeled CO2 produced primarily as a byproduct of leucine metabolism in the whole body. From the parameters of this simplified model and the measured activity in whole blood, blood CO2, and plasma leucine, we can calculate the value of λ and the concentrations of label in the various pools in the field of view of the PET camera.
That this approach can yield valid results is determined by comparison with direct measurements. The results of our PET studies are in remarkable agreement with the biochemical and autoradiographic determinations of λ and rCPS. The two methods yield almost identical values for λ in whole brain. Further, under the conditions of the present study, there was little regional variability in the value of λ. Average measurements of rCPS for whole brain and cerebellum obtained with the autoradiographic and PET methods (computation method ‘A’) are also identical. The effects of partial volume are seen in the regional determinations of cerebral protein synthesis. Values for rCPS determined with the PET method (computation method ‘A’) compared with values determined with the autoradiographic method are approximately 25% lower in cortex and 60% and 80% higher in corona radiata and internal/external capsule, respectively. The direction of the differences and their relative magnitudes are consistent with partial volume effects. The two methods of computation (‘A’ and ‘B’) of rCPS from PET data are mathematically equivalent; they differ only in the form of the equation. The form of the equation used in method ‘B’ is more sensitive to the values of the rate constants than method ‘A’. In our studies agreement with the autoradiographic results is not as good and variances are higher when rCPS was computed by method ‘B’.
In fitting the model to measured variables in the present PET studies, we assumed that the activity in tissue CO2 is small and can, therefore, be ignored. This assumption is based on the measurements in rats in which brain 14CO2 reaches a peak of 10% of the total brain activity at 10 mins after a pulse of L-[1-14C]leucine and decreases to less than 5% after 30 mins (Schmidt et al, 2005). We tested the validity of this assumption in the terminal [14C]leucine experiments in monkeys and found that the activity in CO2 in the brain is indeed negligible (only 4% to 5% of the total activity at 60 mins). In the blood, activity in CO2 is constant from 10 mins after the administration of [14C]leucine to 60 mins. These data confirm the validity of our assumption that under the conditions of these studies, that is, isoflurane anesthesia, activity in CO2 in brain can be ignored.
Further confirmation of the validity of the kinetic modeling approach is seen in agreement between the fitted and measured activity in free leucine and protein at the 60-min time point. The model predicts that in whole brain an average of 15% of the total activity at 60 mins is in free leucine; measured activity in free leucine is 14% to 17%. The model predicts that in whole brain 84% of the activity at 60 mins is in protein; measured activity in protein is 77% to 79%.
Ours is not the first study to use a tracer amino acid with PET. Tracers such as L-[methyl-11C]methionine (Bustany et al, 1986) and L-2-[18F]fluorotyrosine (Coenen et al, 1989) have been used, but the metabolism of both of these tracers leads to significant amounts of labeled products other than protein. Furthermore, to measure actual rates of tyrosine incorporation into protein, the ‘isotope effect’ with the fluorinated amino acid must be determined. The use of a carboxyl-labeled, aliphatic branched-chain amino acid such as L-leucine obviates the problems of extraneous biochemical reactions and the production of labeled metabolic products other than labeled protein. In one other study, L-[1-11C]leucine was used as a PET tracer in monkeys (Hawkins et al, 1989), but no attempt was made to correct for recycling of amino acids. Hawkins et al (1989) reported a value of 0.55 nmol g−1 min−1 for hemispheric rCPS, considerably below the value of 2.6 nmol g−1 min−1 measured in our study. The discrepancy might be due to the lack of correction for recycling and the use of an estimated metabolite correction rather than a directly measured input function. Additionally, Hawkins et al (1989) used a kinetic model that differed in its description of labeled metabolites in brain. In all previous PET studies with radiolabeled amino acids, the problem of evaluating λ to correct for recycling has been largely ignored, and studies have been limited to measurement of incorporation rates of amino acids supplied by the circulation only. This approach is especially problematic because observed changes in incorporation rates can be due to changes in recycling, changes in rates of protein synthesis, or both. In the present study, we address, for the first time, the issue of recycling in PET studies of protein synthesis.
The ability to measure rates of protein synthesis quantitatively with PET provides us with a new tool to investigate the brain and its regional adaptive responses. The biosynthesis of proteins is essential for growth and continued maintenance of the entire neuron including axons, dendrites, and synaptic terminals, and is clearly one of the important biochemical processes underlying adaptive changes. Studies in experimental animals with the autoradiographic L-[1-14C]leucine method show some of the conditions in which changes in rCPS occur. The course of postnatal development in the rat is accompanied by widespread and progressive decreases in rCPS the time courses of which vary regionally (Sun et al, 1995). Further decreases occur during the more prolonged process of aging (Smith et al, 1995). Regional rates of cerebral protein synthesis are also affected by changes in synaptic input during development as seen in a study of plasticity in the developing monkey visual system (Kennedy et al, 1981). Studies in monkeys show a positive correlation between rCPS and deep sleep (Nakanishi et al, 1997), and during hibernation in ground squirrels rCPS is suppressed to less than 1% of normal (Frerichs et al, 1998). Cocaine administration alters rCPS in selective brain regions in conscious rats (Orzi et al, 1995). In response to unilateral axotomy of the hypoglossal nerve in the rat, rCPS increases in the ipsilateral hypoglossal nucleus and returns to normal levels when reinnervation of the muscles of the tongue and the reformation of efferent connections to the hypoglossal nucleus are completed (Smith et al, 1984). Effects on rCPS are seen in pathological conditions in rats such as ischemia (Widmann et al, 1991), focal seizures (Collins et al, 1980), experimental brain tumors (Widmann et al, 1992), and spreading cortical depression (Mies, 1993), and under some of these conditions λ is reported to change substantially, but only in the pathological region (Widmann et al, 1991). As the [11C]leucine PET method allows estimation of regional values of λ, we expect that accurate measures of rCPS should be achievable under pathological conditions but it will be essential to test the validity of the method under such conditions. Studies in rodents show that rCPS is relatively unaffected by light barbiturate anesthesia (Smith et al, 1998), suggesting that studies of cerebral protein synthesis with PET can be made on anesthetized subjects without considerable confounding effects. Based on the findings in rodents and monkeys, we anticipate that the L-[1-11C]leucine PET method will have many applications in the study of normal human brain and in clinical medicine by providing a new tool to investigate disorders of brain development, recovery from brain injury, and neurodegenerative diseases.
Footnotes
Acknowledgements
We thank the following technologists in the PET Department: P Baldwin, J Jacobs, S Sestrich, J Bacon, and T Howe, and M Der, RPh. We thank Dr A Chaudry, J Gray, N Phipps for monitoring the animals' physiological state during the studies, D Glen for assisting with computer programming, and Dr L Sokoloff for his support during this project.