
Abstract
We developed and validated a method to estimate input functions for determination of regional rates of cerebral protein synthesis (rCPS) with L-[1-11C]leucine PET without arterial sampling. The method is based on a population-derived input function (PDIF) approach, with venous samples for calibration. Population input functions were constructed from arterial blood data measured in 25 healthy 18–24-year-old males who underwent L-[1-11C]leucine PET scans while awake. To validate the approach, three additional groups of 18–27-year-old males underwent L-[1-11C]leucine PET scans with both arterial and venous blood sampling: 13 awake healthy volunteers, 10 sedated healthy volunteers, and 5 sedated subjects with fragile X syndrome. Rate constants of the L-[1-11C]leucine kinetic model were estimated voxel-wise with measured arterial input functions and with venous-calibrated PDIFs. Venous plasma leucine measurements were used with venous-calibrated PDIFs for rCPS computation. rCPS determined with PDIFs calibrated with 30–60 min venous samples had small errors (RMSE: 4–9%), and no statistically significant differences were found in any group when compared to rCPS determined with arterial input functions. We conclude that in young adult males, PDIFs calibrated with 30–60 min venous samples can be used in place of arterial input functions for determination of rCPS with L-[1-11C]leucine PET.
Introduction
Quantitative positron emission tomography (PET) studies typically require measurement of the time course of concentration of PET radiotracer in arterial plasma obtained from serial sampling of arterial blood. Because this approach is invasive for the patient and associated with some risk, the issue of non-invasive estimation of the plasma time-activity curve (TAC) in PET has been extensively addressed. The studies in this regard can be divided into four categories. Wong et al. 1 proposed an approach based on the use of an equation to describe the unknown plasma TAC. Parameters of this equation are estimated simultaneously with the estimation of the parameters of the tissue tracer kinetic model using as data measured tissue TACs in several regions-of-interest (ROIs). This approach is computationally expensive, may not converge, and requires knowledge of the functional form of the plasma TAC. 2 Others have used an image-derived input function (IDIF) to estimate the plasma TAC from measured PET data (e.g. see literature3–7). IDIFs, however, are biased due to partial-volume effects and cannot be used when no large arterial blood pool is in the field of view. Their performance is highly dependent on the accuracy of partial volume correction and placement of the arterial ROIs. Furthermore, they require a well-defined relationship between whole blood total activity and plasma parent tracer activity, which is particularly difficult for tracers with significant amounts of labeled metabolites in blood. A third approach, applicable to some receptor-binding tracers, utilizes a reference tissue region in which there is no significant specific binding of the ligand (see, e.g. Wong et al. 8 ). The fourth group of methods is based on the use of population-derived input functions (PDIFs) obtained by averaging measured arterial plasma TACs, normalized by injected dose and a factor assumed proportional to total blood volume (usually body weight), over many subjects.5,7,9,10 For any individual subject, the plasma TAC is then computed from the PDIF using that individual’s injected dose and body weight. IDIFs and PDIFs have frequently been used in conjunction with arterial or venous samples for calibrating individual plasma TACs,4–7,9 but venous samples cannot provide good calibration for tracers that exhibit substantial differences in arterial and venous activities. Due to arterial-venous differences, Zanotti-Fregonara et al., 5 for example, concluded that PDIF and IDIF for the tracer [11C](R)-rolipram provided satisfactory results only when arterial samples were used for calibration.
The suitability of PDIFs and IDIFs depends not only on the kinetics of the specific tracer, but also on the analysis method used to determine the parameter of interest. Many of the studies utilizing PDIFs or IDIFs were performed using graphical methods, e.g. the Patlak11,12 or Logan plot, 13 for estimating the macroparameters irreversible uptake rate constant (Ki) or volume of distribution (VT), respectively; these graphical methods are known to be robust with respect to errors in the input function. 14 Estimation of individual parameters of the tracer kinetic model is more sensitive to input function errors, 14 but some studies have successfully estimated individual kinetic parameters with a calibrated PDIF or IDIF with, e.g., [11C]flumazemil, 3 [carbonyl-11C]WAY-100635, 4 and [18F]fluoride. 7
In the current study, we developed and validated a method to determine regional rates of cerebral protein synthesis (rCPS) with the L-[1-11C]leucine PET method without the need for arterial sampling. In the case of L-[1-11C]leucine, three input functions, i.e. time courses of the concentrations of arterial plasma [11C]leucine, arterial blood total 11C, and arterial blood 11CO2, are required for estimation of individual parameters of the kinetic model for leucine. In addition, the concentration of unlabeled leucine in arterial plasma is required for determination of rCPS. 15 We tested a PDIF-based approach with venous samples for calibration to estimate kinetic parameters at the voxel level. rCPS was then computed with the concentration of unlabeled leucine in venous plasma substituting for arterial measurement. In order to assess accuracy of the method, rCPS values thus obtained were compared with those estimated with the measured arterial data, the gold standard for L-[1-11C]leucine PET analysis.
Materials and methods
Kinetic model
The kinetic model used to describe the behavior of leucine in brain (Figure 1) has been described in detail
16
and is summarized briefly below.
Homogeneous tissue kinetic model for L-[1-11C]leucine. Total concentration of 11C (CT*) includes free L-[1-11C]leucine and L-[1-11C]leucine incorporated into tissue protein (CE* and P*, respectively), plus activity in blood (VbCb*, where Vb is the fraction of the volume occupied by blood and Cb* is the concentration of activity in whole blood). Total 11C also includes labeled products of L-[1-11C]leucine metabolism: 11CO2 and products of 11CO2 fixation. K1 and k2 are the rate constants for transport of leucine from plasma to tissue and back, respectively. k3 is the rate constant for the first two steps in leucine catabolism, transamination and decarboxylation, which yield 11CO2. k4 and k5 are the rate constants for leucine incorporation into protein and release of free leucine from proteolysis, respectively. It is assumed that (i) there is no significant breakdown of labeled product during the experimental interval, i.e. k5P*∼0; (ii) fixation of 11CO2 during the experimental period is negligible;30,31 and (iii) equilibration of diffusible 11CO2 between brain and blood is rapid.
30
The concentration of 11CO2 in tissue is approximated by VDCc*, where Cc* is the 11CO2 concentration in whole blood and VD is the brain:blood equilibrium distribution volume of 11CO2. VD was fixed at 0.41, the value measured in rhesus monkeys,
24
which is in agreement with the mean whole brain:plasma equilibrium distribution volume determined from 11CO2 studies in humans.
25
The blood:plasma equilibrium distribution volume is close to unity.
26
The model assumes the tissue voxel is homogeneous with respect to concentrations of amino acids, blood flow, rates of transport and metabolism of amino acids, and rates of incorporation into protein.
15
The model used to describe labeled leucine also describes unlabeled leucine (bottom row), except that unlabeled leucine and protein are in steady state, and the steady-state breakdown of unlabeled protein (k5P) is greater than zero. Under the assumption that there is no isotope effect, the rate constants for labeled and unlabeled leucine are identical.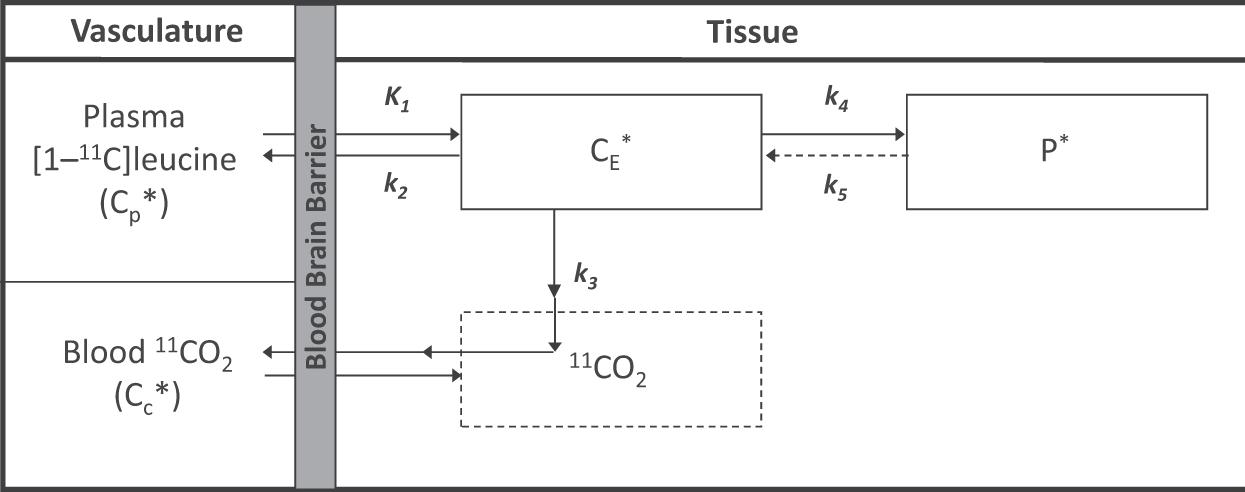
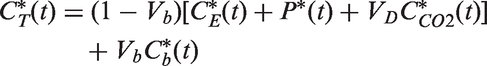
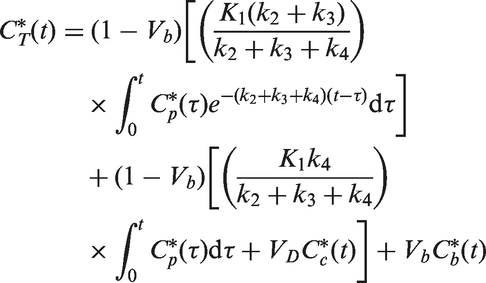
At any time t after tracer injection, the concentration of [11C]leucine in arterial plasma is
Therefore
In the standard approach, time courses of
The physiological parameter of interest, the rate of cerebral protein synthesis rCPS, can be then computed from the estimated rate constants as

From the above equations, the input functions we need in order to estimate rate constants of the kinetic model for [11C]leucine are
PET studies
All studies were conducted according to the Declaration of Helsinki 1975 (and as revised in 1983). All procedures were approved by the National Institutes of Health Combined Neurosciences Institutional Review Board, the National Institutes of Health Radioactive Drug Research Committee, and the National Institutes of Health Radiation Safety Committee. All subjects gave written informed consent. The subjects were monetarily compensated for research-related discomforts and inconveniences.
Subjects studied.
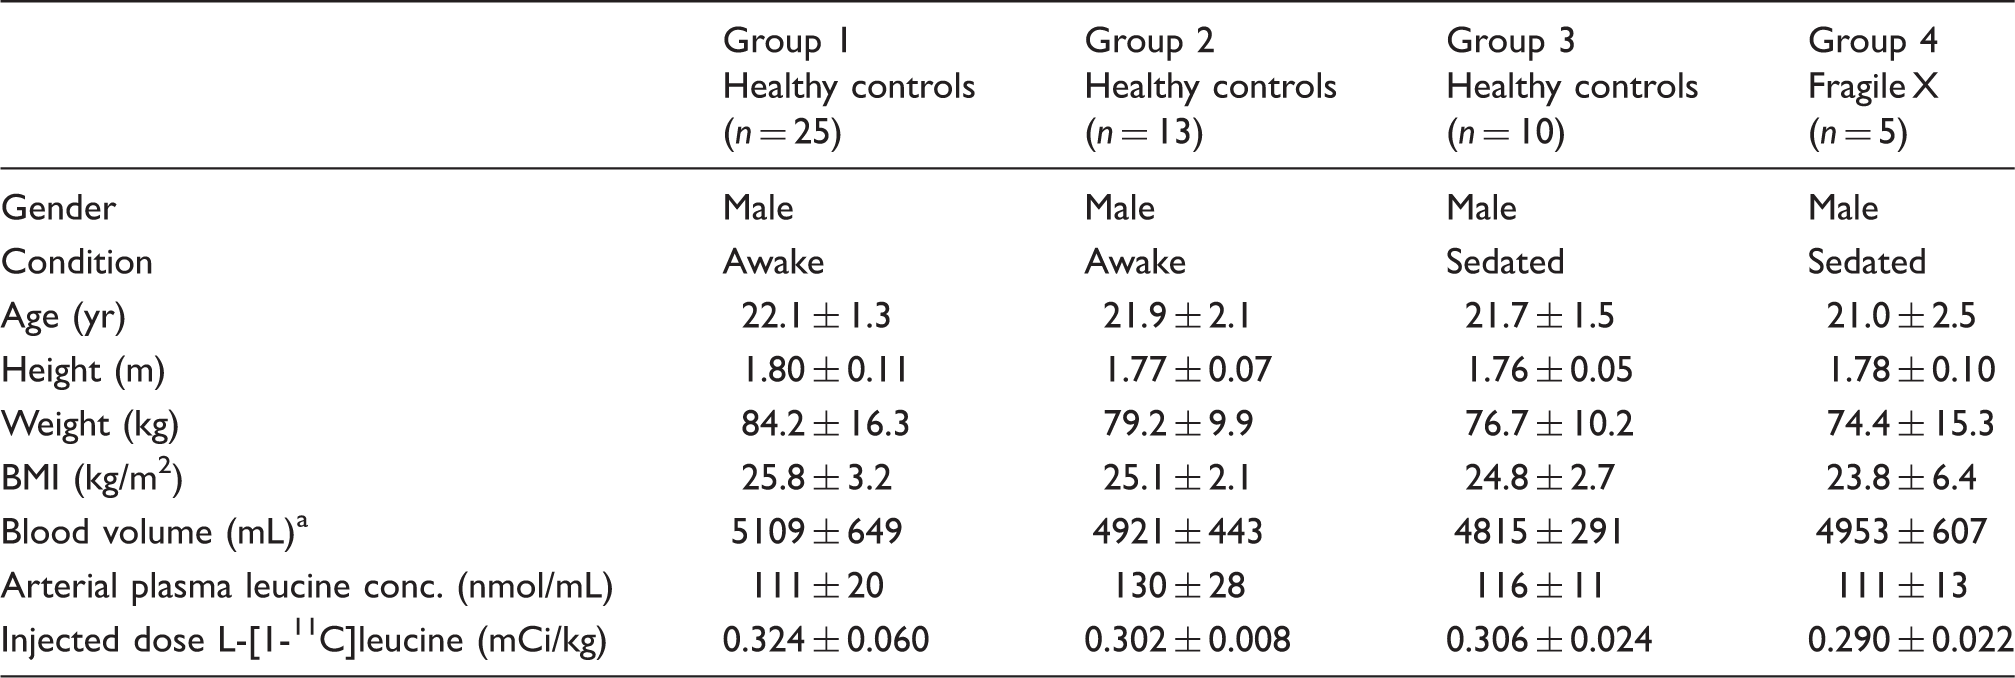
Note: Values are mean ± SD for the number of subjects indicated.
The acquisition protocol was identical to that previously described,15,16,18 except for the addition of venous blood sampling. We summarize it here briefly. Arterial lines were placed in the radial artery of the non-dominant arm and in Groups 2–4, intravenous lines also were placed in the contralateral antecubital fossa. Studies were performed on the ECAT high resolution research tomograph (HRRT) (CPS Innovations, Knoxville, TN). After optimal positioning of subjects within the field of view, a 6-min transmission scan was obtained for attenuation correction. A 90-min emission scan was initiated coincident with the intravenous infusion of 14–31 mCi of L-[1-11C]leucine administered by a computer-controlled infusion pump at a continuous rate over 2 min. Data were acquired in list mode and reconstructed by means of the motion-compensated 3D ordinary Poisson ordered subset expectation maximization (OSEM) algorithm (30 subsets, 2 iterations). 19 Spatial resolution after reconstruction was approximately 2.6 mm full width at half maximum (FWHM) in radial and transverse directions. 19 Three-dimensional data were reconstructed to 207 slices 1.23 mm thick with a pixel size of 1.21 × 1.21 mm. Images were reconstructed as 42 frames of data (16 × 15 s, 4 × 30 s, 4 × 60 s, 4 × 150 s, 14 × 300 s). With this reconstruction, motion-correction was based on position data collected throughout the scan with the Polaris system, 20 and the data were corrected for attenuation based on a single attenuation-correction map (MuMap) applied to all frames of data. To correct for any residual motion, we proceeded as follows: (1) Summed frames 1–17 (0–4.5 min) and aligned the summed image to the MuMap; (2) Determined transformation matrices for frames 18–42 (4.5–90 min post injection) by aligning each frame to the summed image; (3) Applied the inverse of each transformation from the previous step to the original MuMap to obtain individual MuMaps for frames 18–42; (4) Reconstructed the data again utilizing the original motion-correction together with individual MuMaps for each frame; (5) Aligned frames 18–42 with the sum of the first 17 frames using the transformations defined in Step 2. These steps assured not only that the data from each frame were aligned to the initial frames, but also that a correct attenuation correction was applied.
Arterial blood sampling was initiated concurrently with the start of the [11C]leucine infusion. Arterial blood samples were hand drawn continuously (∼one sample every 9–10 s) for the first 4 min, and at increasing intervals thereafter for a total of ∼40 samples per study. Concentrations of unlabeled and labeled leucine in arterial plasma and total 11C and 11CO2 activities in arterial blood were measured according to the methods detailed previously. 17 For subjects in Groups 2–4, venous samples were withdrawn and the concentrations of unlabeled and labeled leucine in venous plasma and total 11C activity in venous blood were measured according to the methods detailed previously. 17 Venous samples were collected 15, 30, 45 and 60 min after tracer injection. Control venous samples were also taken prior to tracer injection to measure the initial concentration of plasma leucine.
PDIFs
In order to determine PDIFs, time courses Cp*(t) and Cb*(t), measured in arterial blood samples of the subjects of Group 1 (the “population” group), were linearly interpolated between samples to provide values at 1 s intervals. The interpolated data for each subject were time shifted so that the maximum value of Cp*(t) was achieved at 140 s, the most frequently occurring peak time in our subjects. Each time course was then divided by the individual’s injected dose of L-[1-11C]leucine in mCi/kg body weight. We also calculated the time course of the ratio

in order to express 11CO2 in arterial blood as a fraction of the total activity in arterial blood. Values of Cp*(t), Cb*(t), and R*(t) were then averaged over all the subjects in the group to create the PDIFs Cp* PDIF (t), Cb* PDIF (t), and R* PDIF (t). Note that each of the values in the PDIFs is based on measured arterial blood data in the population subjects. A flowchart of the procedure is given in Supplemental Figure 1.
Venous calibration of the PDIFs
The PDIFs described above were then applied to the kinetic analyses of subjects in the test groups for assessment of efficacy in determination of rCPS. Timed venous blood samples were taken during the PET scan of each test subject, as described above, and venous concentrations of plasma [11C]leucine and total 11C in blood were measured. Denote these concentrations by Cpv*(ti) and Cbv*(ti), respectively, where the subscript v stands for venous and ti is the time at which the venous blood sample was drawn. Procedures for obtaining venous-calibrated PDIFs are described below and a flowchart is given in Supplemental Figure 2. The steps are as follows.
Plasma L-[1-11C]leucine concentrations. (a) Measured arterial plasma [11C]leucine concentrations in 25 healthy control subjects in Group 1, normalized (divided by) injected dose of L-[1-11C]leucine/kg body weight. Solid lines represent individual subjects. Dashed black line is the mean value for the group, i.e. the PDIF Cp*
PDIF
(t). Tracer was administered at a constant rate over the first two minutes of the study. Individual subjects’ curves were time shifted so that the peak arterial plasma concentration of [11C]leucine occurs at 140 s. (b–c) Measured arterial (red circles) and venous (blue squares) plasma [11C]leucine concentrations, VcPDIF1 (purple line), and VcPDIF2 (green line) for two subjects in Group 2. These subjects are identified as HM7A and HM2A in the Supplemental Data. (b) Both VcPDIF1 and VcPDIF2 agree well with the arterial measurements. Whole brain rCPS was 1.38, 1.40 and 1.34 nmol/g/min when determined with the arterial input function, VcPDIF1 and VcPDIF2, respectively. (c) VcPDIF1 underestimates the peak of the arterial input function, but agrees well with the arterial measurements from about 5 min to the end of the study. VcPDIF2 agrees well with the arterial input function during the first 5 min, but then somewhat overestimates it in the middle part of the scan, approximately 5–30 min. Whole brain rCPS was 1.71, 1.95 and 1.70 nmol/g/min when determined with the arterial input function, VcPDIF1 and VcPDIF2, respectively. The first min are shown on enlarged time scale in the left column. Note the different scale on the ordinate of graphs in the left and right columns.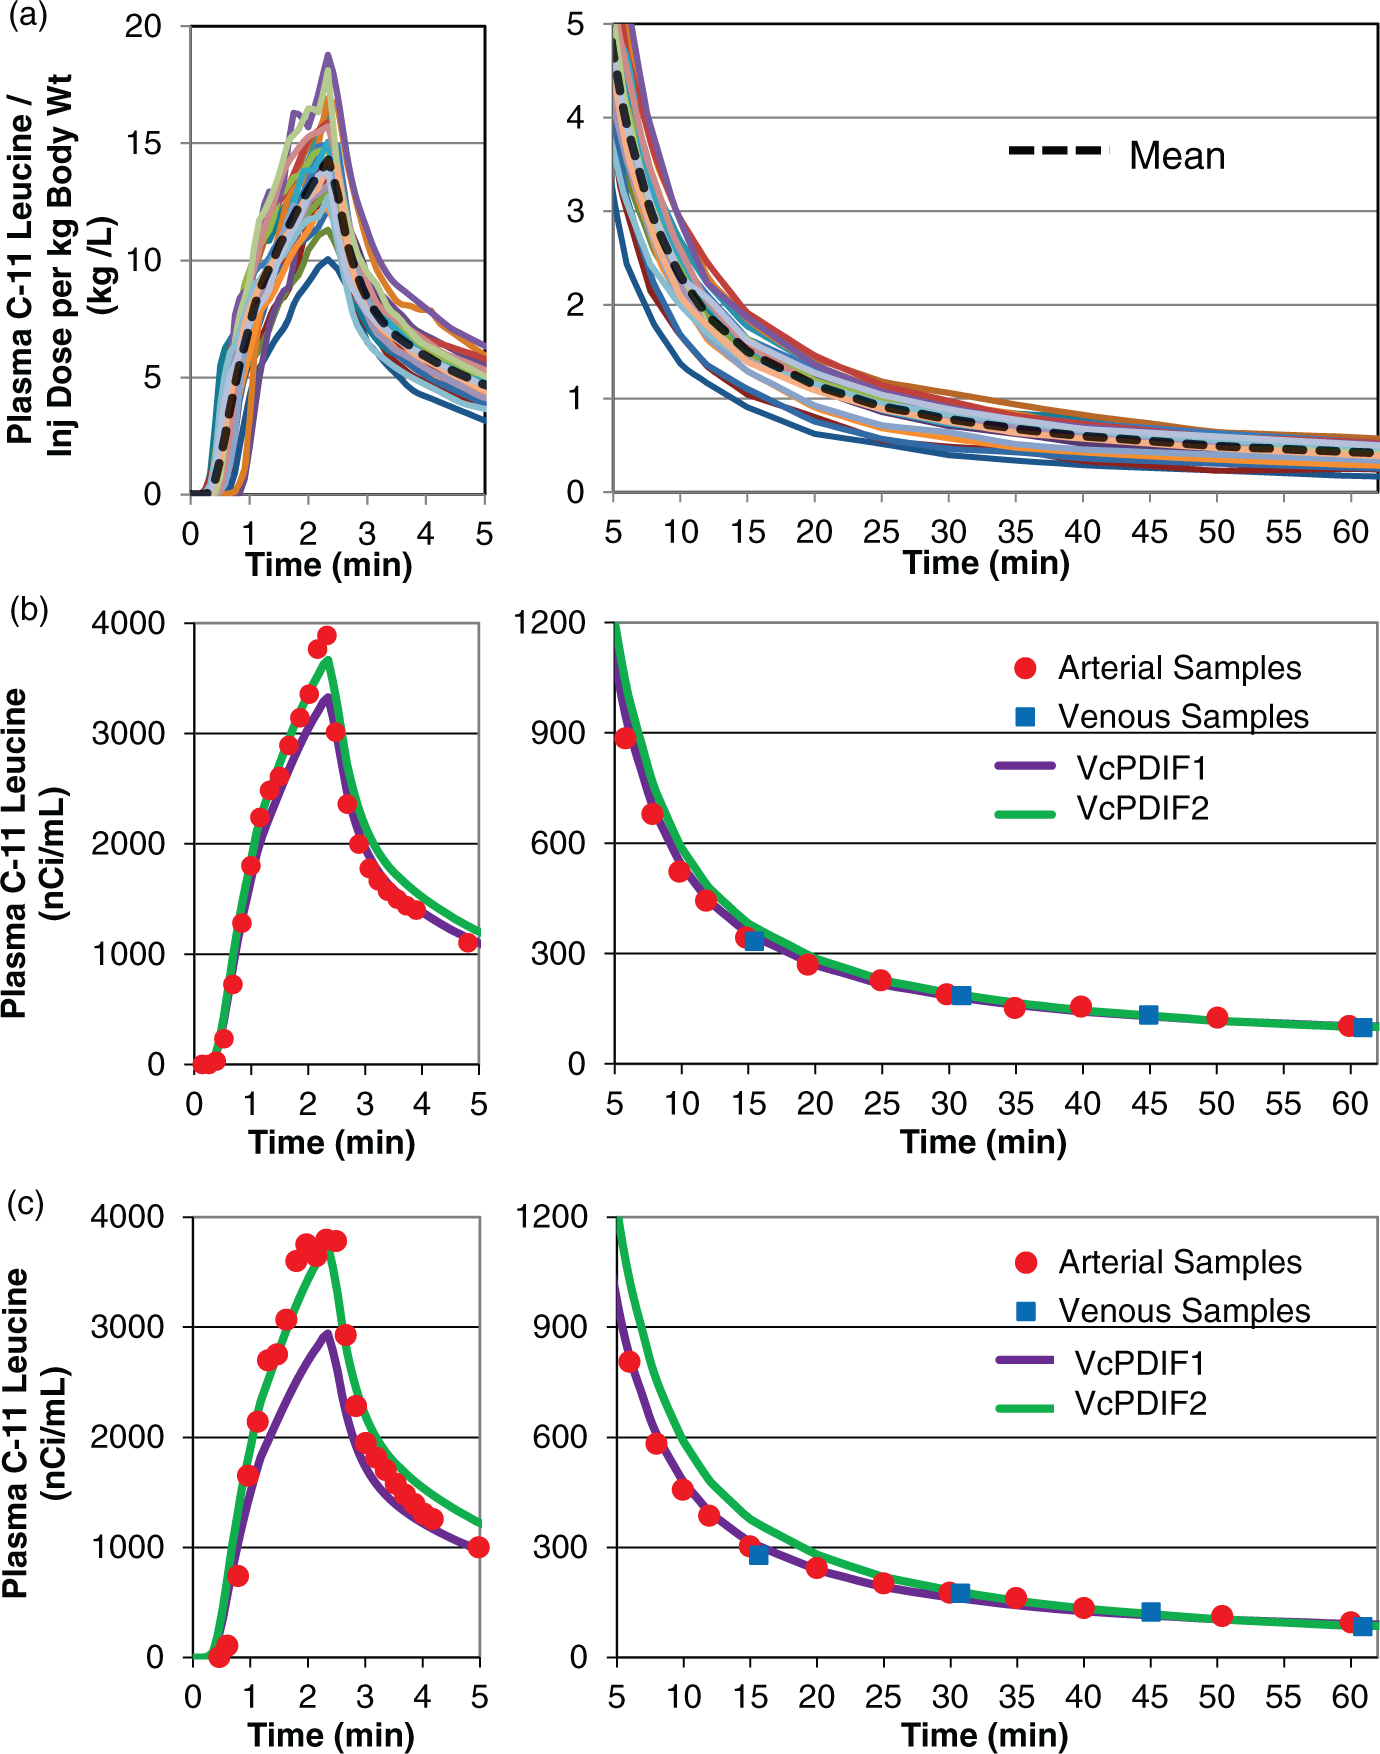
The first step is to scale the PDIF functions describing arterial plasma [11C]leucine concentration, Cp*
PDIF
(t), and arterial blood total 11C concentration, Cb*
PDIF
(t). Each is multiplied by the individual test subject’s injected dose per kg body weight (S)

We now have the scaled PDIF functions SCp* PDIF (t) and SCb* PDIF (t).
The second step is to examine the relationship between the test subject’s measured venous plasma [11C]leucine concentrations, i.e. Cpv*(ti), and the scaled population arterial plasma [11C]leucine concentration, i.e. SCp*
PDIF
(t). This is done by calculating their ratio (ri)


The third step is to repeat Step 2 with the venous samples of blood total 11C concentration, Cbv*(ti), and the scaled population arterial blood total 11C concentration, i.e. SCb* PDIF (t), to estimate the venous-calibrated PDIF of arterial blood total 11C concentration denoted by Cb* VcPDIF (t).
The fourth step is to use the population average ratio of 11CO2 to the total 11C concentration in blood to estimate the test subject’s 11CO2 concentration in blood, denoted by CCO2*
VcPDIF
(t)

Plasma leucine concentration
In addition to the rate constants estimated with the venous-calibrated PDIFs, an estimate of the arterial plasma leucine concentration, i.e. Cp, is required for determining rCPS (equation (3); Flowchart in Supplemental Figure 3). As an estimate of Cp, the time-weighted average of the measured concentrations of unlabeled leucine in all venous plasma samples of the test subject, including the control sample taken prior to tracer injection, was used.
Concentration of 11C and 11CO2 in whole blood. (a) Measured arterial whole blood total 11C concentrations in 25 healthy control subjects in Group 1, normalized (divided by) injected dose of L-[1-11C]leucine/kg body weight. Solid lines represent individual subjects. Dashed black line is the mean value for the group, i.e. the PDIF Cb*
PDIF
(t). Individual subjects’ curves were time shifted so that the peak arterial plasma concentration of [11C]leucine occurs at 140 s. (b) Concentration of arterial blood 11CO2 as a fraction of the total concentration of 11C in arterial blood. This is the factor R*
PDIF
(t) of equation (4). (c, e) Measured arterial (red circles) and venous (blue squares) whole blood total 11C concentrations, VcPDIF1 (purple line), and VcPDIF2 (green line) for two subjects in Group 2 (HM7A and HM2A). Measured arterial and venous concentrations, as well as VcPDIF1 and VcPDIF2 have been multiplied by the estimated whole brain blood volume from BFM estimations using the respective input functions. In the subject shown in (c) estimated Vb was 0.05, 0.07, and 0.06 when determined with the arterial input function, VcPDIF1 and VcPDIF2, respectively. Corresponding estimates for the subject shown in (e) were 0.06, 0.13, 0.12, respectively. The higher estimated blood volumes for the inputs VcPDIF1 and VcPDIF2 result from a substantially underestimated whole blood concentrations Cb*
VcPDIF
1
(t) and Cb*
VcPDIF
2
(t) during the initial part of the study; the products VbCb*
VcPDIF
(t) VbCb*
VcPDIF
(t) and VbCb*(t), however, are very similar. These products represent the activity in the region that is intravascular. Also shown for scale is the whole brain TAC (solid blue line). (d,f) Concentration of whole blood 11CO2, i.e. CCO2*
VcPDIF
(t), determined by VcPDIF1 (purple line) and VcPDIF2 (green line) for two subjects in Group 2 (HM7A and HM2A). These concentrations have been multiplied by the brain:blood equilibrium distribution volume of 11CO2, VD, whose value was fixed at 0.41 as measured in rhesus monkeys.
24
The products VDCCO2*
VcPDIF
1
(t), VDCCO2*
VcPDIF
2
(t) and VDCCO2*(t) represent the activity in the region that is in the form of 11CO2. The whole brain TAC is shown for scale (solid blue line).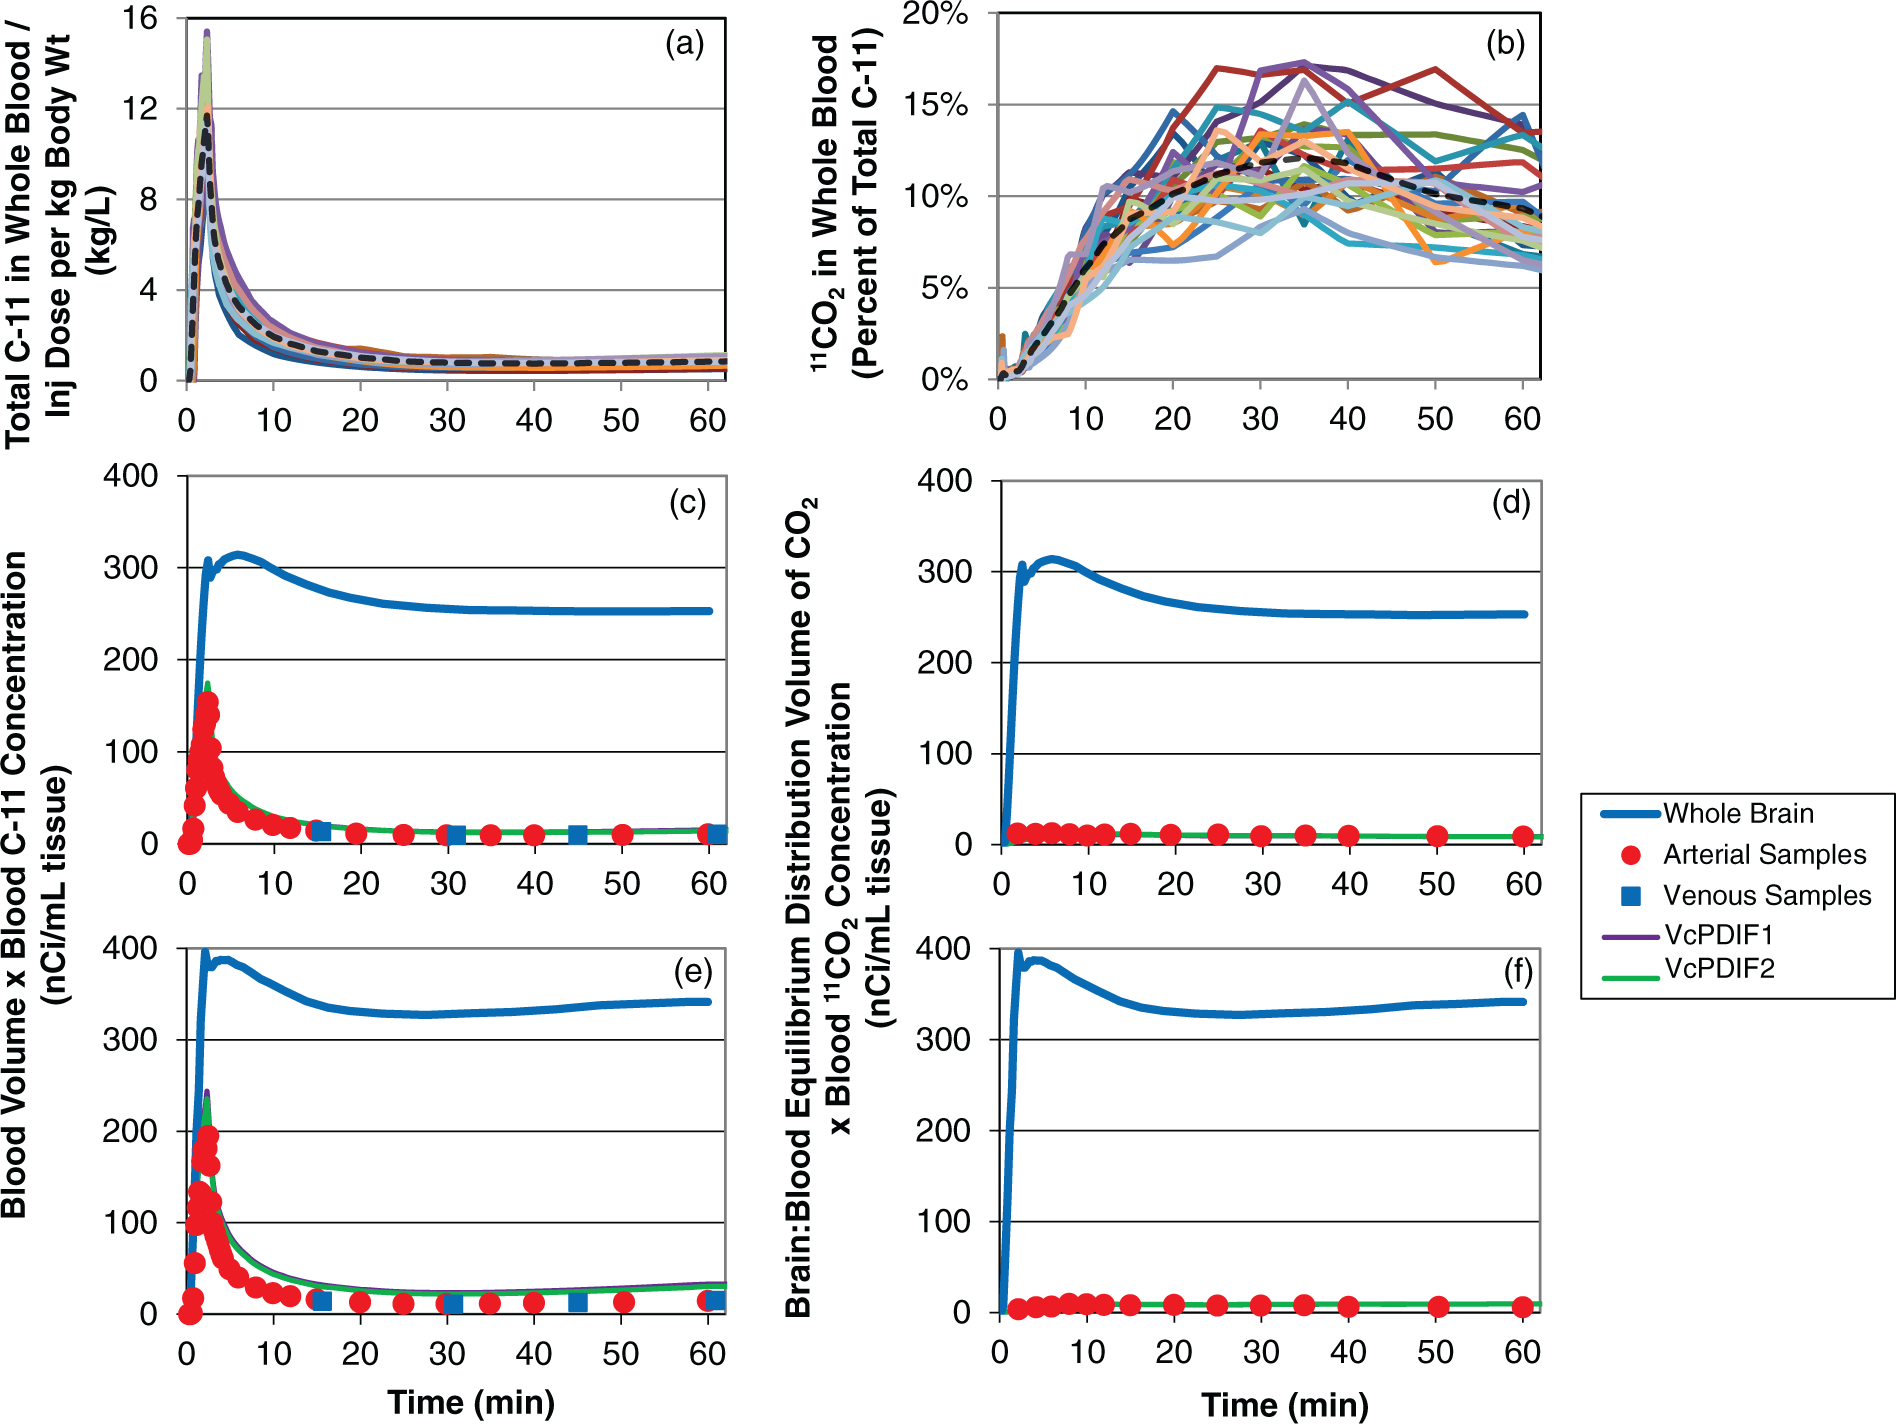
ROI definition
All subjects underwent a T1-weighted MRI of the brain for region of interest (ROI) placement. ROIs were placed on each subject’s MRI by visually identifying anatomic landmarks, manually outlining the region, and constructing a binary mask to identify voxels in the region. Nine ROIs and whole brain were analyzed for each subject. To coregister the MRI and PET images, a three-dimensional volume was constructed from the average of the emission data acquired between 30 and 60 min. This volume was isotropically smoothed with a Gaussian filter (FWHM 3 mm) and aligned to the MRI volume by use of the flexible image registration toolbox 34 with a 3D rigid body transformation. The resliced average 30- to 60-min PET image was visually reviewed for correct alignment with the MRI by use of Vinci software (Volume Imaging in Neurological Research, Max-Planck-Institute for Neurological Research, Cologne, Germany). The transformation parameters were then applied to each frame of the PET study (without prior smoothing) to effect their alignment with the MRI volume. After the PET data had been resliced to match the MRI, kinetic model parameters and rCPS were estimated for each voxel within the brain.
Rate constant estimation
For each test subject, the rate constants (K1, k2 + k3, k4) and the blood volume (Vb) were estimated at the voxel level using the basis function method (BFM) 16 as modified.21,22 BFM utilizes the kinetic model described above which assumes that the region under analysis is kinetically homogeneous. While kinetic heterogeneity is present in at least some voxels in high-resolution L-[1-11C]leucine PET data, 22 its impact on calculated rCPS is negligible under the conditions of our study. 21 The first 60 min of emission data, i.e. 36 frames of data, were utilized in the estimations. 23 VD in equation (1) was fixed at the value of 0.41 measured in rhesus monkeys, 24 which is in agreement with the mean whole brain:plasma equilibrium distribution volume determined from 11CO2 studies in humans. 25 The blood:plasma equilibrium distribution volume is close to unity. 26 The basic idea of BFM is that, if the sum of the parameters β = k2 + k3 + k4 were known, equation (2) would be linear in the coefficients; these coefficients could be quickly calculated using standard weighted linear least squares. For each β, the linear coefficients of equation (2) were estimated and the corresponding weighted residual sum of squares (WRSS) was computed. The value of β and the coefficients at which WRSS is minimal were then used to compute the model parameters. One hundred values equally spaced between βmin = 0.0001 min−1 and βmax = 0.5 min−1 were used as the grid for β, as in Tomasi et al., 16 as this widely covers the range of physiologic values expected for k2 + k3 + k4. 17
Estimates of the rate constants and rCPS for each ROI were computed by averaging voxel-wise estimates over all voxels in the ROI. rCPS values obtained for each subject and ROI from equation (3) were determined with the measured arterial input functions and with the venous calibrated PDIFs. With VcPDIFs, the time-weighted average of the measured concentrations of unlabeled leucine in all venous plasma samples of the test subject, including the control sample, was used as an estimate of Cp. Rates of cerebral protein synthesis determined with arterial functions were regarded as the “gold standard” against which rCPS determined with venous-calibrated PDIFs were compared.
Statistical analyses
We tested for effects of input function method on computed rCPS by means of repeated measures (RMs) ANOVA with RM on both regions and input function method. Each group/condition was examined separately. In the case of a statistically significant interaction, we further probed for differences by means of paired t-tests with rCPS computed from the measured arterial input function as the “control” and Dunnett’s correction for multiple comparisons. We used SPSS, Version 21 (IBM, Armonk, NY, USA) for all statistical analyses.
Results
PDIFs
Time courses of arterial plasma [11C]leucine concentrations, normalized by injected dose per kg body weight, for the 25 subjects in Group 1 are shown in Figure 2(a). Individual time courses have been time-shifted so that the peak concentration occurs at 140 s. Also shown is the mean of the 25 individual time courses, which is the PDIF for arterial plasma [11C]leucine concentration, i.e. Cp* PDIF (t).
Individual time courses of blood total 11C concentrations and the fraction of total 11C in blood that is in the form of 11CO2 are shown in Figure 3(a) and (b). The means of these time courses are Cb* PDIF (t) and R* PDIF (t), respectively.
Comparison of arterial and venous blood samples
Concentration difference between arterial and venous blood samples. a
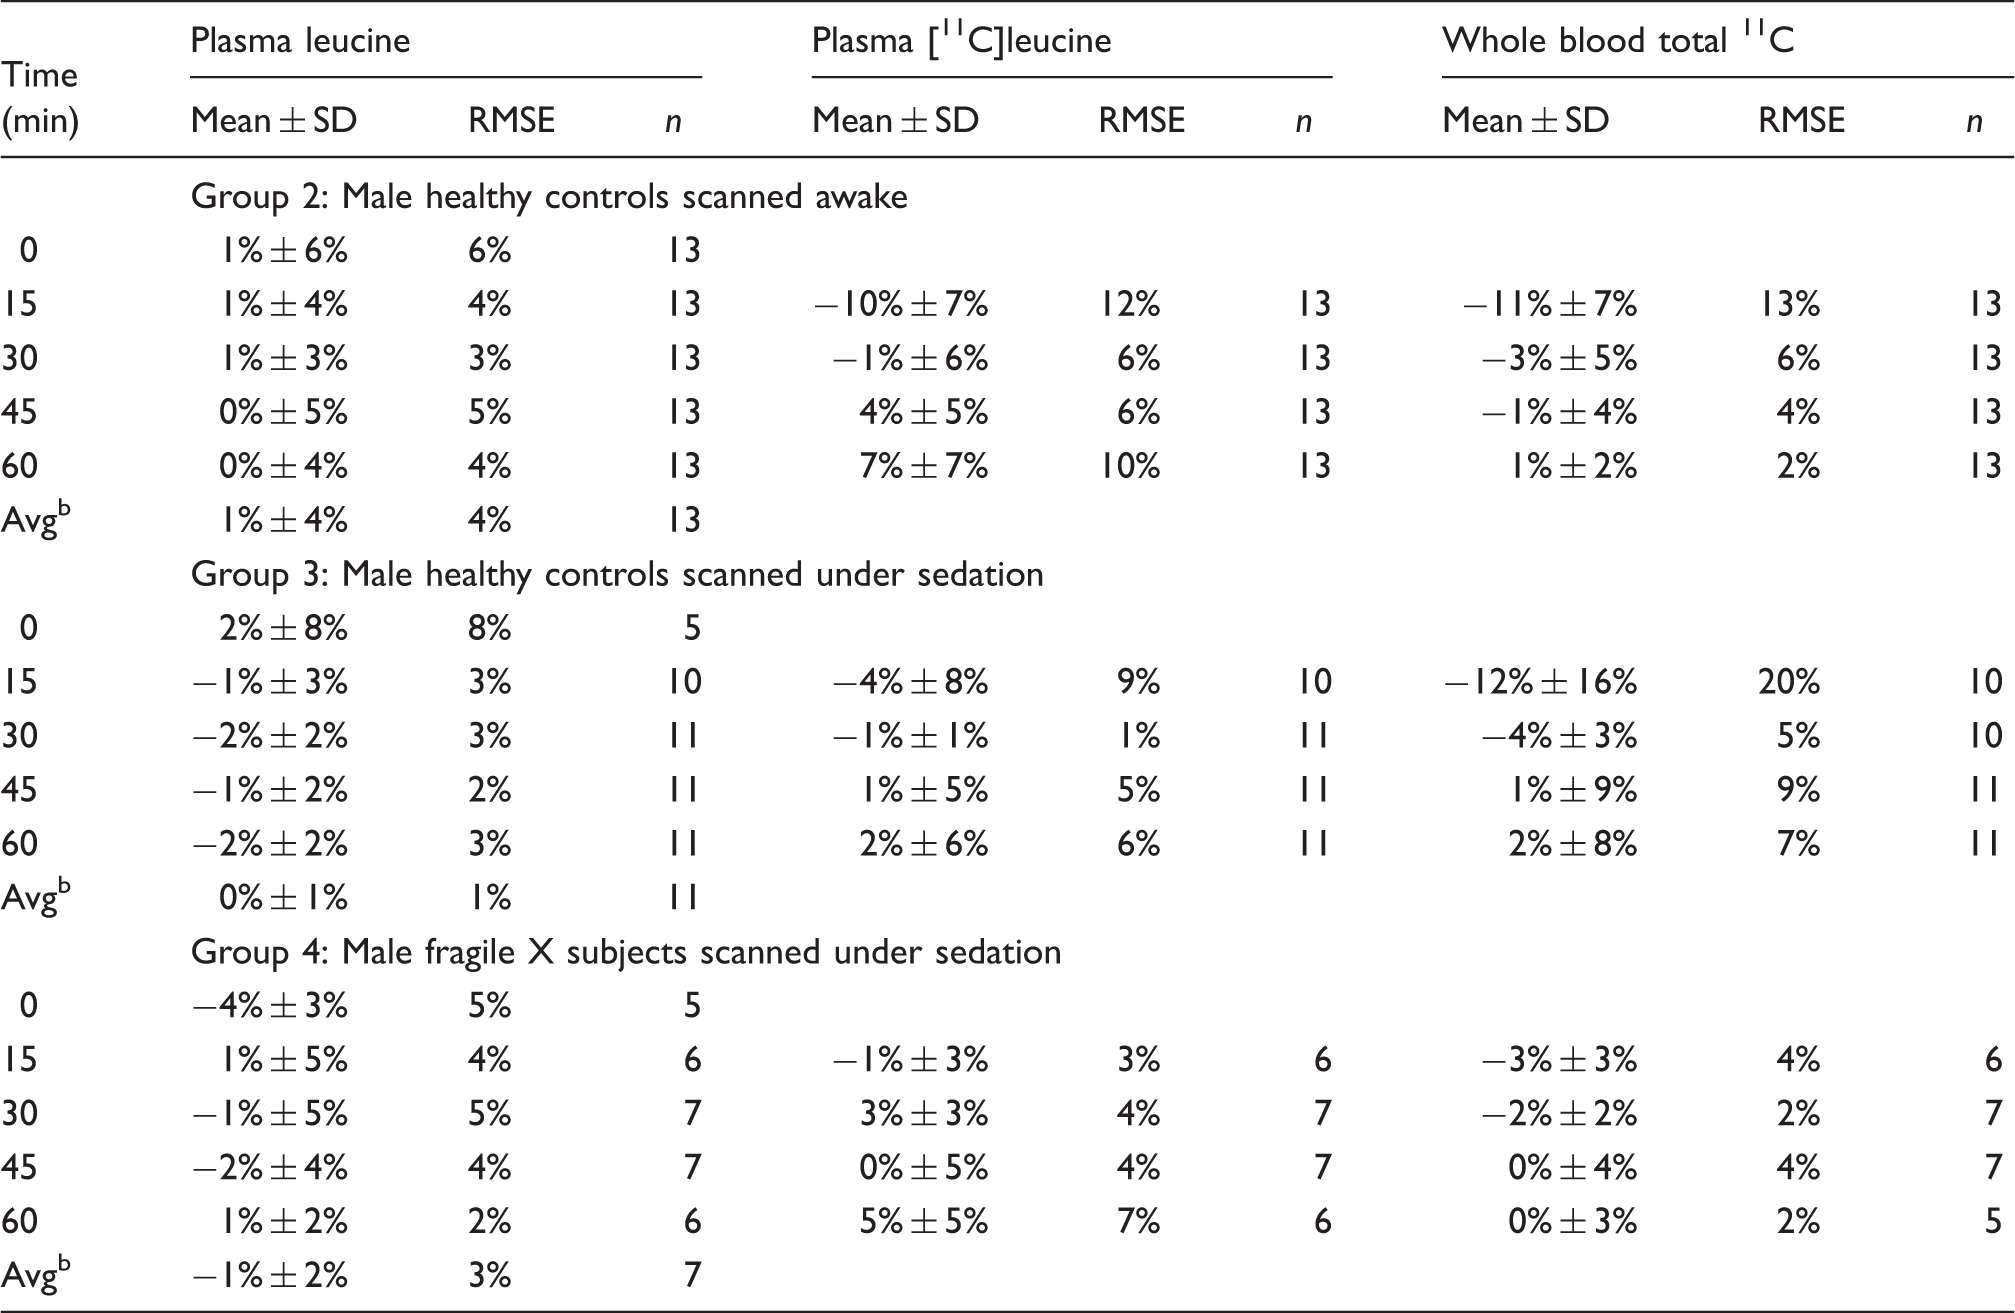
RMSE: root mean squared error.
Mean ± SD of individual subjects' [(Venous conc. – Arterial conc.)/Arterial conc.] × 100%
Time-weighted average, 0–60 min.
In all groups, we found excellent agreement between the time-weighted mean arterial and venous plasma concentrations of leucine (root mean squared error (RMSE) <5%). We also found very good agreement between arterial plasma concentrations of [11C]leucine and venous samples acquired at 15, 30, 45, and 60 min in the sedated groups (Groups 3, 4) (RMSE < 10%). In the awake subjects (Group 2), there was very good agreement between arterial plasma concentrations of [11C]leucine and venous samples acquired at 30, 45, and 60 min (RMSE < 10%), but somewhat higher error in the 15 min samples (RMSE 12%). Agreement between arterial and venous blood total 11C concentration at 15, 30, 45, and 60 min was excellent in Group 4 (RMSE < 5%) and good at 30, 45, and 60 min in Groups 2 and 3 (RMSE < 10%). Errors in the 15 min venous sample concentrations of blood total 11C were somewhat higher in Groups 2 and 3 (RMSE of 13% and 20%, respectively).
Venous-calibrated PDIFs
Because of relatively worse agreement between arterial and venous [11C]leucine in plasma and total 11C in blood in the 15-min samples in Group 2, we considered two venous-calibrated PDIFs. VcPDIF1 utilized venous samples taken 15, 30, 45 and 60 min after tracer injection to calibrate the PDIFs; VcPDIF2 utilized the 30, 45 and 60 min venous samples. Plasma [11C]leucine concentrations for two subjects from Group 2 are illustrated in Figure 2(b) and (c). Shown are measured arterial and venous plasma samples along with the VcPDIF1 and VcPDIF2 functions. In the first subject (Figure 2(b)), differences between arterial and venous samples of plasma [11C]leucine concentrations were <1%, 2%, −3%, and −6%, respectively, at 15, 30, 45, and 60 min. Both VcPDIF1 and VcPDIF2 showed good agreement with measured arterial samples, and rCPS determined with VcPDIF1 and VcPDIF2 also showed good agreement with rCPS determined with the arterial input function. In the second subject (Figure 2(c)), differences between arterial and venous samples in plasma [11C]leucine concentrations were −6%, <1%, <1%, −12%, respectively, at 15, 30, 45, and 60 min. Due to the low venous sample plasma [11C]leucine concentration at 15 min, VcPDIF1 substantially underestimates the arterial curve in the crucial first few minutes around the peak and, as a consequence, rCPS determined with VcPDIF1 is 14% higher in whole brain than rCPS determined with the measured arterial input function. With VcPDIF2, the 15-min sample was not used in calibrating the PDIFs and we found better agreement with measured arterial samples in the initial minutes of the study. Between ∼3 and 30 min, however, VcPDIF2 is somewhat higher than the measured arterial samples, yet rCPS determined with VcPDIF2 is in excellent agreement with that determined with the measured arterial input function. This suggests that rCPS estimation may be less sensitive to errors in the input function during this interval, or, conversely, accuracy of the input function for determination of rCPS is likely to be more critical around the time of peak plasma tracer concentration and in the latter half of the scan.
Graphs of blood total 11C and blood 11CO2 are shown in Figure 3. Subjects are the same as in the previous figure. Concentrations 11C in blood (Figure 3(c) and (e)) have been multiplied by blood volume, Vb; the product VbCb*(t) represents activity in blood in the volume under examination. Concentrations of 11CO2 (Figure 3(d) and (f)) have been multiplied by the brain:blood equilibrium distribution volume of 11CO2, VD; the product VDCc*(t) represents extravascular 11CO2 in the tissue. Also shown in these graphs are the measured whole brain TACs to illustrate the relatively small magnitude of the vascular 11C and extravascular 11CO2 terms compared to the total 11C measured in the brain region. The estimation process is not very sensitive to errors in these terms due to their relatively small contribution to the total 11C. In the first subject (Figure 3(c) and (d)), differences between arterial and venous samples of total 11C in blood were −3% at 15 min and <1% in absolute value at 30, 45, and 60 min. Whole brain Vb was 0.05, 0.07, and 0.06 when estimated with the arterial input function, VcPDIF1 and VcPDIF2, respectively. Contributions to these factors to total activity in brain by VcPDIF1 and VcPDIF2 showed good agreement with that of the measured arterial samples. In the second subject (Figure 3(e) and (f)), the difference between arterial and venous samples of blood total 11C was −8% and −4%, respectively, at 15 and 30 min, and <1% in absolute value at 45 and 60 min. As a consequence of the lower values in the venous samples of the blood total 11C at 15 and 30 min, the VcPDIF1 and VcPDIF2 input functions were substantially underestimated in the first half of the study. This was reflected in the estimates of whole brain Vb which were 0.06, 0.13, and 0.12 when estimated with the arterial input function, VcPDIF1 and VcPDIF2, respectively. In the first several minutes of the scan, the contribution of the activity in blood to total activity in whole brain, however, was very similar with all input functions. Although activity in the blood after the initial peak, and of 11CO2 in the tissue, was somewhat overestimated when the venous-calibrated PDIFs were used, their contribution to total activity in brain remained small.
Rates of cerebral protein synthesis
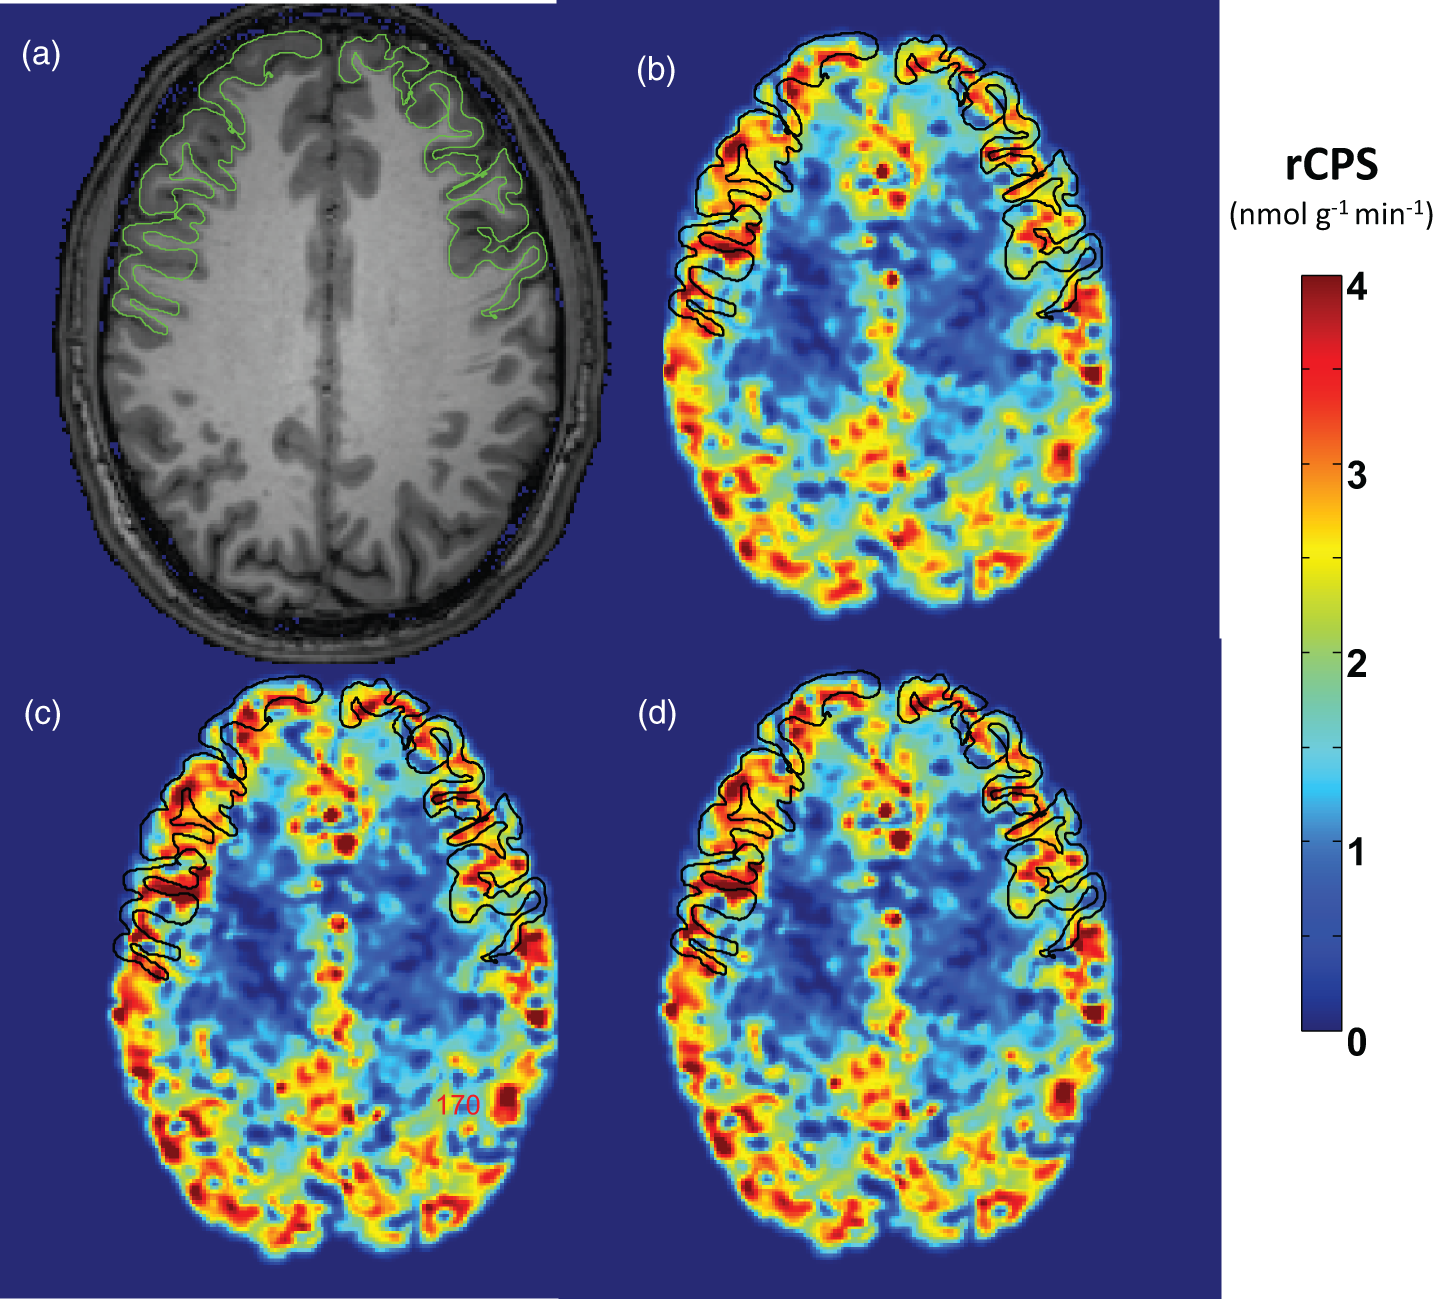
To assess how the input functions VcPDIF1 and VcPDIF2 affect calculated rates of cerebral protein synthesis, we compared rCPS in whole brain and nine regions computed with measured arterial input functions with those computed with the two venous-calibrated PDIFs (VcPDIF1 and VcPDIF2) in subject Groups 2–4. With both venous-calibrated PDIFs, mean venous plasma concentration of leucine in the individual subject was used as a substitute for that subject’s mean arterial plasma concentration in the computation of rCPS. Results are shown in Figure 4 and in Supplemental Table. Kinetic model parameters and rCPS estimated in individual subjects are provided as Supplemental Data. Figure 5 illustrates parametric images of rCPS determined with each of the input functions for a healthy male subject scanned awake.
Effects of input function used on computed values of rCPS in whole brain and nine regions. We compared two venous-calibrated PDIFs (VcPDIF1 and VcPDIF2) with arterial input functions in three groups of subjects. VcPDIF1 utilized venous samples taken 15, 30, 45 and 60 min after tracer injection to calibrate the PDIFs; VcPDIF2 utilized 30, 45 and 60 min venous samples for calibration. Both venous-calibrated PDIFs were used together with the individual subjects’ measured venous plasma concentration of unlabeled leucine for determination of rCPS. WB: whole brain; Fcx: frontal cortex; Ccx: cingulate cortex; Pcx: parietal cortex; Cau: caudate; Pu: putamen; Th: thalamus; Hi: hippocampus; Am: amygdala; CR: corona radiata. Points represent means ± SDs for 13 healthy control subjects studied awake, 10 healthy control subjects studied sedated with dexmedetomidine, and 5 FrX subjects studied sedated with dexmedetomidine. Estimates of each parameter were analyzed for statistically significant effects by means of RM ANOVA with region and input function as within-subjects variables. (a) Awake healthy controls. The region × input function interaction (F2,25 = 2.08, P = 0.029) was statistically significant. Post hoc t-tests indicate that in all regions, rCPS computed with the VcPDIF1 was statistically significantly higher than computed with arterial input function (P < 0.05). There were no statistically significant differences between rCPS computed with VcPDIF2 and the arterial input function. (b) Sedated healthy controls. The region × input function interaction (F4,35 = 0.763, P = 0.555) was not statistically significant, neither was the main effect of input function (F2,35 = 0.763, P = 0.231). (c) Sedated fragile X subjects. Neither the region × input function interaction (F2,8 = 1.80, P = 0.227) nor the main effect of input function (F1,8 = 1.74, P = 0.247) were statistically significant. As expected, in all groups, the main effect of region was statistically significant. Effects of input function on computed values of rCPS in a healthy 23-year-old male scanned while awake. The injected dose of L-[1-11C]leucine was 25 mCi (0.30 mCi/kg) (a) MRI; (b) rCPS computed with the measured arterial input function; (c) rCPS computed with the venous-calibrated population-derived input function that utilizes 15, 30, 45 and 60 min venous samples for calibration together this subject’s measured venous plasma leucine concentration; (d) rCPS computed with the venous-calibrated population-derived input function that utilizes 30, 45 and 60 min venous samples for calibration together this subject’s measured venous plasma leucine concentration. Images are in the transverse plane and the frontal cortex is outlined. Images of rCPS computed with the venous-calibrated population-derived input functions (c, d) are almost indistinguishable from the rCPS image determined from the measured arterial input function (b).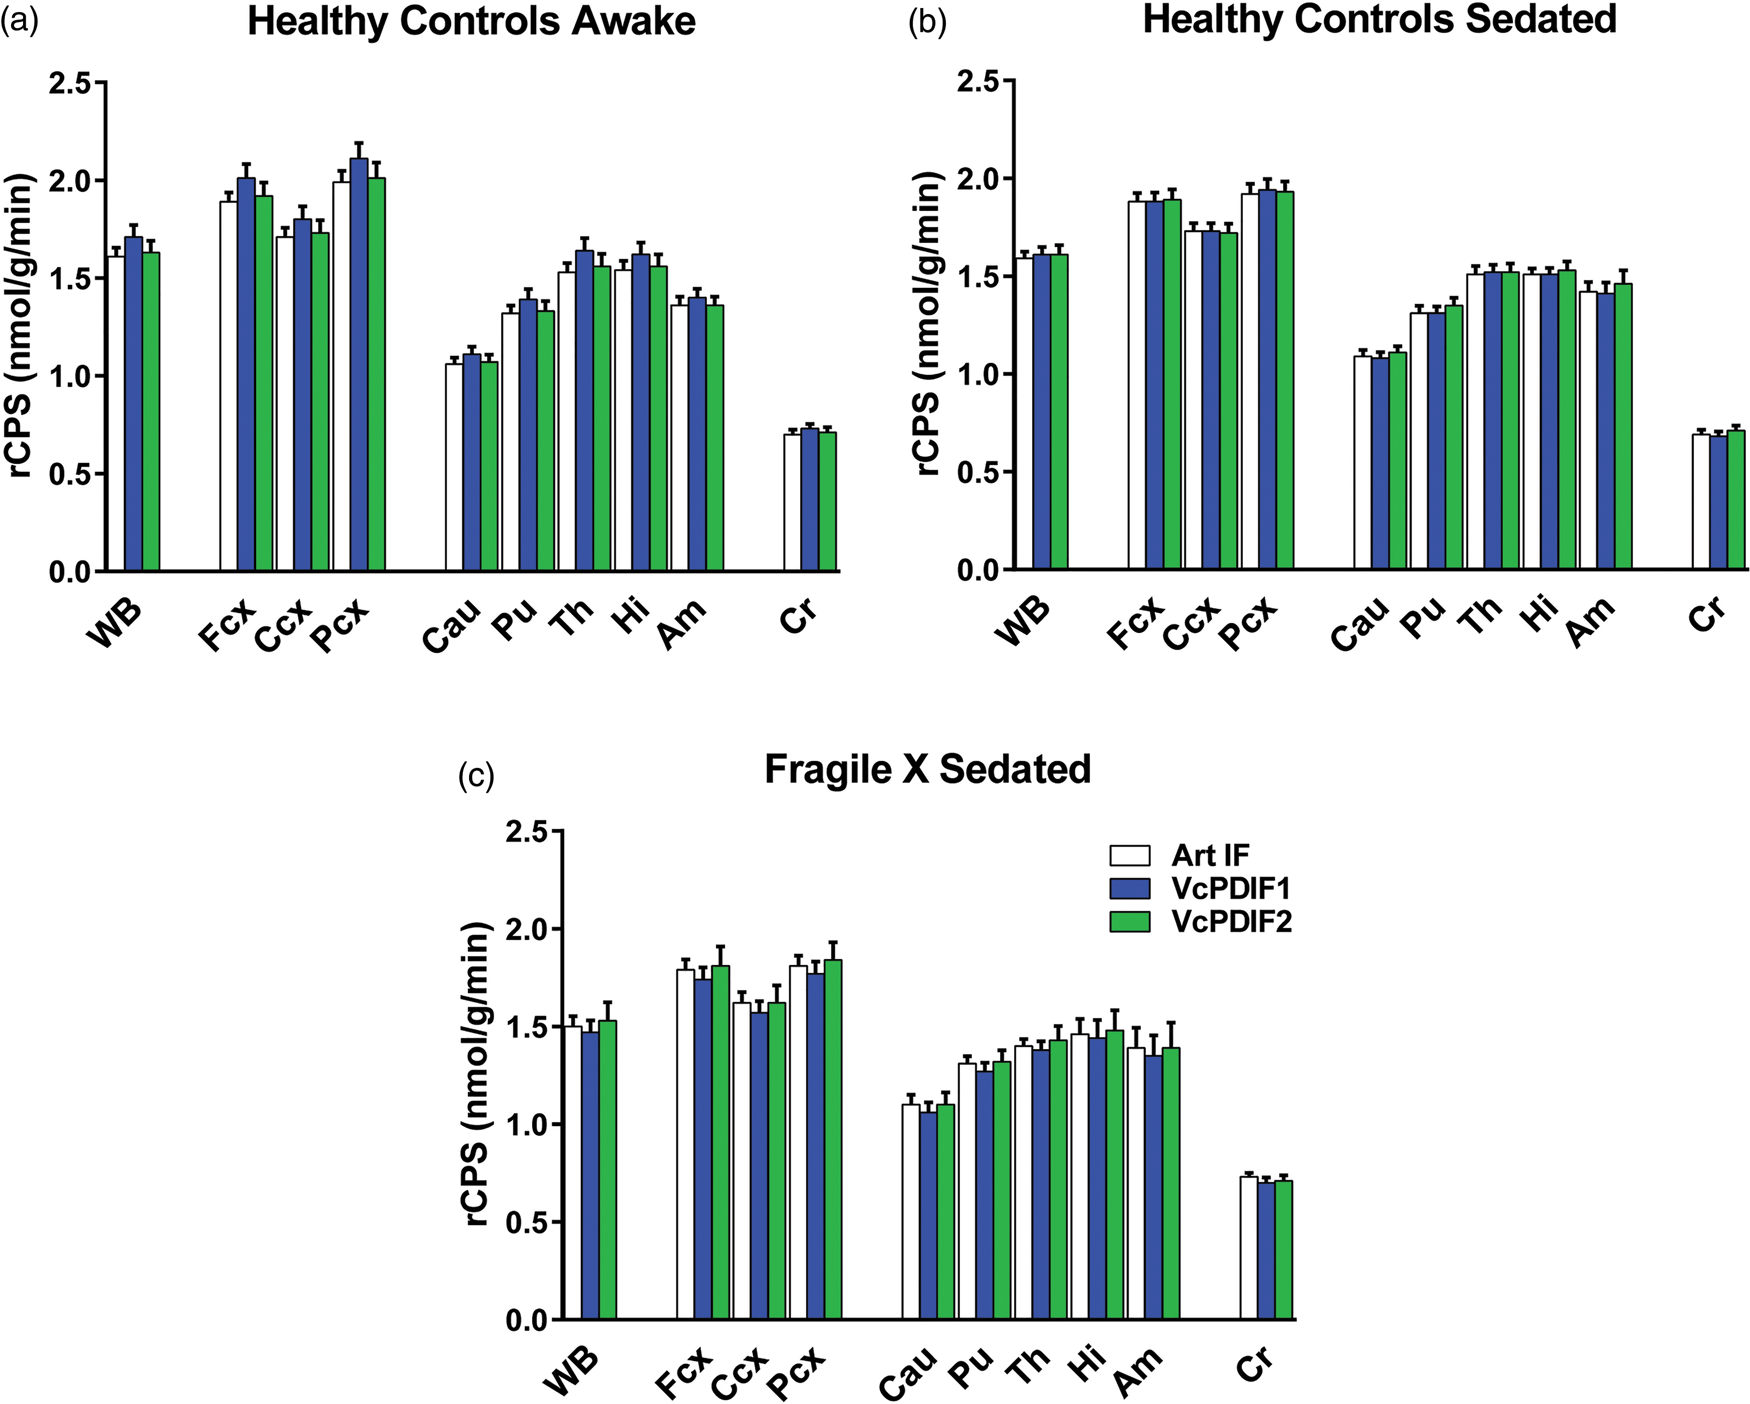
In general, there was good agreement between rCPS determined with the arterial input functions and with the two venous-calibrated PDIFs (Supplemental Table). In Group 2, awake healthy control subjects, RMSE in rCPS ranged from 7–11% in the regions evaluated when determined with VcPDIF1. This was the poorest agreement among the comparisons made. In Group 2, RMSE was smaller (6–9%) when determined with VcPDIF2. In the sedated healthy control subjects of Group 3, RMSE was 6–7% and 4–9% when determined with VcPDIF1 and VcPDIF2, respectively. In the sedated fragile X subjects of Group 4, the corresponding RMSEs were 3–5% and 4–6%.
In the awake group, rCPS determined with both VcPDIF1 and VcPDIF2 tended to have somewhat higher inter-subject variability than rCPS determined with the measured arterial input function. The coefficient of variation in whole brain and cortical regions, for example, was about 10% when determined with the arterial input function, and 13–14% when determined with VcPDIF1 and VcPDIF2 (Supplemental Table). This effect was smaller in the sedated groups.
Estimates of rCPS were analyzed for statistically significant effects by means of RM ANOVA with region and input function as within-subjects variables. In awake healthy controls (Group 2), the region × input function interaction (F2,25 = 2.08, P = 0.029) was statistically significant. Post hoc t-tests indicate that in all regions rCPS computed with VcPDIF1 was statistically significantly higher than rCPS computed with the measured arterial input function (P < 0.05). There were no statistically significant differences between rCPS computed with VcPDIF2 and the arterial input function. In the sedated healthy controls (Group 3), the region × input function interaction (F4,35 = 0.763, P = 0.555) was not statistically significant, neither was the main effect of input function (F2,35 = 0.763, P = 0.231). In the sedated fragile X subjects (Group 4), neither the region × input function interaction (F2,8 = 1.80, P = 0.227) nor the main effect of input function (F1,8 = 1.74, P = 0.247) was statistically significant. As expected, in all groups, the main effect of region was statistically significant.
Discussion
We present here validation of venous-calibrated PDIFs for determination of rCPS with L-[1-11C]leucine PET in young adult males. These results, coupled with our earlier study which validated use of a shorter scan duration, 23 expand the utility of this PET method to the study of subjects who previously could only undergo the procedure under sedation. This is a significant advance for the study of protein synthesis in patients with intellectual disabilities. Dysregulation of protein synthesis in neural tissue is implicated in several neurodevelopmental disorders in which intellectual disability is a major symptom. Examples include fragile X syndrome, tuberous sclerosis, and mutations in the phosphatase and tensin homolog (PTEN) gene. It has also been suggested that dysregulation of protein synthesis may be a core phenotype in idiopathic forms of autism. 27 Measurements of rCPS in patients with these diseases would help to identify the relevance of protein synthesis dysregulation as a core phenotype, form the basis for novel treatment strategies, and might be used to monitor treatment efficacy in research studies.
Measurements of rCPS in studies of awake age-matched healthy young men with the L-[1-11C]leucine PET method are reproducible and have low variability. 17 In healthy young men, rCPS is also unaffected by propofol anesthesia. 28 This latter finding had suggested that subjects unable to tolerate the PET scanning procedures while awake, such as those with neurodegenerative or neurodevelopmental disorders, could be studied under sedation. The sedative agent, however, can have an effect on rCPS in the patient group different from that seen in healthy controls. 29 We have now pursued an alternative strategy to increase the likelihood that patients can tolerate scanning without sedation: reducing the total time required for scanning and eliminating the need for arterial blood sampling. The L-[1-11C]leucine PET method as originally described and validated was based on a 90-min scanning interval, 24 and we have demonstrated that the scanning interval can be reduced to 60 min without loss of precision in rCPS determinations. 23 In the present study, we have validated a method to eliminate arterial blood sampling and utilize instead a limited number of venous samples for the determination of rCPS.
In the case of the L-[1-11C]leucine PET method, arterial blood samples were required to determine the input functions plasma [11C]leucine, blood total 11C, and blood 11CO2 concentration TACs. In addition, the arterial plasma leucine concentration was needed to determine rCPS. In the present study, we compared measurements in sampled blood from the radial artery of the non-dominant arm and from intravenous lines placed in the contralateral antecubital fossa. In general, arterial and venous samples agreed very well except for the 15 min samples of plasma [11C]leucine concentration and blood total 11C in the healthy control groups. The reason for higher errors in the venous samples acquired at 15 min in these two groups is unclear, and further data are needed to ascertain whether our findings were due to measurement error or a true difference in arterial and venous concentrations at that time point. With the possible exception of samples acquired at 15 min, however, these data support the use of venous samples to calibrate PDIFs and to compute rCPS.
We generated PDIFs from a group of heathy male young men who were scanned in the awake state, and tested the efficacy of using the venous-calibrated PDIFs for determining rCPS in three additional groups of subjects. The population group and the three test groups were all male and matched for age, but not for state (awake or sedated) or diagnosis (healthy control or fragile X syndrome). Despite differences in diagnoses and states, rCPS determined in the test groups with PDIFs calibrated with venous samples drawn between 30 and 60 min agreed well with rCPS determined with the measured arterial input functions. To date, we do not have sufficient data in young female subjects to determine whether the population input functions from male subjects can be utilized. Nor do we have data in older subjects or data acquired following different tracer administration protocols to examine population input functions in these groups. Clearly, before applying this method to measuring rCPS without arterial sampling, population input functions relevant to the group under study must be validated. We further note that the method developed for L-[1-11C]leucine does not apply to other PET tracers that have different relationships between the arterial and venous time courses, e.g. time to reach arteriovenous equilibrium or significant metabolism of the tracer in tissue of the arm and hand.
Finally, in the current study in which we had both arterial and venous blood samples, we noted that there were some sporadic venous samples in which the plasma [11C]leucine concentration differed more than usual from the arterial value. The arterial concentration in these cases was consistent with the more densely sampled arterial curve, so the larger difference was more likely due to some unknown sampling or measurement error in the venous sample. Nevertheless, we used all venous samples in our data analyses since the errors would not have been apparent without the complete arterial data. More frequently sampled venous data and/or use of replicate measurements would lessen the impact of erroneous venous data points in calibrating the PDIFs.
We conclude that PDIFs, calibrated by venous samples taken between 30 and 60 min, together with venous plasma leucine concentration measurements in each individual subject, can be used in place of measured arterial input functions for determination of rCPS with the L-[1-11C]leucine PET method in young adult males. Because of sensitivity of venous-calibrated PDIFs to errors in venous measurements, we would recommend that the number of venous samples in this interval be increased and/or replicate measurements be considered in future studies.
Supplemental Material
Supplemental material for Substitution of venous for arterial blood sampling in the determination of regional rates of cerebral protein synthesis with L-[1-11C]leucine PET: A validation study
Supplemental material for Substitution of venous for arterial blood sampling in the determination of regional rates of cerebral protein synthesis with L-[1-11C]leucine PET: A validation study by Giampaolo Tomasi, Mattia Veronese, Alessandra Bertoldo, Carolyn B Smith and Kathleen C Schmidt in Journal of Cerebral Blood Flow & Metabolism
Supplemental Material
Supplementary Table -Supplemental material for Substitution of venous for arterial blood sampling in the determination of regional rates of cerebral protein synthesis with L-[1-11C]leucine PET: A validation study
Supplemental material, Supplementary Table for Substitution of venous for arterial blood sampling in the determination of regional rates of cerebral protein synthesis with L-[1-11C]leucine PET: A validation study by Giampaolo Tomasi, Mattia Veronese, Alessandra Bertoldo, Carolyn B Smith and Kathleen C Schmidt in Journal of Cerebral Blood Flow & Metabolism
Supplemental Material
Suppplementary Figures Flowcharts -Supplemental material for Substitution of venous for arterial blood sampling in the determination of regional rates of cerebral protein synthesis with L-[1-11C]leucine PET: A validation study
Supplemental material, Suppplementary Figures Flowcharts for Substitution of venous for arterial blood sampling in the determination of regional rates of cerebral protein synthesis with L-[1-11C]leucine PET: A validation study by Giampaolo Tomasi, Mattia Veronese, Alessandra Bertoldo, Carolyn B Smith and Kathleen C Schmidt in Journal of Cerebral Blood Flow & Metabolism
Footnotes
Funding
The author(s) disclosed receipt of the following financial support for the research, authorship, and/or publication of this article: This research was supported by the Intramural Research Program, National Institute of Mental Health and the research grant from the Wellcome Trust “Strategic Award: Inflammation in AD and MDD”. MV is also supported by the National Institute for Health Research (NIHR) Biomedical Research Centre at South London and Maudsley NHS Foundation Trust and King’s College London.
Declaration of conflicting interests
The author(s) declared no potential conflicts of interest with respect to the research, authorship, and/or publication of this article.
Authors’ contributions
GT, MV, AB, CBS and KCS made substantial contribution to the study design and data interpretation, and critically revised the article. GT, MV and KCS made substantial contribution to the data analysis. GT, CBS and KCS drafted the manuscript. All authors approved the final draft submitted for publication.
References
Supplementary Material
Please find the following supplemental material available below.
For Open Access articles published under a Creative Commons License, all supplemental material carries the same license as the article it is associated with.
For non-Open Access articles published, all supplemental material carries a non-exclusive license, and permission requests for re-use of supplemental material or any part of supplemental material shall be sent directly to the copyright owner as specified in the copyright notice associated with the article.