
Abstract
Measurements of regional rates of cerebral protein synthesis (rCPS) require correction for the effect of recycling of tissue amino acids back into the precursor pool for protein synthesis. The fraction of the precursor pool derived from arterial plasma, λ, can be evaluated as the steady-state ratio of the specific activity of leucine in the tissue tRNA-bound fraction to that in arterial plasma. While λ can be directly measured in terminal experiments in animals, an alternative method is required for use with PET. We report a method to estimate λ based on a kinetic model of labeled and unlabeled leucine and labeled CO2 in the tissue. The kinetic model is also used to estimate the amount of labeled protein and rCPS. We measured time courses of [14C]leucine, [14C]protein, and 14CO2 in the blood and brain of anesthetized rats and estimated parameters of the kinetic model from these data. Simulation studies based on the kinetic parameters were then performed to examine the feasibility of this approach for use with L-[1-11C]leucine and PET. λ and rCPS were estimated with low bias, which suggests that PET can be used for quantitative measurement of rCPS with L-[1-11C]leucine and a kinetic modeling approach for correction for recycling of tissue amino acids.
Introduction
Recycling of amino acids derived from protein breakdown in the tissue back into the precursor pool for protein synthesis complicates in vivo measurement of rates of incorporation of an amino acid into protein with a radiolabeled tracer amino acid. If plasma is the only source of the amino acid in the tissue, the integrated specific activity of the precursor amino acid in the tissue can be estimated from the measured time course of the amino acid in arterial plasma and a compartmental model of the behavior of the amino acid in the tissue. We have shown that, in brain, protein degradation in the tissue is also a significant source of amino acid (Smith et al, 1988; Smith and Kang, 2000). Even 60 mins after a bolus injection of a radiolabeled amino acid, the sizeable pool of tissue protein is largely unlabeled and amino acids derived from the steady-state breakdown of unlabeled protein are constantly diluting the specific activity of the precursor amino acid coming from plasma. We accounted for the effect of recycling in the autoradiographic L-[1-14C]leucine method for measurement of regional rates of cerebral protein synthesis (rCPS) by including in the operational equation a factor, λ, which is the fraction of the precursor pool for protein synthesis derived from arterial plasma; the remainder (1−λ) comes from recycling (Smith et al, 1988). In application of the autoradiographic method, λ must be evaluated in a separate series of animals by measurement of the ratio of the specific activity of leucine from the tissue tRNA-bound fraction to that of the arterial plasma under steady-state conditions for both labeled and unlabeled leucine. Adaptation of the leucine method for use with PET and L-[1-11C]leucine has been hindered by an inability to measure λ in a clinical setting. Additionally, to determine rCPS, one must be able to determine the amount of labeled protein formed during the experimental interval. In the quantitative autoradiographic L-[1-14C]leucine method, tissue sections are washed in formalin before autoradiography, thereby washing out free [14C]leucine and 14CO2 in the tissue and leaving only [14C]protein. Adaptation of the method for use with PET requires that [11C]protein be estimated from total activity measured by the PET scanner by correcting for the presence of [11C]leucine and 11CO2 in the tissue as well as 11C in blood in the brain. In the present study, we investigated the feasibility of using a kinetic modeling approach for determining λ and rCPS from the measured time courses of leucine and L-[1-11C]leucine in arterial plasma, total activity in whole blood, and total activity in brain regions after injection of L-[1-11C]leucine.
Theory
Kinetic Model for Leucine
The [14C]leucine method for measurement of rates of leucine incorporation into protein is based on a comprehensive kinetic model (Smith et al, 1988; Figure 1). The following assumptions apply: (1) The tissue region is homogeneous with respect to concentrations of amino acids, rates of blood flow, and rates of transport, metabolism, and incorporation of amino acids into protein. (2) The concentration of unlabeled leucine in arterial plasma and rates of amino-acid metabolism and protein synthesis are assumed constant during the experimental period. (3) There is no significant loss of label and no recycling of [14C]leucine from the radioactive protein within an experimental period of 60 mins. This is a reasonable assumption because the average half-life of protein in brain is several days (Lajtha et al, 1976). (4) Concentrations of labeled leucine are sufficiently small that tracer theory holds, and there are no isotope effects associated with its use. The model includes intracellular and extracellular spaces, intracellular compartmentation of free leucine, and admixture of unlabeled leucine released by protein breakdown with amino acids entering the tissue from plasma. In adult rat, it has been shown that there is sufficient admixture to dilute the specific activity of leucine entering the precursor pool in brain from plasma by approximately 40% (Smith et al, 1988). Methods to determine rates of cerebral amino-acid incorporation into protein in vivo with a tracer amino acid depend on estimation of precursor pool-specific activity from measurements in plasma and will underestimate the true rates unless this dilution is taken into account.
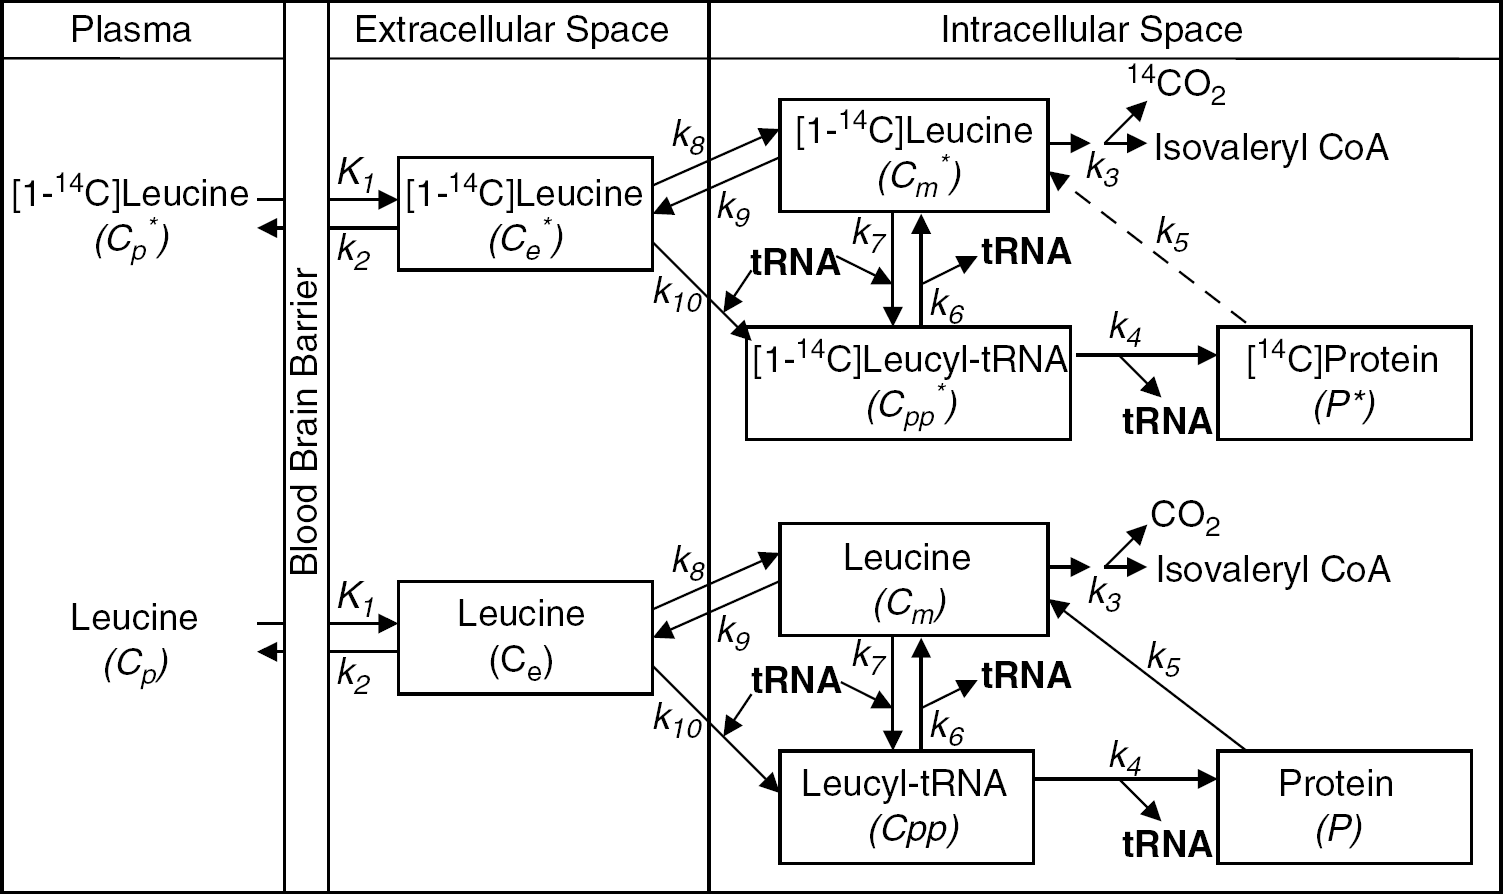
Comprehensive model of leucine in brain. Cp*, Ce*, and Cm* represent concentrations of 14C-labeled free leucine in plasma, extracellular space, and intracellular space, respectively, and Cp, Ce, and Cm represent their unlabeled counterparts. Cpp* represents the labeled intracellular precursor pool for protein synthesis, that is, [1-14C]leucyl-tRNA, and P* represents the pool of labeled leucine in cellular protein. Cpp and P are the corresponding unlabeled pools. The constants are: K1, for carrier-mediated transport of leucine from plasma to tissue; k2, for transport back from tissue to plasma; k3, for catabolism of leucine; k4, for leucine incorporation into protein; k5, for release of free leucine by protein degradation; k6, for deacylation of leucyl-tRNA; k7, for transfer of leucine from the intracellular leucine pool to precursor pool for protein synthesis; k8, for transport of leucine from extracellular space to intracellular leucine pool; k9, for transport of leucine from intracellular pool to extracellular space; and k10, for transport of leucine from extracellular space to intracellular precursor pool for protein synthesis. As the average half-life of proteins in brain is several days, it is assumed there is no significant loss of label and no recycling of [14C]leucine from the radioactive protein within an experimental period of 60 mins, that is, k5P*=0. Although the comprehensive model contains more parameters than can be reliably estimated, it provides a useful description of leucine distribution in the various brain compartments and conversion between compartments. The comprehensive model provided the basis for developing a simplified model for computational purposes.
While the model provides a comprehensive description of leucine kinetics, it contains more unknown parameters than can be reliably estimated. We have, therefore, simplified the model to reduce the number of parameters that need to be estimated, while retaining important features of the original model (Figure 2). The simplified model does not distinguish intra- and extracellular spaces, and the pools of free leucine and tRNA-bound leucine are combined and represented by a single tissue pool. Unlabeled leucine enters the tissue exchangeable pool either from the plasma or through the breakdown of protein, and leaves the tissue exchangeable pool by return to the plasma, metabolism, or incorporation into protein. This is described by the first order differential equation
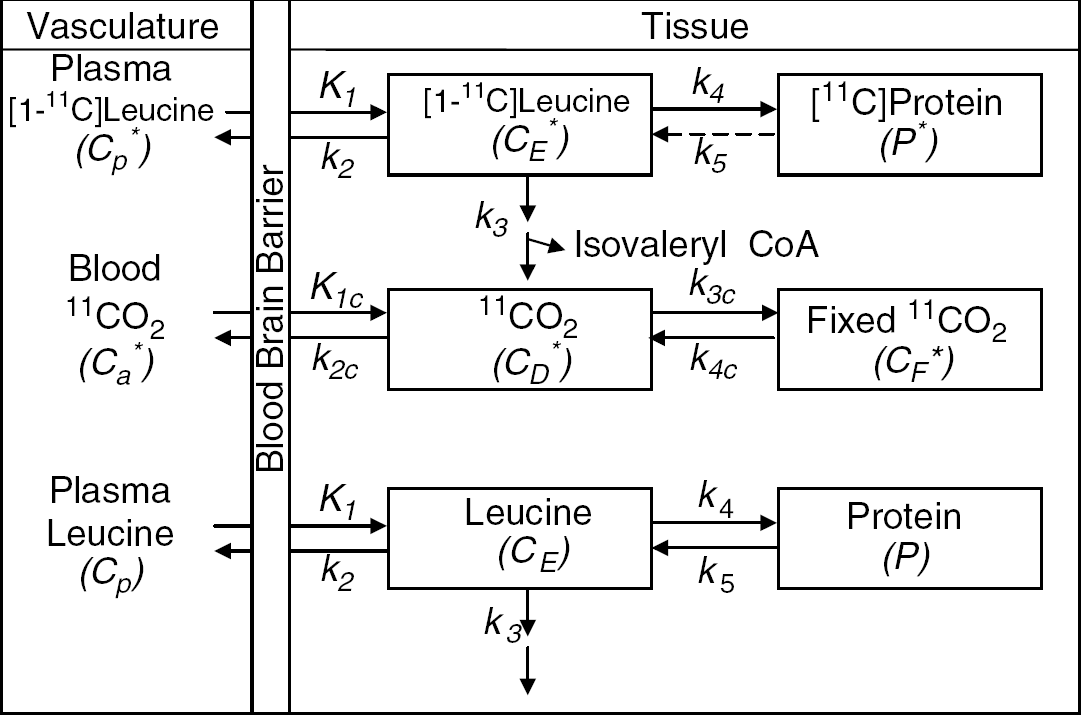
Simplified model of leucine in brain. The simplified model does not distinguish intra- and extracellular spaces, and the pools of free and tRNA-bound leucine are combined into a single tissue pool, represented by CE* or CE, for the labeled or unlabeled exchangeable pools, respectively. Cp* and Cp represent the arterial plasma concentrations of labeled and unlabeled leucine, respectively. K1 and k2 are the rate constants for carrier-mediated transport of leucine from plasma to tissue and from tissue to plasma, respectively. k3 is the rate constant for the first two steps in the catabolism of leucine, which includes a transamination reaction followed by a rapid decarboxylation. The rate constant for leucine incorporation into protein is represented by k4, and that for release of free leucine by protein degradation is k5. P* and P represent tissue concentrations of labeled and unlabeled proteins, respectively. Unlabeled leucine is assumed to be in a steady state. Due to the long half-life of proteins in brain, it is assumed there is no significant loss of label from the radioactive protein within the experimental period, that is, k5P*=0. After an injection of leucine labeled on the carboxyl carbon, the only possible labeled metabolites in brain are α-ketoisocaproic acid (α-KIC), CO2, and products of CO2 fixation. Since there is very little labeled α-KIC in brain (Keen et al, 1989), this pool is not explicitly represented in the model and k3 combines the transamination reaction and decarboxylation, as noted above. Labeled CO2 can arise either through catabolism of labeled leucine in brain or through influx from the blood after the breakdown of labeled leucine in other tissues; once in the brain, it may be either transported back from brain to blood or fixed in brain. In the model, Ca* and CD* represent the pools of labeled CO2 in the arterial blood and brain, respectively, and CF* represents the concentration of the labeled products of CO2 fixation in the tissue. K1C and k2C are the rate constants for influx and efflux of labeled CO2 between brain and blood, respectively, and k3C and k4C represent the rate constants for fixation and loss of fixed CO2, respectively.
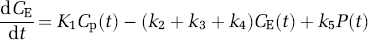
where Cp(t) and CE(t) are the concentrations of leucine in the arterial plasma and brain exchangeable pool, respectively, and P(t) is the concentration of leucine incorporated into protein. K1 and k2 are the rate constants for carrier-mediated transport of leucine from plasma to brain and transport back from brain to plasma, respectively. k3 is the rate constant for the first two steps in the catabolism of leucine, which include a transamination reaction followed by a rapid decarboxylation. Catabolism appears to be limited by the rate of the transamination reaction in brain (Keen et al, 1989). The rate constants for incorporation of leucine into protein and for the breakdown of protein are k4 and k5, respectively. The change in the concentration of protein in the tissue is thus described by
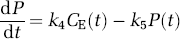
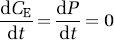
where CE(t), P(t), k4 and k5 are as defined above. Unlabeled leucine, in both the exchangeable pool and in protein, is assumed to be in a steady state, i.e.,
Labeled leucine has the same kinetics as its unlabeled counterpart, with the exception that it is not in a steady state during the experimental period and there is no significant breakdown of labeled protein, i.e., k5P*(t)=0, where P*(t) is the concentration of labeled leucine in protein at time t. Therefore, the concentrations of labeled leucine, CE*(t), and labeled protein, P*(t), are given by
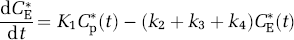
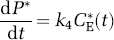
where Cp*(t) is the concentration of labeled leucine in the arterial plasma.
The only possible labeled metabolites in brain after an injection of leucine labeled on the carboxyl carbon are α-ketoisocaproic acid (α-KIC), CO2, and products of CO2 fixation. There is very little labeled α-KIC in brain (Keen et al, 1989), but there remains the possibility of labeled CO2 and products of CO2 fixation. Labeled CO2 can arise either through catabolism of labeled leucine in brain or through influx from the blood after the breakdown of labeled leucine in other tissues. The first step in the catabolic pathway of leucine is a reversible reaction catalyzed by a branched-chain amino-acid transaminase. The reaction, which takes place primarily in muscle, is the transfer of the α-amino group of leucine to a keto acceptor, usually α-ketoglutarate, to form α-KIC. The α-KIC can be oxidatively decarboxylated to yield CO2 and isovaleryl CoA, a reaction catalyzed by a branched-chain α-keto acid dehydrogenase enzyme complex primarily in the liver and kidney. Labeled CO2 produced in this manner can enter the brain via the circulation. Once in the brain, it may return to the blood or be fixed in the brain through anaplerotic reactions associated with tricarboxylic acid intermediates. The equations describing labeled CO2 kinetics are given by
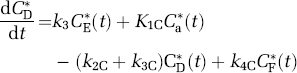
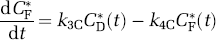
where k3 and CE*(t) are defined above; CD*(t) and CF*(t) are the brain concentrations of labeled CO2 and the products of its fixation, respectively; Ca*(t) is the blood concentration of labeled CO2; K1C and k2C are the rate constants for influx of labeled CO2 from blood to brain and efflux of CO2 from brain to blood, respectively; and k3C and k4C are the forward and backward rate constants for fixation of labeled CO2.
Dilution of the Precursor Pool for Protein Synthesis
In animal studies, the fraction of the precursor pool for protein synthesis that is derived from the arterial plasma, λ, can be evaluated directly as the steady-state ratio of the specific activity of leucine in the tissue tRNA-bound fraction to that in the arterial plasma (Smith et al, 1988) as
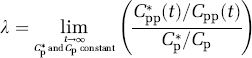
where Cpp* and Cpp are the labeled and unlabeled concentrations of t-RNA-bound leucine in the tissue, respectively. Animals are administered a programmed infusion designed to achieve and maintain a constant arterial plasma concentration of labeled leucine and, after a sufficient interval for the brain to reach steady state with the arterial plasma, the specific activities of leucine in plasma and in the brain aminoacyl-tRNA fraction are measured. The equation for λ according to the simplified model (Figure 2) is
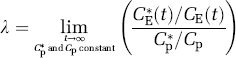
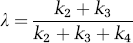
By solving equations (1) to (5) for the steady-state ratio defined in equation (9), we observe that λ can also be expressed as the ratio of rate constants
Estimation of Rate Constants and λ
The total activity in the field of view of the PET camera, CT*(t), includes tissue activities of labeled leucine, protein, CO2, and CO2 fixation products as well as activity in the blood in the brain, i.e.,
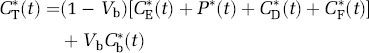
where Vb is fraction of the volume occupied by blood, Cb*(t) is the total activity in blood, and the remaining terms are as defined previously. In order to use the simplified model equations (4) and (5) to estimate the leucine rate constants K1, k2+k3, and k4, measured total activity must be precorrected for activity in the blood as well as for labeled CO2 and its fixation products. For the purpose of rate constant estimation, we assume that labeled CO2 fixation products are negligible during the experimental interval and that the labeled CO2 in the brain is rapidly equilibrated with that in the blood, i.e.,

where VD is the equilibrium distribution ratio for labeled CO2 given by

Equations (4), (5), (11), and (12) form the basis for estimation of the leucine rate constants as detailed in the appendices. λ is then computed from the combination of rate constants shown in equation (10).
Determination of Regional Rates of Cerebral Protein Synthesis
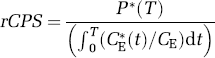
Determination of rCPS with the autoradiographic [14C]leucine method is based on the principles for assay of rates of chemical reactions with isotopes adapted for the special conditions encountered in vivo. The total amount of labeled product specific to the reaction of interest (in this case labeled protein) formed in the selected tissue over an interval of time is divided by the integrated specific activity of the precursor pool over the same interval, that is,
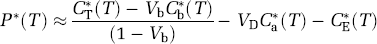
The numerator of equation (14) represents the amount of labeled protein, which is the only activity remaining in the tissue after the fixation and washing procedure of the autoradiographic [14C] leucine method. With PET, P*(T) can be estimated from total activity (equations (11) and (12)) as
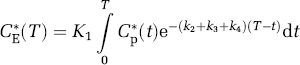
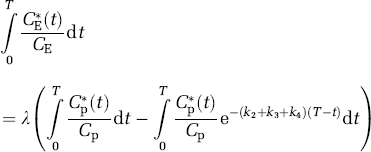
CE*(T) is determined from the time course of the measured labeled leucine in plasma and the rate constants for leucine by the solution of equation (4), viz.,
The integrated specific activity in the precursor pool, the denominator of equation (14), is estimated from the measured time courses of labeled and unlabeled leucine in arterial plasma, the rate constants for leucine by solution of equations (1), (3), and (4), and λ, that is,
Therefore,
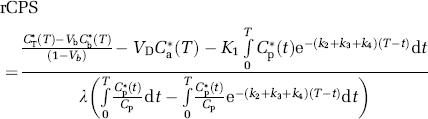
Equation (18) will be referred to as rCPS computational method ‘A’ because of its analogy with the operational equation of the autoradiographic [14C]leucine method. Values of the rate constants and λ used in equation (18) are those estimated for the individual subject and region. Equation (18) is relatively insensitive to errors in estimates of the individual rate constants K1, k2+k3, and k4, but requires an accurate estimate of the factor λ.
Regional rates of cerebral protein synthesis may also be determined directly from the estimated rate constants and measured arterial plasma leucine concentration as
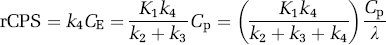
Equation (19) will be referred to as rCPS computational method ‘B’; it is derived by solving equations (1)–(3). We note from the ratio on the right in equation (19) that rCPS computed by method ‘B’ equals the net uptake rate constant for labeled leucine (in parentheses) multiplied by the plasma unlabeled leucine concentration and corrected for recycling of unlabeled leucine derived from protein breakdown (λ). Regional rates of cerebral protein synthesis computational methods ‘A’ and ‘B’ are mathematically equivalent, but are expected to have different sensitivities to errors in the model and data.
In the present study, animal experiments were conducted to estimate the parameters of the kinetic model for leucine and determine the amounts of labeled CO2 in blood and tissue. From these data, simulation studies were undertaken to investigate the feasibility of using L-[1-11C]leucine with dynamic PET scanning to estimate the rate constants, determine λ, and compute rCPS by equation (18) or (19).
Materials and methods
Animals
All procedures were performed in accordance with the National Institutes of Health Guidelines on the Care and Use of Animals and an animal study protocol approved by the National Institute of Mental Health Animal Care and Use Committee. Normal, male Sprague–Dawley rats (Taconic Farms, Germantown, NY, USA) weighing 416 to 480 g were used. Animals were maintained under controlled conditions of normal humidity, temperature, and standard alternating 12-h periods of light and darkness. Food and water were provided ad libitum. With the animals under light halothane anesthesia, catheters were inserted into a femoral artery and vein. Animals were maintained under light halothane anesthesia throughout all experimental procedures. Rectal temperature was continuously monitored and maintained at 37°C by a heat lamp or heat pad.
Chemicals
L-[1-14C]leucine (specific activity, 2.15 GBq/mmol) was obtained from Amersham Biosciences Corp., Piscataway, NJ, USA.
Procedures to Determine Time Courses of [14C]leucine, [14C]protein, and 14CO2 in Blood and Brain After Injection of L-[1-14C]leucine
The experimental period was initiated by an intravenous pulse of L-[1-14C]leucine (1.47 to 1.67 MBq in 0.1 mL of normal saline). Six continuous timed arterial blood samples were collected in the first 30 secs; additional timed arterial blood samples were drawn at 0.75, 1, 2.5, 5, 10, 20, 30, 40, 50, and 60 mins or until the end of the experiment. Blood samples were drawn into syringes and ends were immediately capped. Samples were processed in one of three ways: (1) To determine the total concentration of 14C in whole blood, approximately 0.1 mL of blood was transferred to a pre-weighed liquid scintillation vial containing 1 N NaOH, the vial was reweighed and counted. (2) To determine the concentration of 14CO2 in blood, approximately 0.05 mL of blood was injected through the septum of a preweighed sealed vial containing a polyethylene cup with a filter paper soaked with 1 N NaOH, the vial was reweighed and, after allowing 24 h for the evolution of 14CO2, the filter paper was removed and counted. (3) To determine plasma concentrations of [14C]leucine and [14C]protein, blood samples were immediately centrifuged to remove the red cells, 20 μL of plasma from each sample was diluted in distilled water and acidified with a solution of 16% (W/V) sulfosalicylic acid to precipitate protein, and the precipitated protein was separated from the acid-soluble free leucine by centrifugation at 10,000 g for 10 mins. Protein pellets were washed twice with 4% sulfosalicylic acid, dissolved in 1 N NaOH, and the concentration of 14C in the dissolved protein fraction was determined by liquid scintillation counting (Packard 2250CA, Packard Instrument Co, Downers Grove, IL). The supernatant fraction and the washes were combined to form the tissue acid-soluble free leucine pools and the concentration of 14C was determined by liquid scintillation counting.
Experiments were terminated at 2.5, 5, 10, 20, 35, or 60 mins by decapitation. The brain was removed rapidly (within 30 secs) and frozen in liquid nitrogen (LN2). After the brain was frozen completely, it was broken into small pieces while immersed in LN2. Pieces were transferred to a cryochamber maintained at −30°C, rapidly weighed and processed in one of three ways: (1) To determine total tissue 14C concentration, samples (∼20 mg) were solubilized overnight in 1 N NaOH and counted. (2) To determine the tissue 14CO2 concentration, samples (20 to 70 mg) were placed in sealed vials and processed as described above for blood samples. (3) To determine brain concentrations of [14C]leucine and [14C]protein, samples (20 to 70 mg) were homogenized in 4% (W/V) sulfosalicylic acid and the precipitated protein was separated from the acid-soluble free leucine by centrifugation at 10,000 g for 20 mins. Protein pellets and supernatant fractions were processed as described above for blood samples.
Alternative Procedure to Determine Time Course of 14CO2 in Brain After Injection of L-[1-14C]leucine
To confirm brain 14CO2 concentrations, a second group of animals (417 to 581 g) was administered 1.33 to 1.96 MBq L-[1-14C]leucine by i.v. pulse injection. Animals were killed by decapitation at 10, 20, or 60 mins. The brain was removed rapidly (within 30 secs), frozen in LN2, and broken into small pieces as described above. Frozen samples were transferred to screw-capped microfuge tubes that had been preweighed and precooled in LN2. Each tube contained a smaller open plastic tube with a 1 N NaOH-soaked filter paper to trap any 14CO2 that may escape during reweighing. Microfuge tubes were re-submerged in LN2 immediately after reweighing. Tissue samples were transferred to Thunberg tubes partially submerged in LN2 and containing frozen 8% (W/V) sulfosalicylic acid, and sidearms containing NaOH-soaked filter papers were replaced. While still submerged in LN2, Thunberg tubes were evacuated and closed before being brought to room temperature. They were left overnight at room temperature for CO2 to evolve, filter papers were removed, combined with their respective filter papers from the weighing procedure, and counted.
Estimation of Rate Constants of L-[1-14C]leucine
Rate constants K1, k2+k3, and k4 were estimated by fitting the kinetic model given in equations (4) and (5) to the measured time courses of [14C]leucine in the plasma and [14C]leucine and [14C]protein in brain. Rate constants were constrained so that λ=0.64, the value previously measured in the anesthetized rat (Smith et al, 1998). The residual sum of squares of the percentage differences between measured and fitted brain [14C]leucine concentrations plus the residual sum of squares of the percentage differences between measured and fitted brain [14C]protein concentrations was minimized by a modification of the method of Koeppe et al (1985). Details are provided in Appendix A.
Simulation Studies
Simulations were performed based on the simplified kinetic model for leucine and CO2 (Figure 2; equations (1)–(7) and (11)). Rate constants K1, k2+k3, and k4 for L-[1-11C]leucine were those estimated for L-[1-14C]leucine as described above. The fraction of leucine not incorporated into protein that leaves the tissue through efflux, that is, k2/(k2+k3), was simulated as 10%, 50%, or 90%. Plasma leucine was assumed to be 188 nmol/mL, the average value previously measured in anesthetized rats (Smith et al, 1998). In the simulation studies, it was assumed that there is no diffusion limitation of CO2 into the brain so that its influx rate constant was equal to cerebral blood flow. A value of 1.36 mLg−1min−1 was used to approximate K1C; this value is the mean cerebral blood flow reported in normal rats under light halothane anesthesia (Hansen et al, 1993). The equilibrium brain: blood partition coefficient for CO2, (VD, equation (13)) was assumed equal to the brain:blood ratio of 14CO2 concentrations measured 60 mins after a pulse of L-[1-14C]leucine. The rate constant for fixation of CO2, k3C, was 0.001 or 0.01 min−1, a range chosen to bracket the value of 0.005 min−1 estimated from the data of Siesjö and Thompson (1965), and k4C was assumed to be zero. Input functions (labeled and unlabeled leucine in plasma, labeled CO2 and total activity in whole blood) were the averages of those measured in the rat, normalized to an injected dose of 1.67 MBq (45 μCi) and a body weight of 450 g. Blood volume was assumed to be 2%. For each set of rate constants, the time course of total activity was calculated for a 60-min interval based on a scanning schedule of 10 × 30, 2 × 150, and 10 × 300 secs. Simulated counts were adjusted for 11C decay (half-life 20.38 mins). Zero-mean noise with variance proportional to total counts in each frame of data was added to the total activity. The resultant noise-added data were then corrected for 11C decay and the rate constants were estimated from linearizations of the simplified kinetic model for leucine as detailed in Appendix B. λ was computed from equation (10), and rCPS was computed by either equation (18) or (19). The procedure was repeated with 1000 random noise samples, and the medians and standard deviations of the estimates of the rate constants, λ, and rCPS were calculated.
Results
Time Courses of [14C]leucine, [14C]protein, and 14CO2 in Blood and Brain After Injection of L-[1-14C]leucine
Time courses of [14C]leucine, [14C]protein, 14CO2, and total 14C in blood and brain are shown in Figure 3. The peak of [14C]leucine activity in the plasma occurred 7±3 secs after injection; activity then decreased through the remainder of the experimental interval. Plasma [14C]protein was negligible until ∼15 mins postinjection and then increased gradually. Blood 14CO2 was low (<700 Bq/g) throughout. Measured brain total 14C and [14C]leucine activities were maximum 2.5 mins postinjection (Table 1; Figure 3B). Total 14C was approximately constant between 10 and 60 mins, but variance in the measurements was high, probably because of differences between animals as well as differences in specific tissue regions sampled. [14C]protein in brain increased throughout the 60-min interval. Maximum brain 14CO2 activity (274 Bq/g) occurred 10 mins postinjection (Table 1). Brain 14CO2 activities represented 8%±2%, 6%±2%, 10%±1%, 6%±6%, 3%±1%, and 5%±3% of total brain 14C 2.5, 5, 10, 20, 35, and 60 mins postinjection. The low brain 14CO2 activities were confirmed in the second group of animals (Table 1). The brain:blood concentration ratio of 14CO2 60 mins after injection of L-[1-14C] leucine was 0.53±0.22 (n=3).
Total 14C and 14CO2 in brain tissue after injection of a bolus of L-[1-14C]leucine a
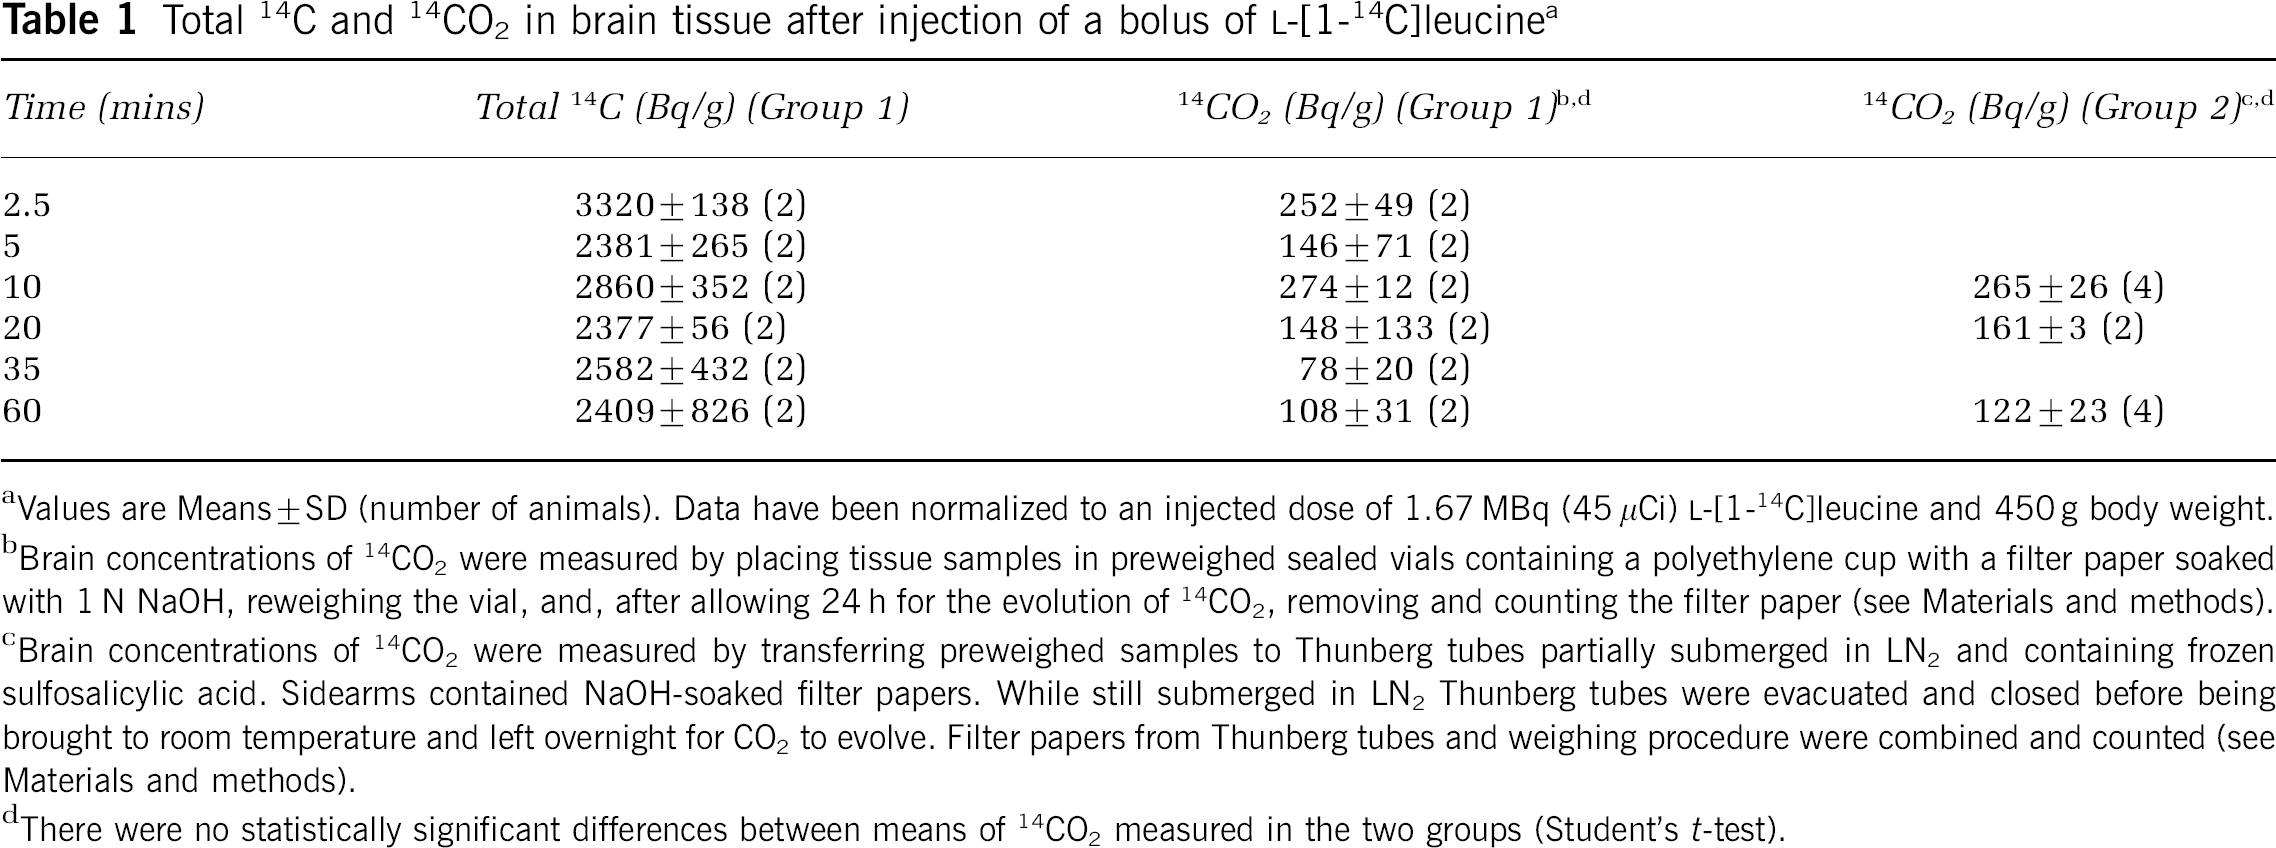
Values are Means±SD (number of animals). Data have been normalized to an injected dose of 1.67 MBq (45 μCi) L-[1-14C]leucine and 450 g body weight.
Brain concentrations of 14CO2 were measured by placing tissue samples in preweighed sealed vials containing a polyethylene cup with a filter paper soaked with 1 N NaOH, reweighing the vial, and, after allowing 24 h for the evolution of 14CO2, removing and counting the filter paper (see Materials and methods).
Brain concentrations of 14CO2 were measured by transferring preweighed samples to Thunberg tubes partially submerged in LN2 and containing frozen sulfosalicylic acid. Sidearms contained NaOH-soaked filter papers. While still submerged in LN2 Thunberg tubes were evacuated and closed before being brought to room temperature and left overnight for CO2 to evolve. Filter papers from Thunberg tubes and weighing procedure were combined and counted (see Materials and methods).
There were no statistically significant differences between means of 14CO2 measured in the two groups (Student's t-test).
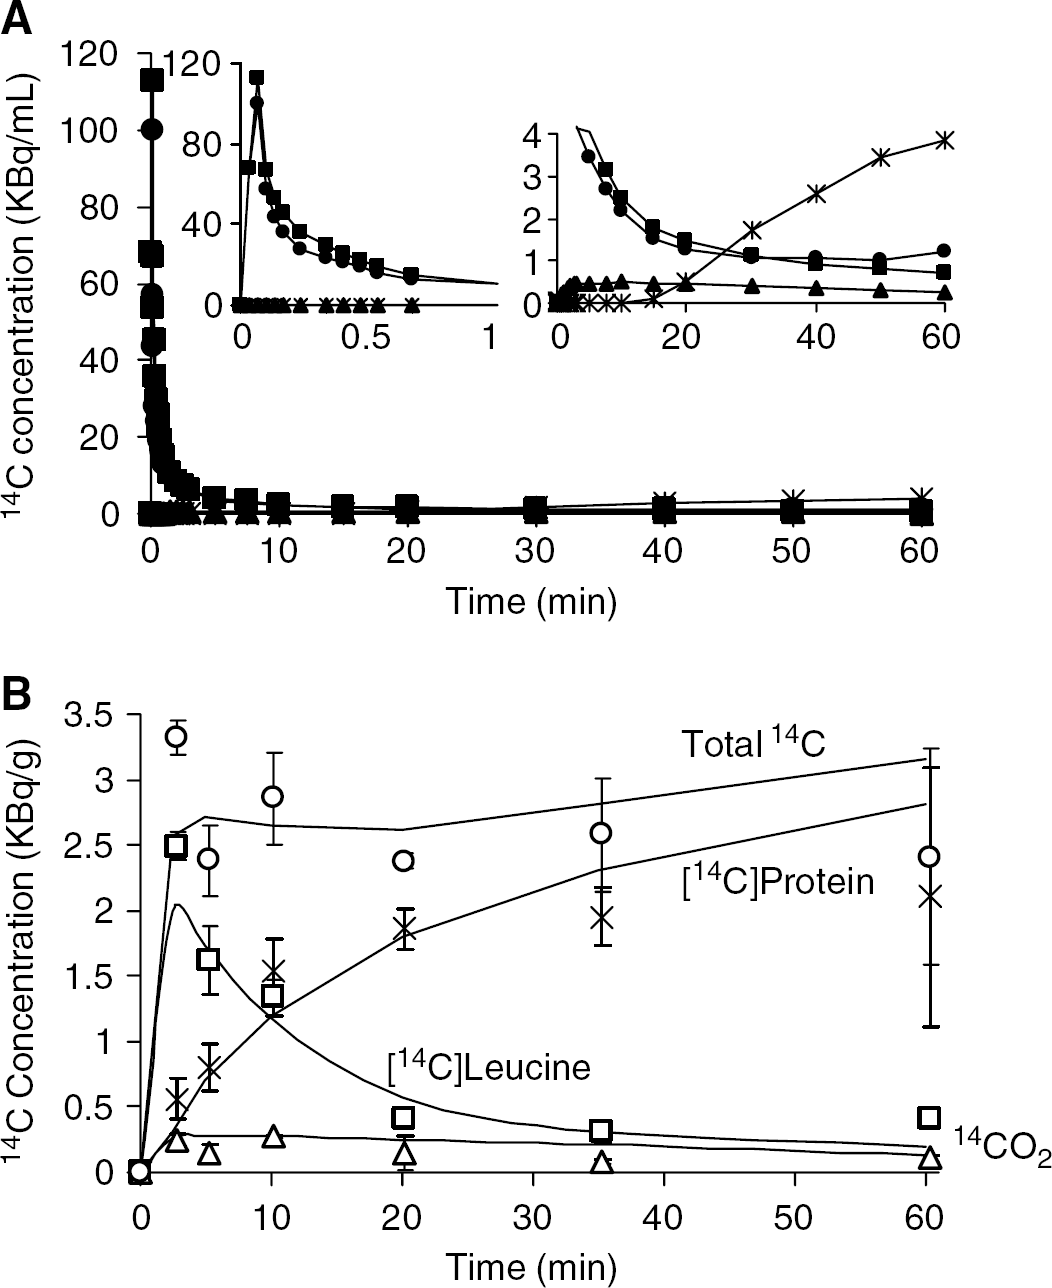
[14C]leucine, [14C]protein, and 14CO2 in blood and brain after a pulse of L-[1-14C]leucine. (
Rate Constants of L-[1-14C]leucine
Rate constants for the simplified kinetic model for leucine, estimated according to the procedure described in Appendix A and constrained so that λ=0.64, were K1=0.059 mLg−1min−1k2+k3=0.15 min−1, and k4=0.084 min−1. Tissue activities predicted by the model with the estimated rate constants and the average input functions are shown in Figure 3B.
Simulation Studies
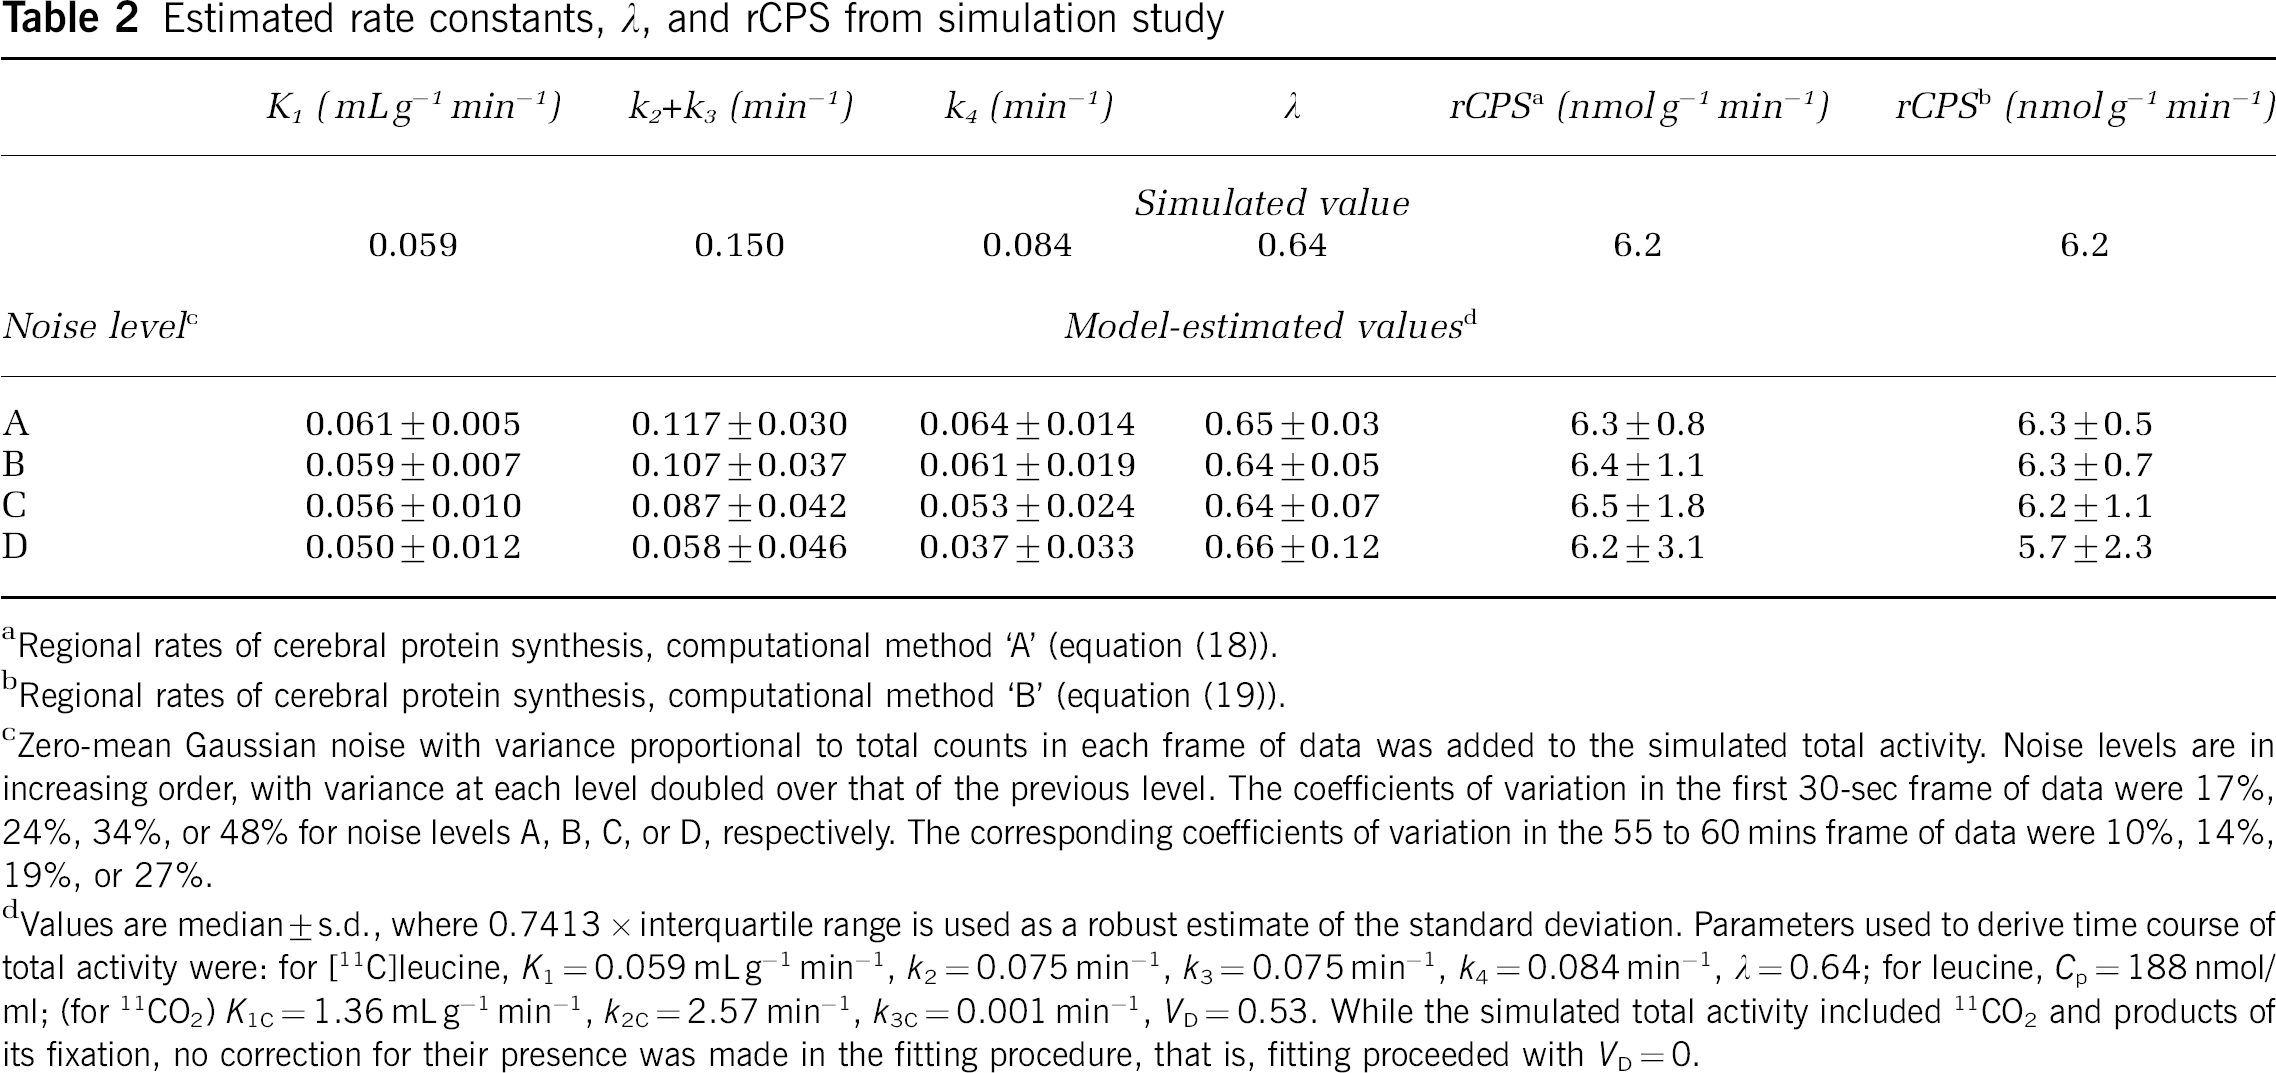
For all conditions examined estimates of λ had low bias (−5% to +5%), and coefficients of variation were low (5% to 8% at low noise levels, increasing to 17% to 33% at the highest noise levels). The rate constants k2+k3 and k4 were consistently underestimated, but because their estimates were highly correlated (ρ≈0.8) λ was more accurately estimated than the individual rate constants. As might be expected from the low levels of labeled CO2 in the tissue, estimates of the rate constants and λ were only negligibly affected by whether the simulated total activity time course was corrected for 11CO2 activity before rate constant estimation. Results from one simulation (K1=0.059 mLg−1 min−1, k2=0.075 min−1, k3=0.075 min−1, k4=0.084 min−1, λ=0.64; K1C=1.36 mLg−1 min−1, k2C=2.57 min−1, k3C=0.001 min−1, VD=0.53; fitting with no precorrection of simulated total activity for estimated 11CO2) are shown in Table 2. Estimates of the rate constants K1, k2+k3 and k4 decreased with increasing noise level, but estimates of λ increased only slightly. Variances in rCPS increased with increasing noise levels, and those computed with method ‘A’ were higher than those determined by method ‘B’ (Table 2). In all simulations when the 11CO2 fixation rate constant was at the lower limit examined (k3C=0.001 min−1), bias in rCPS determined by computational method ‘A’ (equation (18)) ranged from −2% to +3% at the lowest noise level depending on whether the fraction of leucine not incorporated into protein that leaves the tissue through efflux, i.e., k2/(k2+k3), was 10%, 50%, or 90%, and whether simulated total activity was precorrected for estimated 11CO2. The range increased to −6% to +6% at higher noise levels. Corresponding biases for rCPS determined by method ‘B’ were −2% to +4% at the lowest noise level and −16% to +3% at the higher noise levels. When the 11CO2 fixation rate constant was increased to the upper limit examined (k3C=0.01 min−1) bias in rCPS determined by computational method ‘A’ ranged from −5% to +9% at the lowest noise level and −1% to +12% at higher noise levels; corresponding biases in rCPS computed by method ‘B’ were +3% to +9% and −11% to +8% at the lowest and higher noise levels, respectively. In almost all simulations, variances in rCPS determined by computational method ‘B’ were lower than those determined by method ‘A’.
Estimated rate constants, λ, and rCPS from simulation study
Regional rates of cerebral protein synthesis, computational method ‘A’ (equation (18)).
Regional rates of cerebral protein synthesis, computational method ‘B’ (equation (19)).
Zero-mean Gaussian noise with variance proportional to total counts in each frame of data was added to the simulated total activity. Noise levels are in increasing order, with variance at each level doubled over that of the previous level. The coefficients of variation in the first 30-sec frame of data were 17%, 24%, 34%, or 48% for noise levels A, B, C, or D, respectively. The corresponding coefficients of variation in the 55 to 60 mins frame of data were 10%, 14%, 19%, or 27%.
Values are median±s.d., where 0.7413 × interquartile range is used as a robust estimate of the standard deviation. Parameters used to derive time course of total activity were: for [11C]leucine, K1=0.059 mLg−1 min−1, k2=0.075 min−1, k3=0.075 min−1, k4=0.084 min−1, λ=0.64; for leucine, Cp=188 nmol/ml; (for 11CO2) K1C=1.36 mLg−1 min−1, k2C=2.57 min−1, k3C=0.001 min−1, VD=0.53. While the simulated total activity included 11CO2 and products of its fixation, no correction for their presence was made in the fitting procedure, that is, fitting proceeded with VD=0.
Discussion
In the present study, we have introduced a new method for determination of λ, a number that represents the fraction of leucine in the precursor pool for protein synthesis that is derived from arterial plasma. As rates of cerebral protein synthesis determined with L-[1-14C]leucine or L-[1-11C]leucine are inversely proportional to λ, rCPS may be significantly underestimated if this factor is not taken into account. In rats, for example, λ has been determined to be 0.58 in the awake animal (Smith et al, 1988) and 0.64 in the thiopental-anesthetized animal (Smith et al, 1998); failure to take it into account would result in ∼40% underestimation of rCPS. Previously, determination of λ was only possible by direct biochemical assay. No method suitable for PET studies had been reported; this presented a major obstacle to the development of a method for measuring rCPS in human studies. The method proposed here is based on a kinetic model for leucine and requires that the time course of brain activity after injection of labeled leucine be measured, which can be readily achieved with PET. The present simulation studies suggest that λ can be reliably estimated, even from noisy PET data.
The kinetic modeling method for determination of λ (equation (10)) is based on the definition of λ in equation (8) and is dependent on three premises. The first is that there is no isotope effect, that is, identical rate constants operate on both labeled and unlabeled leucine. The second is that there is a steady state for unlabeled leucine in the tissue, that is, that there is no net change in the sizes of either the exchangeable pool or the pool of leucine incorporated into protein. Rates of protein synthesis and protein degradation are therefore equal. The third premise is that the steady state for the labeled leucine is an apparent steady state because it pertains to the free and tRNA-bound leucine only, not the protein bound (Smith et al, 1998). We have assumed that k5P*=0 because the average half-life of protein in brain is several days (Lajtha et al, 1976), but k4CE*≠0. It is this difference in the conditions for the labeled and unlabeled species that forms the basis for the definition of λ as a ratio of rate constants.
The second challenge to adapting the [14C]leucine autoradiographic method to PET was that of determining the amount of labeled protein synthesized during the experimental interval. In the autoradiographic method, tissue sections are fixed and washed before autoradiography, thereby removing both free leucine and labeled metabolites. With PET, however, only total activity in the field of view is measured with the PET camera, and the data must be corrected for labeled free leucine, metabolites, and blood in the tissue. The experimental design of giving a pulse of leucine and estimating the amount of protein synthesized after a 1-h interval serves to allow the free leucine in the tissue to clear so that it is only a small fraction of the total activity at the end of the interval. Errors in estimation of free leucine, therefore, do not have a large impact on determinations of rCPS when computational method ‘A’ is applied. However, measurement of the full time course of tissue activity, which is not possible with the autoradiographic method, is possible with PET; this allows determination of rCPS directly from the estimated rate constants and the arterial plasma leucine concentration, that is, by use of computational method ‘B’. Comparisons of rCPS computational methods ‘A’ and ‘B’ should be interpreted with caution, however, as the present simulation examined only errors due to noise in the time–activity curves and due to ignoring the presence of labeled CO2 and its fixation products; it did not consider the effects of other sources of error. Results on measured PET data will provide more meaningful comparisons.
Our data indicate that tissue levels of 14CO2 are low throughout the 60-min interval after injection of L-[1-14C]leucine. Tissue levels of 14CO2 reach a peak of 10% of total activity 10 mins postinjection. These levels were somewhat lower and peaked somewhat later than those measured in conscious rats (Keen et al, 1989). The present simulation study based on the low levels of tissue 14CO2 measured in rats indicates that the presence of labeled CO2 can be ignored in estimation of λ and rCPS without introducing significant bias. Higher levels of labeled CO2 in brain or increased fixation rates, if present, for example, as a result of hypoglycemia, very high blood concentrations of branched-chain amino acids, or elevated tissue ammonia might be at least partially corrected by means of measurements of labeled CO2 in the blood, although this remains to be tested.
The kinetic model used in the present study differs from the model proposed for use with L-[1-11C]leucine by Hawkins et al (1989). Hawkins et al (1989) did not address recycling of unlabeled leucine derived from protein breakdown into the precursor pool for protein synthesis. Without correction for recycling, computed rates of cerebral protein synthesis are underestimated, and one cannot distinguish true changes in rCPS from apparent changes resulting from alterations in λ. Additionally, the model of Hawkins et al (1989) differs in the description of labeled metabolites in brain. Our model accounts for 11CO2 that may enter the brain from blood as well as 11CO2 produced by metabolism of [11C]leucine in the brain, whereas the model of Hawkins et al (1989) considers the latter to be the only source of 11CO2. We have found that this compartment is sufficiently small that it can be ignored, at least under the conditions of our study. Thus, a two-tissue compartmental model effectively describes total activity. By contrast, the model of Hawkins et al (1989) in studies of monkeys predicted a larger metabolite pool with slower turnover; this may result in lower estimates of the amount of leucine incorporated into protein than those provided by our model. Studies in primates, essential to validate the use of the presently proposed kinetic model, have been performed and are reported elsewhere (Smith et al, 2005).
The present study has known limitations. The simplified kinetic model did not fully describe the time courses of free [14C]leucine and [14C]protein measured in the rat. The high degree of variability in the tissue activities, particularly [14C]protein activity measured at late times, compounds the difficulty of obtaining good fits with the kinetic model. The high variability might be due to the necessity of using a separate group of animals at each time point as well as the difficulty of sampling comparable tissue regions in each animal. In the present study, measured [14C]protein increases more rapidly than estimated [14C]protein in early intervals after injection, but the pattern reverses at later times. This precursor-product pattern is consistent with the presence of tissue heterogeneity and application of a kinetic model based on the assumption of tissue homogeneity, as previously seen in [14C]deoxyglucose studies (Schmidt et al, 1995). Other simplifications of the kinetic model, for example, the combination of the free and tRNA-bound leucine pools into a single precursor pool in brain, might also have affected the goodness-of-fit. The effects of tissue heterogeneity and other model simplifications on estimation of λ and rCPS are yet to be determined. Additionally, the value of λ in the halothane-anesthetized rat may differ from that in the thiopental-anesthetized rat. In the present simulation study, we relied on rate constants for influx and efflux of labeled CO2 between blood and brain that were consistent with the observed data, but we did not measure brain 14CO2 activities at sufficiently early times to enable direct estimation of CO2 rate constants. Simulations with slower kinetics of labeled CO2, however, did not yield notably different estimates of λ and rCPS (data not shown), probably because of the low levels of labeled CO2 in the tissue.
Results of the present study suggest that PET measurement of regional cerebral protein synthesis with L-[1-11C]leucine and a kinetic modeling approach to correct for recycling of tissue amino acids is feasible. Validation studies were, therefore, performed in primates to compare biochemical determinations of λ with estimates from dynamic PET studies and to compare rCPS determined with the L-[1-14C]leucine autoradiographic method with that determined with L-[1-11C]leucine and PET; results are reported in our companion paper (Smith et al, 2005).
Footnotes
Acknowledgements
We thank Dr L Sokoloff for support during this project.
Appendix A: Estimation of Rate Constants from Biochemical Determinations of Labeled Leucine and Protein
From equations (4) and (5) and zero initial conditions, the model equations for the amount of labeled leucine, CE*, and labeled protein, P*, in the tissue at time T can be written as
and
Since λ=(k2+k3)/(k2+k3+k4), the above equation can be rewritten as
Observe from equations (A1) and (A2) that, if (k2+k3+k4) and λ were known, then the above integrals could be computed and CE*(T) and P*(T) would be linear in the parameter K1. This is the basis of the linear least-squares search method of Koeppe et al (1985), which was used in the present study to estimate the parameters K1, k2+k3, and k4, constrained so that λ=0.64, the value previously measured in the anesthetized rat (Smith et al, 1998). The vectors of data observations are
where CEi*(T i ) and P i *(T i ) are the tissue activities of labeled leucine and protein, respectively, measured in animal i at time T i . For the fixed value of λ and a range of values of β j =k2j+k3j+k4j, the vectors
and
were calculated, where Cpi*(t) is the labeled leucine in the arterial plasma of animal i at time t. For each j, a linear least-squares algorithm was used to find the value K1(j) that minimizes
where
Finally, the index j was chosen at which WRSS(j) was minimum. Then K1=K1(j), k2+k3=λβ j , and k4=(1−λ)β j .
Appendix B: Estimation of Rate Constants of [ 11 C]leucine from Dynamic PET Data
The simplified kinetic model for leucine describes the labeled free leucine in the tissue, CE*(t), and the labeled protein in the tissue, P*(t), by the following set of differential equations:
Define C i * as the sum of the labeled free leucine and protein in the tissue, that is,
Then, from equations (B1) and (B2)
Multiplying both sides of equation (B4) by (k2+k3+k4) gives
or, equivalently,
Taking the derivative of equation (B4) yields
Substituting equation (B1) into (B7), that is,
and equation (B6) into (B8) leaves
Twice integrating equation (B9) provides the basis for linear estimation of the parameters:
where
Although C i *(t) is not directly measured by the PET camera, is can be estimated by correcting the total activity measured by the PET camera, CT*(t), for the labeled CO2 in brain and the activity in the blood in the brain, as described in equations (11) and (12), that is,
where VD is the equilibrium distribution ratio for labeled CO2, Vb is the blood volume, and Cb*(t) is the total blood activity.
When VD and Vb are known, the time course of C i *(t) can be determined from equation (B12) and a linear least-squares procedure can be used to estimate θ1 through θ3, and hence the rate constants for leucine and λ. In the estimation, we assume that either VD is known or that VD Ca*(t) is sufficiently small compared with CT*(t) that labeled CO2 in the tissue can be ignored, that is, fitting can proceed with VD=0. When Vb is unknown, the fitting procedure can be applied for a range of values of Vb and the best fitting solution chosen. Finally, requiring that K1 be positive, and that k2+k3 and k4 be non-negative, leads to constraints
In practice, one can apply an unconstrained weighted least-squares algorithm to estimate θ1 through θ3, check whether the constraints are met, and in the (usually rare) case that the constraints are not met, re-fit with a more computationally intensive constrained minimization algorithm. In the present study, the constrained minimization program from Matlab® (The Mathworks Inc., Natick, MA, USA) was used when parameters estimated by unconstrained linear least squares did not meet the conditions in equation (B13).