
Abstract
Cerebral autoregulation (CA) refers to the properties of the brain vascular bed to maintain cerebral perfusion despite changes in blood pressure (BP). Whereas classic studies have assessed CA during changes in BP that have a gradual onset, dynamic studies quantify the fast modifications in cerebral blood flow (CBF) in relation to rapid alterations in BP. There is a lack of standardization in the assessment of dynamic CA. This review provides an overview of the methods that have been applied, with special focus on the elderly. We will discuss the relative merits and shortcomings of these methods with regard to the aged population. Furthermore, we summarize the effects of variability in BP on CBF in older people. Of the various dynamic assessments of CA, a single sit-to-stand procedure is a feasible and physiologic method in the elderly. The collection of spontaneous beat-to-beat changes in BP and CBF allows estimation of CA using the technique of transfer function analysis. A thorough search of the literature yielded eight studies that have measured dynamic CA in the elderly aged <75 years. Regardless of the methods used, it was concluded from these studies that CA was preserved in this population.
Introduction
The brain has a high metabolic demand and therefore requires adequate nutritional flow. To maintain stable cerebral blood flow (CBF), the brain's vasculature must respond to changes in arterial blood pressure (BP) or intracranial pressure. Thus, cerebral blood vessels have an inherent ability to keep CBF constant over a wide range of systemic BP levels, by means of myogenic, neurogenic, or metabolic mechanisms (Paulson et al, 1990; Chillon and Baumbach, 2002). In response to a variation in perfusion pressure (mean arterial pressure—intracranial pressure), an adaptation in cerebrovascular resistance (CVR) will cause CBF to return to its baseline. This hemodynamic process is known as cerebral autoregulation (CA) (Paulson et al, 1990; Panerai, 1998).
The term ‘autoregulation’ within the cerebral circulation was introduced by Lassen (1959). His review covered more than 200 clinical studies assessing CBF using the inert gas method (which measures arterial-venous gas difference), developed by Kety and Schmidt, and the indicator dilution method (which measures the venous dilution of an intraarterially injected indicator), developed by Gibbs, Maxwell, and Gibbs (Lassen, 1959). Notably, the more recently developed positron emission tomography scanning technique enabling, for example, measurement of cerebral oxygen metabolism, is founded on these principles.
Lassen's review included the now classic studies regarding static CA (sCA), which describes the response of CBF, averaged over a longer period of time, to long-term changes in BP with gradual onset. By plotting these changes in CBF and BP, it was found that CBF remains constant over a wide range of BP changes—the ‘plateau phase,’ with the upper and lower limits forming the boundaries of CA. It should be noted, however, that this classic single curve was a composite of many studies, and critical analysis of this work brings into question its validity (Paulson et al, 1990). Frequently, a slight slope exists over the pressure range where the supposed plateau had been plotted (Rosenblum, 1995). Predictions from a physiologic computer model are that in between the lower and upper boundaries of this plateau phase, CBF actually changes from 80% to 120% of baseline (Banaji et al, 2005). Nonetheless, between these upper and lower limits, autoregulation of CBF is effective. It is important to realize that these boundaries are not fixed (Paulson et al, 1990). Chronic hypertension, for example, shifts these limits of autoregulation toward higher BP levels. This adaptation protects the brain against hypertension, but may also render it more vulnerable to hypoperfusion during episodes of hypotension (Paulson et al, 1990).
The classic studies of CA are performed in the semi-steady state. The changes in BP occur gradually and the measured CBF values reflect the results of adaptation of CVR to the new, stable BP value. In other words, these studies assess the outcome of CA rather than the process of CA itself. In terms of maintaining sufficient nutritional blood flow, these semi-steady state studies provide no information as to whether a period of hypoperfusion precedes the eventual return to stable perfusion. Furthermore, the clinical applicability of sCA estimation is limited, because it requires pharmacological interventions to establish a sustained period of hypertension and hypotension.
More recent technological developments, such as transcranial Doppler ultrasonography (TCD) and servo-controlled finger photoplethysmography (Finapres), have offered possibilities to investigate the dynamics of the pressure—flow relationship of the cerebral circulation. In contrast to the classic studies, dynamic studies of CA quantify the fast modifications in CBF velocity (CBFV) in a major cerebral artery in relation to rapid alterations in BP within the upper and lower limits (plateau phase) of sCA. This approach allows differentiation of the CA response to fluctuations in beat-to-beat BP of different magnitudes and durations. Also in contrast to the classic studies, dynamic studies can identify episodes of reduced flow in this major perfusing artery in the period needed for CBF to return to baseline after hypotension. However, these dynamic studies are not able, at present, to measure flow at the brain tissue level. For studies of dynamic CA (dCA), a pharmacological intervention is not required, and the method is entirely noninvasive, which makes it clinically suitable. Recently, dCA has been shown to be impaired in several conditions that are highly prevalent in the elderly, such as ischemic stroke (Eames et al, 2002) and carotid stenosis (White and Markus, 1997). Therefore, the vulnerable brain in these patients is insufficiently protected against the effects of rapid BP changes. Furthermore, postprandial hypotension or orthostatic hypotension, both common hypotensive syndromes in elderly patients (Jansen and Lipsitz, 1995), may lead to cerebral symptoms like syncope, falls, and dizziness (Mehagnoul Schipper et al, 2000; Vloet et al, 2005). Whether these hypotensive syndromes result in symptoms and clinical signs and thus have clinical consequences is largely determined by the process of CA (Krajewski et al, 1993; Novak et al, 1998).
In hypertension, dCA has been addressed only in those who were <75 years old. In mild-to-moderate hypertension, dCA is unimpaired (Lipsitz et al, 2000), and reduction of BP to achieve normotension is not associated with cerebral hypoperfusion in middle-aged subjects (Zhang et al, 2007) and elderly subjects <75 years (Lipsitz et al, 2005). Although the beneficial effects of antihypertensive treatment in preventing cardiac disease and stroke are well known (Collins et al, 1990), whether it is similarly safe to treat hypertension in the elderly cannot be answered at present (Birns et al, 2005).
In contrast with studies of sCA, no uniform method exists to measure, analyze, and report dCA. In fact, the various methods applied differ in the type of BP stimuli (spontaneous or induced BP fluctuations) and in the model for analysis and interpretation.
Studies describing dCA in the elderly and in diseases affecting older people have used different methods to evaluate the dynamic autoregulatory capacity of the brain. The important clinical question whether aging affects CA can therefore only be attempted to be answered after careful interpretation of these different methodologies.
In this review, we will first provide an overview of measurements of the various parameters that have been applied to assess dCA. Also, we will discuss the different methods to provoke cerebral hemodynamics and allow dynamic assessments of CA. Later, we present an overview of dynamic studies of CA in the elderly and will discuss the interaction between CA and disease.
Review of Methods
Measurements
To evaluate the dynamic process of the autoregulatory capacity of the human brain, assessment of BP and CBF with high temporal resolution is essential, and photoplethysmography (Finapres) and TCD enable these measurements, respectively (Aaslid et al, 1982; Imholz et al, 1998; Parati et al, 2003). During all measurements of cerebral hemodynamics, changes in end-tidal CO2 should be closely monitored.
We will address the measurements of these parameters in more detail below.
Cerebral blood flow
The inert gas method and the indicator dilution methods measure global CBF as blood flow in volume per unit weight per unit time (for example, mL per 100 g per min). These methods are rather invasive and time-consuming, and the indicator dilution methods have a low temporal resolution.
In contrast, TCD is noninvasive, easy to use, and offers a very high temporal resolution (<0.1 secs) to monitor changes in CBF (Aaslid et al, 1982). Transcranial Doppler ultrasonography measures flow-velocity, in centimeter per second, in one of the supplying arteries of the brain, usually the middle cerebral artery (MCA). The flow-velocity in the MCA measured by TCD is determined by both the flow in the MCA and by its diameter, or rather its cross-sectional area. Therefore, changes in flow-velocity recorded with TCD represent changes in flow, provided that the diameter of the insonated vessel remains constant. It has been shown in (neuro)surgical patients that the diameter of the MCA does not significantly increase or decrease during, respectively, a mean decrease or increase in BP of 30 (s.d. 16) mm Hg (Giller et al, 1993; Newell et al, 1994). Furthermore, in healthy subjects, lower body negative pressure at 20 or 40 mm Hg induced decreases in flow-velocity in the MCA, whereas diameter changes did not occur during these tests (Serrador et al, 2000). These hemodynamic changes are similar to those encountered in dynamic tests of autoregulation, as will be illustrated later. In this review, consistent with the literature on this subject, flow-velocity in the MCA as recorded with TCD is denoted as CBFV, and it is assumed that the changes in CBFV reflect changes in CBF. However, in contrast with other methods (see above), this representation of CBF does not include brain tissue weight. As a further caveat, these measurements only reflect changes in flow for the perfused territory. It is conceivable that the perfused territory of the insonated vessel (mostly the MCA) might change under pathologic conditions, such as focal cerebral ischemia or vasogenic edema, and under nonpathologic conditions, such as hyper- or hypocapnia and extreme hypoxia.
Some TCD devices include a provision to determine an index of the cross-sectional area of the vessel being insonated, according to the backscattered power. In surgical patients, the vessel area increased after inhalation of isoflurane, whereas CBFV remained unchanged (Schregel et al, 1994). A similar observation was made during combined hypoxia and hypercapnia, whereas during either hypoxia or hypercapnia alone, no change in vessel diameter was noted (Poulin and Robbins, 1996). These data suggest that stability of vessel diameter cannot be assumed under all conditions.
Arterial blood pressure
Blood pressure can be measured noninvasively and beat to beat with a servo-controlled finger photoplethysmography as in the Finapres device (Parati et al, 2003). The obtained BP recordings using this device correspond well to invasive BP recordings in the brachial artery under various conditions, including during assessment of dCA (Imholz et al, 1998).
The combination of Finapres and TCD has made it possible to study the dynamic process of CA.
During BP recordings with Finapres, the finger is held at heart level. In autoregulation research using Finapres, changes in mean BP measured at heart level are used to estimate changes in cerebral perfusion pressure both in the supine position and during standing or head-up tilt. However, it has been argued that finger BP does not represent cerebral perfusion pressure because of the hydrostatic gradient between finger and brain when the subject is sitting or standing. Conversely, if the heart—brain circulation is considered to represent a closed-loop system, the subject's body position should not matter. This is based on the assumption that the intracranial and cerebral venous pressures are relatively low and constant and that, during standing or sitting, hydrostatic components of intracranial and cerebral venous pressure at head level are reduced commensurate with arterial pressure as for a closed circulatory system (Hicks and Badeer, 1992). However, controversies regarding these assumptions must be recognized (Dawson et al, 2004). Currently, there are no experimental data that either unequivocally support or disprove this theory (Hicks and Munis, 2005).
Carbon dioxide
Monitoring of CO2, mostly as end-tidal CO2, is essential in studies on cerebral perfusion and autoregulation. CO2 is a very potent cerebral vasodilator, and hypercapnia may cause a 3% to 5% increase in CBF per mm Hg rise in end-tidal CO2 (Hurn and Traystman, 2002; Claassen et al, 2007). Hypocapnia induces vasoconstriction and can reduce CBF by 2% to 3% per mm Hg reduction in end-tidal CO2. Thus, changes in respiratory pattern during tests of autoregulation may greatly confound the measurements of CBF. Moreover, CO2 causes sympathetic activation and may cause a substantial increase in BP (Claassen et al, 2007).
Methods to Induce Hemodynamic Changes
Essential for the evaluation of CA dynamics is to observe the response of cerebral perfusion to an alteration in BP. There are several potential methods to induce oscillations or rapid changes in BP, of which the thigh cuff method was the first to be introduced.
Step decreases in blood pressure
Aaslid et al (1989) introduced the thigh cuff method, which induces step decreases in BP by rapid deflation of cuffs around both thighs after an inflation lasting at least 2 mins. A different approach to reduce BP is lower body negative pressure. If the atmospheric pressure surrounding the lower body (which is enclosed in a sealed box) is reduced, this reduces the extravascular pressure, which causes dilatation of veins and a lowered vascular resistance, increasing the flow to the lower limbs (Schmidt et al, 1990).
Of interest, even without a change in mean BP, CBFV decreases during lower body negative pressure (Levine et al, 1994; Zhang et al, 2007). The exact mechanism that is responsible for this reduction in CBFV during lower body negative pressure remains uncertain; recently it was shown that it is not likely due to cerebral vasoconstriction caused by sympathetic activation (Zhang et al, 2007).
Both the thigh cuff and the lower body negative pressure techniques have been developed to allow assessment of dCA in the supine position. This is of relevance in patients who are confined to bed, for example, in head trauma patients in an intensive care unit. The thigh cuff method can be painful (Crews and Cahall, 1999) and is not a method of choice in aged subjects, although pain can be reduced if large-sized cuffs are used (R Aaslid, personal communication). Lower body negative pressure is also an uncomfortable procedure that is not well tolerated and cannot be applied in obese subjects. Therefore, both techniques are not ideally suited for the assessment of dCA in elderly patients. As the majority of these patients can be tested in an upright position, alternative methods to induce oscillations in BP can be used more efficiently.
A simple and feasible method used to assess dCA is the Valsalva maneuver, which causes characteristic changes in BP and CBFV (Tiecks et al, 1995b). In this procedure, the decrease in BP is due to elevation of intrathoracic and intraabdominal pressure induced by straining. With the increase in intrathoracic pressure, the venous return decreases, causing a reduction in cardiac output and hence a decrease in BP, which in turn leads to baroreflex-mediated vasoconstriction (Remmen et al, 2005). The increase in intrathoracic pressure also causes an increase in intracranial pressure (Williams, 1981), leading to a considerably stronger reduction in the cerebral perfusion pressure than indicated by the BP decrease. In addition, an increase in end-tidal CO2 pressure during the Valsalva maneuver has been observed (Hetzel et al, 2003) and the effect on cerebral vessels of a change in arterial CO2 pressure has to be taken into account. These observations suggest that the Valsalva maneuver is too complex a method to quantify the effects of changes in BP on CBFV.
Placing a hand in ice water (cold pressor test), as well as isometric exercise such as sustained handgrip, result in increased BP by stimulating sympathetic efferent pathways. Both methods have been used for the assessment of dCA (Micieli et al, 1994; Roatta et al, 1998; Giller et al, 2000). However, the CBFV response to these tests is very heterogeneous.
A different stimulator of the sympathetic nervous system is passive head-up tilt (Oblak et al, 2002). Cerebral blood flow velocity decreases during head-up tilt, and this test has been used to assess dCA in patients with syncope (Schondorf et al, 1997). However, during head-upright tilt in healthy subjects, a slight but significant decrease in both end-tidal CO2 pressure and CBFV has been observed, without a change in the rate of breathing (Cencetti et al, 1997). The change in end-tidal CO2 is thought to be due to the changes in the ventilation—perfusion relationship during tilting.
The role of the sympathetic nerve system in the regulation of CBF remains controversial. The cerebrovascular bed is well innervated by both sympathetic and parasympathetic nerve fibers (Edvinsson, 1975), but most studies in animals have found that baseline CBF does not change after autonomic denervation (Heistad and Marcus, 1978). On the contrary, Zhang et al (2002) found that dCA was altered markedly after ganglion blockade, suggesting that autonomic neural control of the cerebral circulation is involved in beat-to-beat regulation of CBFV. Therefore, possible direct effects on cerebral vessels of sympathetic activation have to be taken into account when using these tests to induce an increase in BP and assess dCA.
A more straightforward technique used to assess dCA is the sit-to-stand procedure, which induces a depressor change in BP and CBFV. The reduction in BP (of approximately 25%), resulting from an immediate and marked decrease in total peripheral resistance upon standing, is presumably caused by cardiopulmonary baroreflex mechanisms (Sprangers et al, 1991). This characteristic decrease in BP, named initial orthostatic hypotension, is absent in passive tilt testing (Wieling et al, 2007). After this initial decrease in total peripheral resistance, the arterial baroreceptors respond to the hypotension and the cardiopulmonary receptors react to the decline in preload, leading to an increase in total peripheral resistance. In Figure 1, we present a typical BP and CBFV response in a healthy elderly subject during a sit-to-stand maneuver. Standing up causes a small decrease in end-tidal CO2, which cannot, however, explain the immediate decrease in CBFV upon standing (Immink et al, 2006).
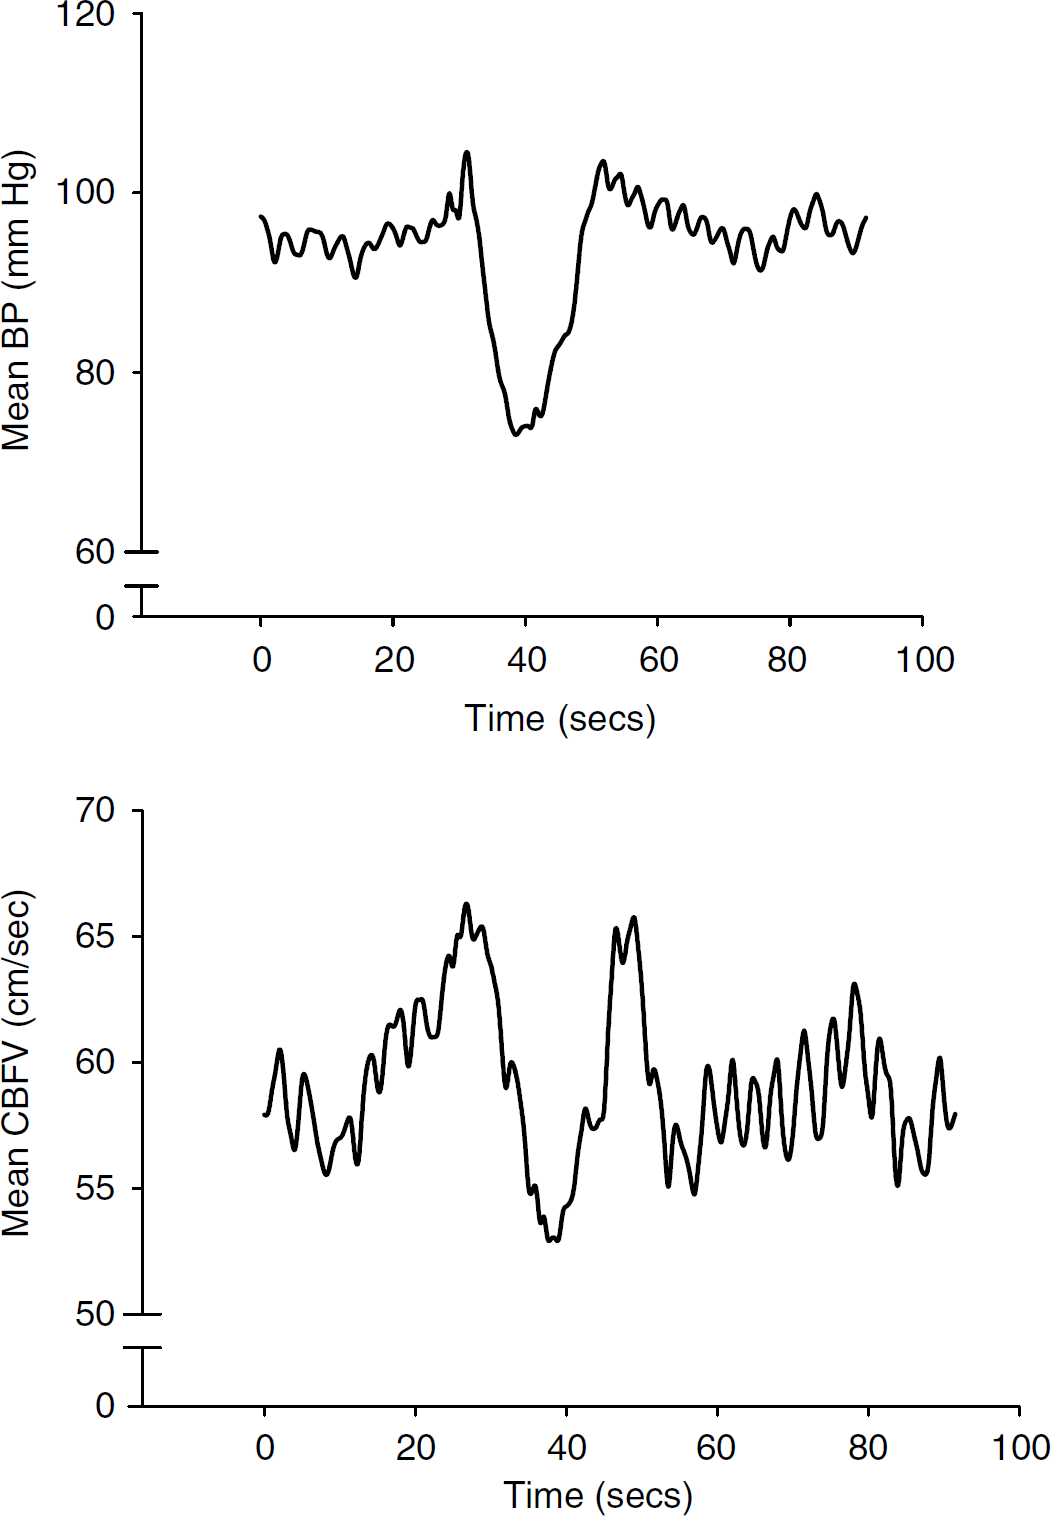
Blood pressure (BP) and cerebral blood flow velocity (CBFV) response during a sit-to-stand maneuver. Continuous beat-to-beat BP andCBFV measurements during a sit-to-stand maneuver in a healthy elderly subject. Beat-to-beat data were resampled at 2 Hz to create an equal time base. The subject starts standing after 30 secs.
When changing position from sitting to standing, the Doppler probe remains in the same spatial in relation to the heart and Finapres finger cuff throughout the procedure in contrast to passive head-up tilt, and thus avoiding the issue of a possible hydrostatic effect on cerebral perfusion pressure. The sit-to-stand procedure is a useful and feasible method to test dCA in elderly subjects. An additional benefit of this method is that it represents a physiologic challenge that occurs in daily life.
Oscillations in blood pressure
The techniques described above provide a single-step challenge to cerebral hemodynamics. In contrast, periodic squatting (Birch et al, 1995), oscillatory lower body negative pressure (Birch et al, 2002; Hamner et al, 2004), oscillatory thigh cuff inflation and deflation (Aaslid et al, 2007), and periodic breathing (Diehl et al, 1995) give rise to almost sinusoidal oscillations in BP. When BP is forced to oscillate at a determined frequency, CBFV follows these induced oscillations. These induced periodic variations in BP and CBFV can be used for the assessment of dCA.
A disadvantage of the periodic breathing approach is that it may lead to a larger tidal volume and induce hypocapnia. Instructing patients to breathe slowly and with small tidal volumes can prevent hypocapnia. However, older subjects and subjects with cognitive impairment may not be able to adequately perform this technique. The same holds true for the technique of periodic squatting. The disadvantages of lower body negative pressure and thigh cuffs have been described above. A single sit-to-stand maneuver is well tolerated in elderly subjects. Therefore, repeated sit-stand maneuvers may be easier to perform and better tolerated in the elderly population. However, this procedure has never been tested to produce sinusoidal oscillations in BP. It could be useful to test a well-developed, repeated, sit-to-stand protocol in experiments in the elderly population.
Fortunately, it is also possible to estimate dCA without inducing changes in BP. Blood pressure oscillations ranging from 0.02 to 0.4 Hz occur in humans during daytime and nighttime without an externally triggered BP manipulation, independent of stimuli of daily life (Parati et al, 1990). If spectral analysis is applied to this BP variability, three frequency ranges are noticeable: one around the respiratory frequency showing peaks at 12 cycles per minute (the high-frequency region, respiratory waves, around 0.2 to 0.4 Hz); one around 6 cycles per minute related to variations in vasomotor tone (mid-frequency region, Mayer waves at 0.1 Hz); and the lowest frequency region, of which the cause is speculative, around 1 cycle per minute (low-frequency region, 0.02 to 0.07 Hz; alternatively named the very low frequency) (Parati et al, 1995). Similarly, CBFV measured by TCD is not constant over time. (Lindegaard et al (1987) found individual ranges of spontaneous fluctuations between ±15% and ±35% of the mean flow in patients after carotid endarterectomy. Diehl et al (1991) found oscillations up to 30% of the mean CBFV with low-frequency oscillations between 0.4 and 9 cycles per min. In conclusion, spontaneous fluctuations of BP and CBFV may be useful for the assessment of dCA (Diehl et al, 1991). This mechanism limits the need for the above-mentioned methods to induce alterations in BP and seems to be the simplest method for the assessment of dCA in a clinical setting.
Baseline (resting) measurements of BP are the most physiologic situation to assess dCA. However, they depend on the magnitude of the spontaneous oscillations. This magnitude, in turn, depends on the variability of BP, which is not always high enough to allow estimations of dCA. Furthermore, spontaneous oscillations in the low-frequency range appear inconsistently. These reasons may explain the lack of coherence between BP and CBFV (we will further explain and discuss the coherence below) in approximately 10% of all spontaneous oscillation recordings (Reinhard et al, 2003b). In this situation, augmented oscillations are expected to increase coherence between BP and CBFV, and it will be necessary to induce these oscillations using repeated maneuvers as described above.
Quantifications of Dynamic Cerebral Autoregulation
After a change in BP, the relationship between CBF and BP has to be quantified. Here, we will discuss the methods that are most commonly used in clinical situations. These methods approach the relationship between BP and CBF as if it is linear. It should be noted that more complex mathematical models have been developed that allow for nonlinear dynamics (Mitsis et al, 2002).
In Table 1, we provide an overview of the different quantifications discussed below.
Overview of the various dynamic quantifications of cerebral autoregulation in the time domain
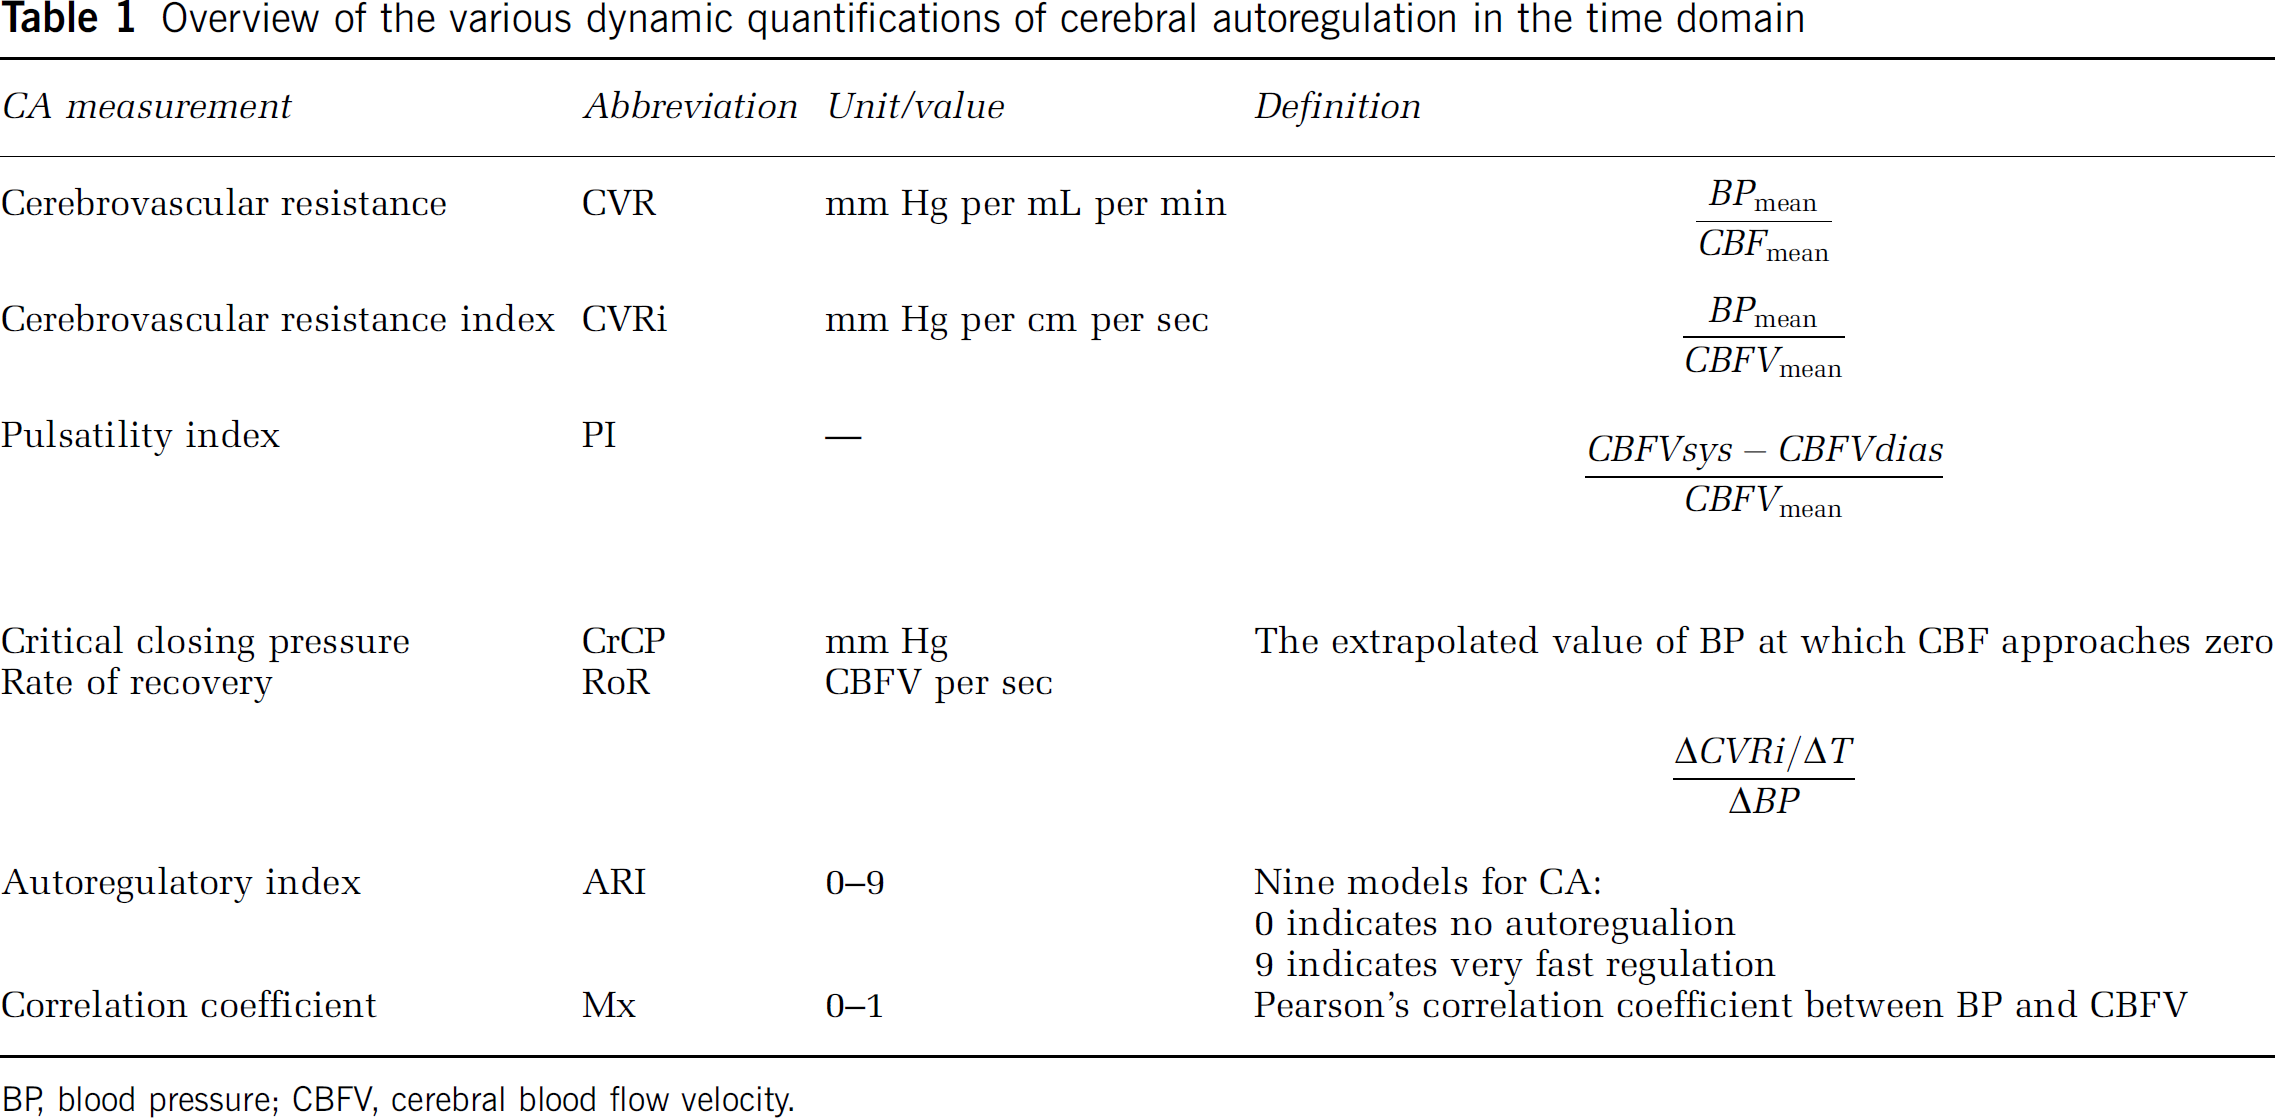
BP, blood pressure; CBFV, cerebral blood flow velocity.
Cerebrovascular resistance
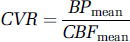
Linear system analysis facilitates the examination of the transfer of BP oscillations to CBF as a measure of autoregulation. It quantifies the extent to which the BP input signal is reflected in the CBFV output signal. The regulator between the input and output is the resistance of the small cerebral vessels distal to the site of insonation. According to Ohm's law, this resistance is defined as mean BP/CBF. Thus, CVR is defined by mean BP divided by mean CBF:
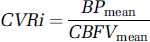
The use of CBF to calculate CVR takes into account the brain weight, whereas studies that use TCD and measure flow-velocity lack this tissue weight. These studies calculate the CVR index (CVRi), which is defined by the mean BP divided by mean CBFV:
Studies that use CBFV ideally would have to take into account the cross-sectional area factor between CBF and CBFV in addition to brain tissue weight in their estimates of CVR. Furthermore, it should be emphasized that the use of the ratio between BP and CBF (velocity) to represent CVR (index) corresponds to a model where the cerebrovascular circulation is characterized by a single parameter. This calculation infers from Ohm's law and is based on a number of hypotheses, and resistance is not measured directly.
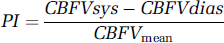
Gosling's pulsatility index (PI) is sometimes used to reflect CVR (Gosling et al, 1971). This index is defined as the difference between systolic and diastolic extremes of CBFV divided by the mean CBFV:
The PI changes with alterations in CVRi in the following manner. CVRi and the PI are both inversely correlated to CBFV in steady state (e.g., reduction in CVRi causes an increase in CBFV and a reduction in PI). Under these stable conditions, a quantitative relationship indeed exists between CVR and PI. However, during neurally mediated syncope, CVRi decreases, whereas the PI increases (Schondorf et al, 1997). Therefore, the PI cannot serve as an adequate parameter to assess dCA.
Another estimate for vasomotor resistance is the critical closing pressure, determined from the systolic—diastolic pressure—flow relationship within each heartbeat. The critical closing pressure of the cerebral circulation indicates the value of BP at which CBF is projected to approach zero (Panerai, 2003). This value is obtained by linear extrapolation of the BP and CBFV values in the systolic to diastolic range that were obtained within each cardiac cycle. The slope of this ‘intrabeat’ BP–CBFV curve is nonlinear, however, and therefore it remains uncertain if the true critical closing pressure can be accurately predicted by linear extrapolation. The critical closing pressure has not been validated in disease states or in elderly subjects, and further research will be necessary to determine if it could be a useful tool (for a review, we refer to Panerai, 2003).
Time Domain versus Frequency Domain
A linear system can be described in the time domain or in the frequency domain. We will first describe the techniques used in the time domain.
The time domain is used to describe the analysis of physical signals with respect to time. The signal's value is known at various discrete time points and a time domain graph shows how a signal changes over time.
Rate of recovery
The time of CBFV recovery after a single pressor or depressor stimulus is taken as a measure for the efficiency of dCA. One of the quantifications used in this approach is the rate of recovery. The rate of recovery is defined as the normalized changes in CVRi per second during a BP decrease (Aaslid et al, 1989):
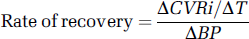
This rate uses CVRi in the calculation, but, as mentioned above, this does not take into account the cross-sectional area factor between CBF and CBFV and lacks brain weight.
Furthermore, this method has not been tested specifically in an elderly population.
Autoregulatory index
Using the alterations in CVRi in relation to the change in BP during thigh cuff maneuvers, Tiecks et al (1995a) introduced the autoregulatory index. For an observed decrease in BP, a hypothetical CBFV curve without autoregulation is calculated. Eight other different computer models of possible flow-velocity curves are calculated as well, each assuming a higher degree of dCA. An autoregulatory index of 0 indicates that CBFV passively follows BP (in other words, the percentage change in CBFV is equal to that of BP); a value of 9 indicates that CBFV recovers much faster than BP.
Panerai et al (1998) showed that this model can also be used to grade autoregulation using baseline recordings of BP and CBFV, estimating the impulse response function. This function expresses the relationship between BP and CBFV after a very short, impulse-like disturbance in BP.
The autoregulation index has been applied in elderly subjects with hypertension, stroke, and carotid sinus syndrome (see section on CA in aging and comorbidity).
Correlation index
In patients with head injury, Czosnyka et al (1996) calculated Pearson's correlation coefficients between consecutive samples of averaged cerebral perfusion pressure and flow velocity for every 3-min period determining a correlation index known as ‘Mx.’ Lang et al (2003) showed that this index is valid if BP is used instead of cerebral perfusion pressure in these patients. This obviates the need for the invasive measurement techniques to determine intracranial pressure. Presently, however, the Mx has not been validated in nonbrain trauma patients, and the proposed cutoff values were not valid in healthy subjects (Yam et al, 2005).
The Frequency Domain
In the frequency domain, physical signals are described with respect to frequency.
In Figure 2 we illustrate two signals that show clear repetitive patterns over time. In fact, they can be described as two sinusoidal waveforms (oscillations) with a given period, T, and amplitudes A and B. The frequency in hertz (Hz) is calculated from the period:

Giller was the first to use frequency domain analysis to describe the relation between oscillatory patterns of BP and CBFV (Giller, 1990).
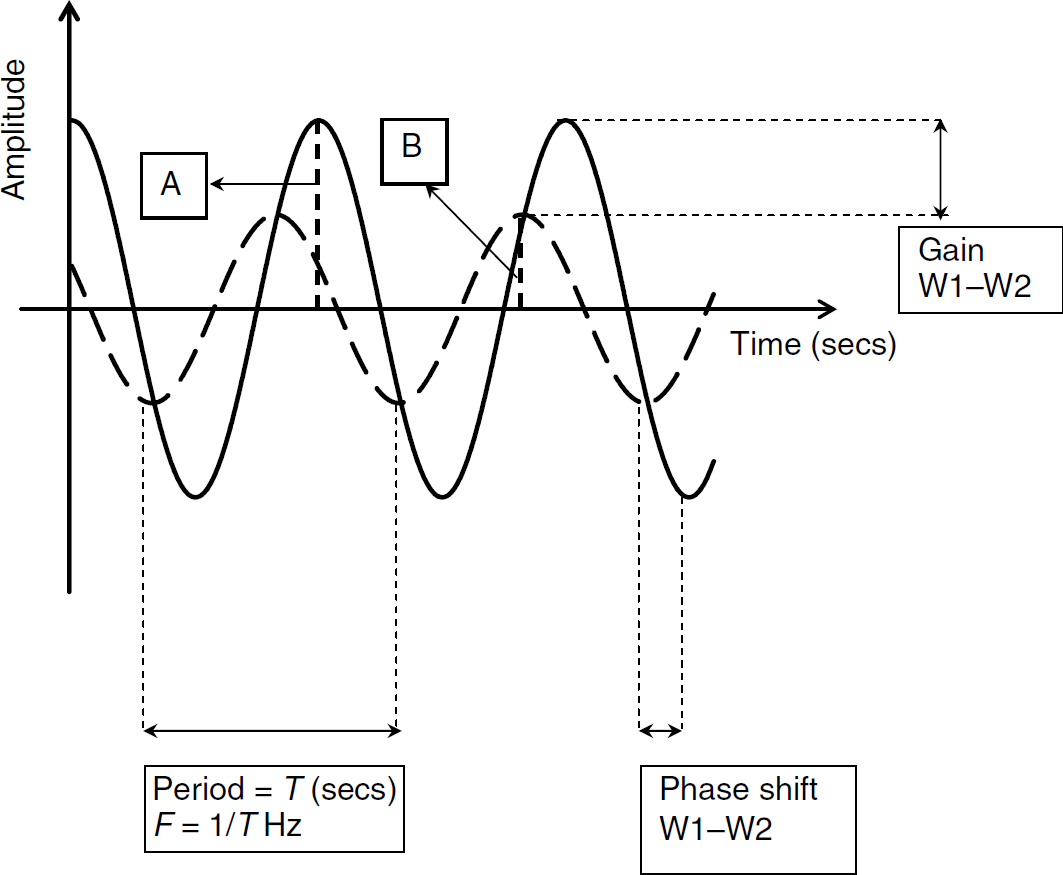
Transfer function analysis. Graphical explanation of the concept of transfer function analysis. Two sinusoidal waveforms with the same period (T) are presented. Waveform frequency (F) is defined as 1/T. (
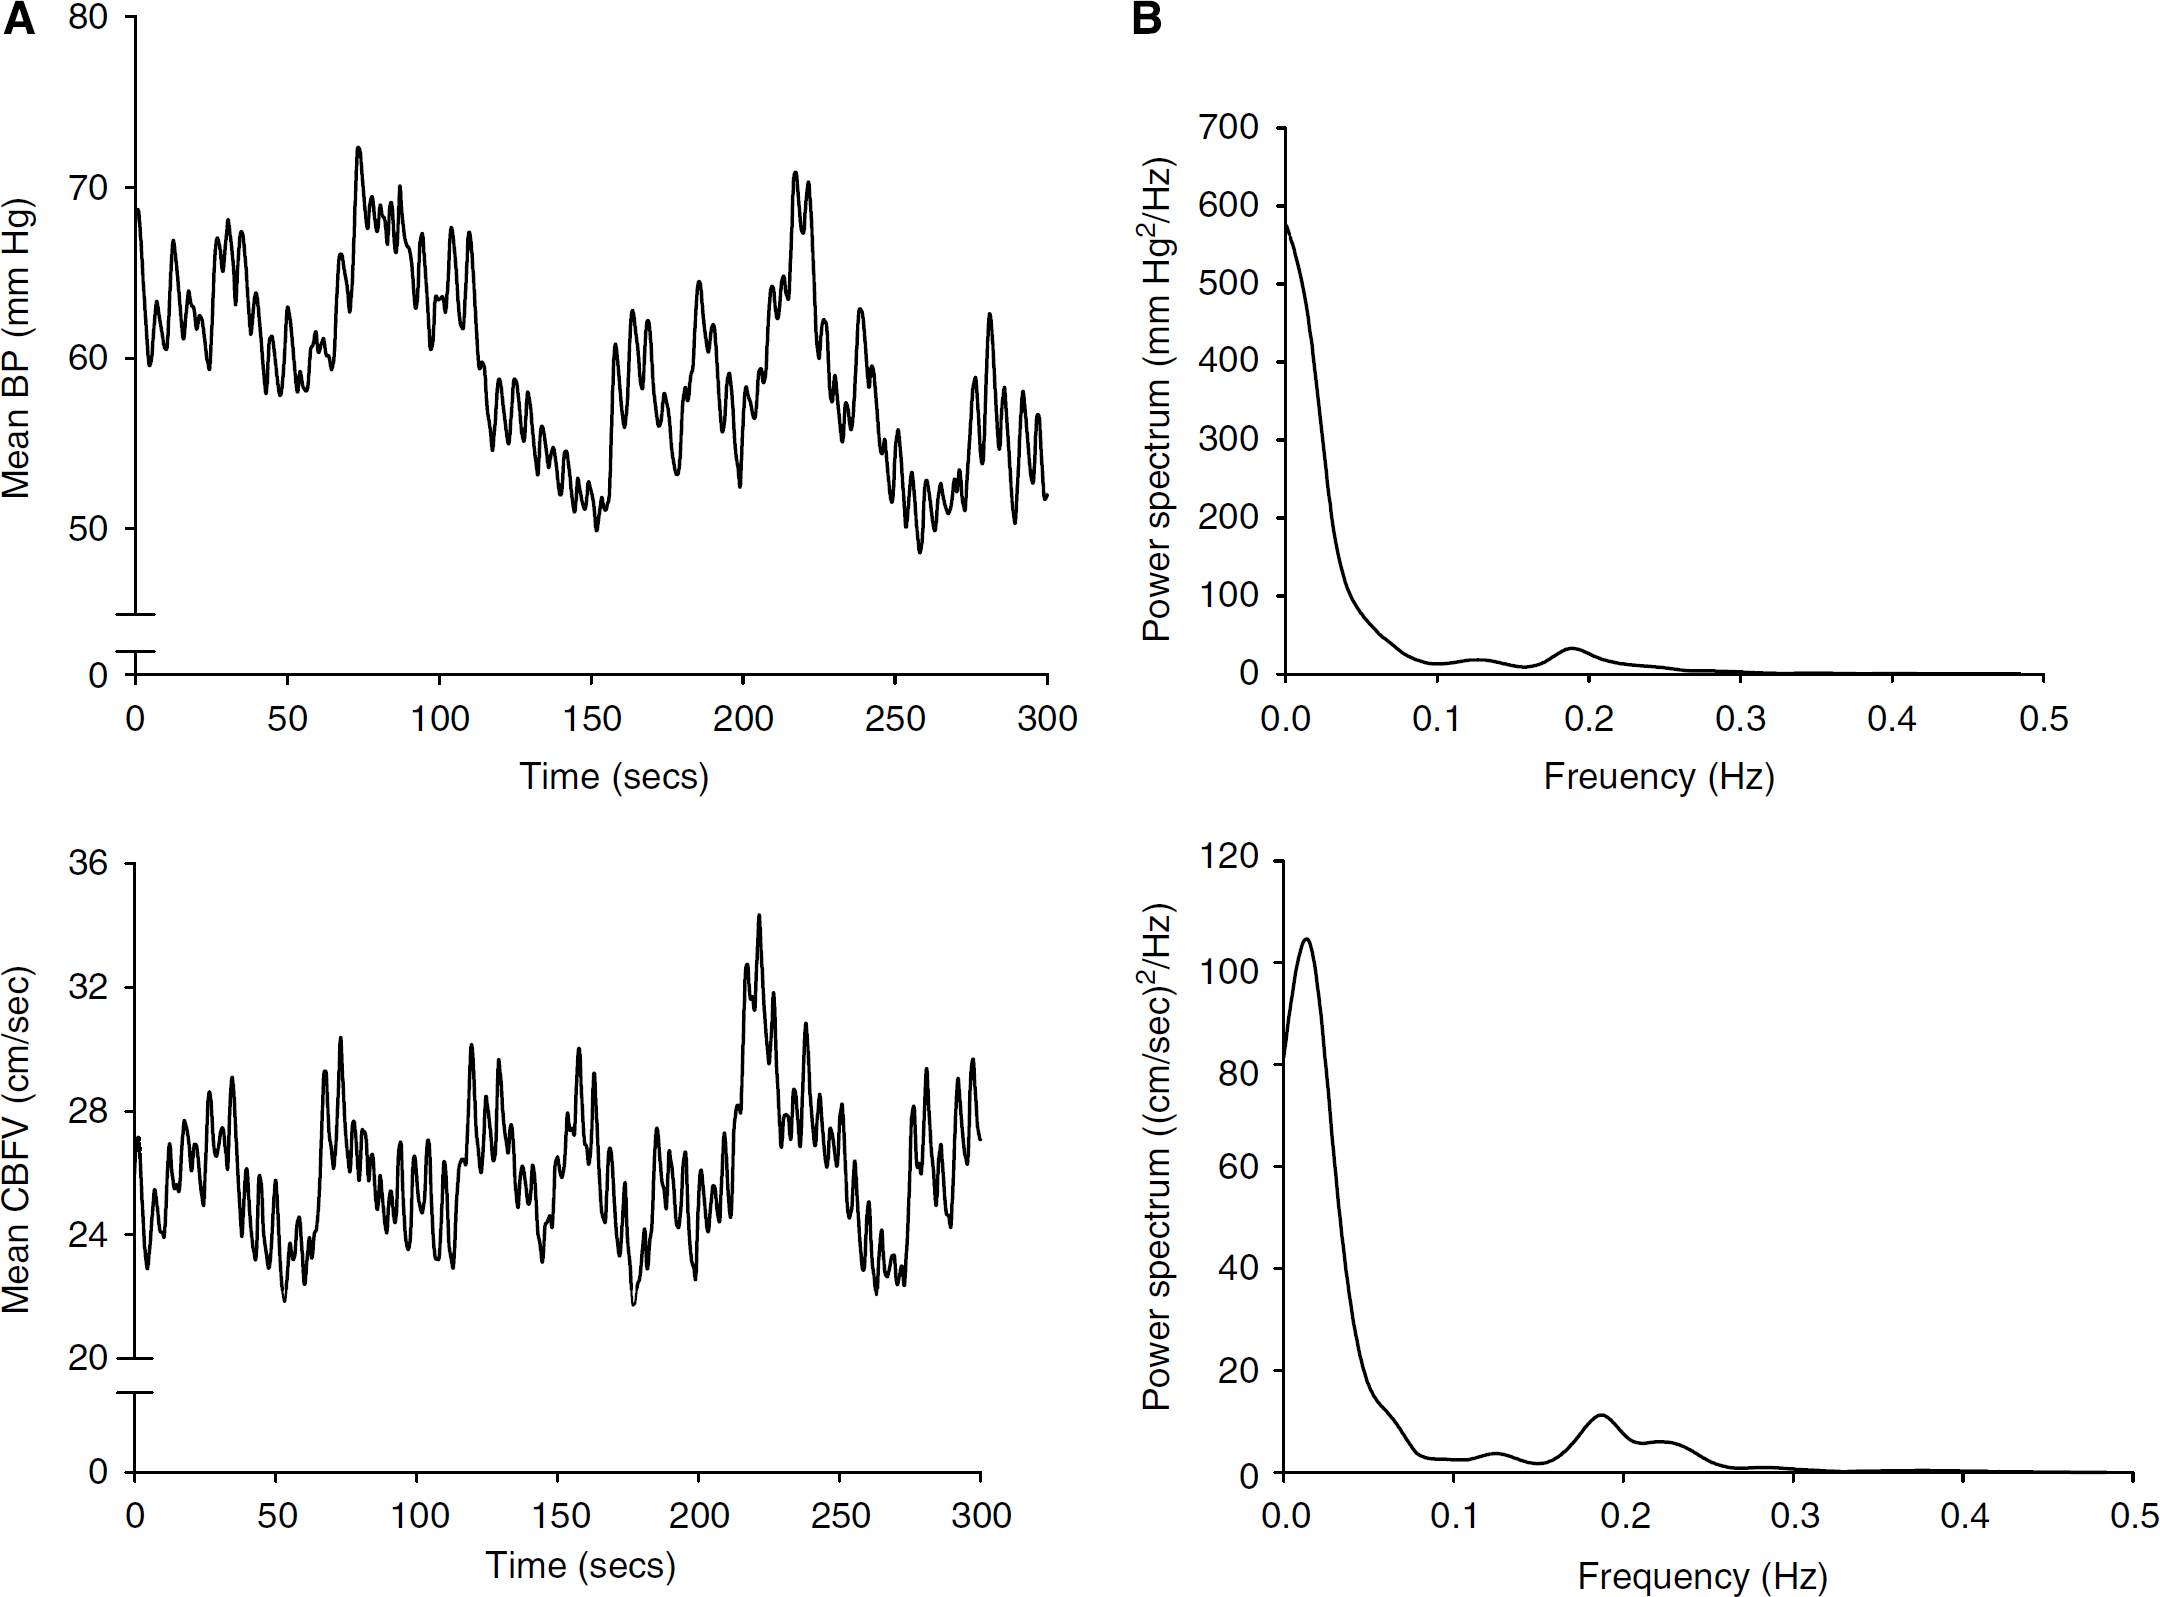
In Figure 3A, we present an example of the spontaneous oscillations in BP and CBFV recorded in a healthy old subject over a period of 5 mins of rest in sitting position. The signals are composed of several different oscillations with different periods (and thus frequencies) and amplitudes. Spectral analysis makes it possible to create the frequency domain graph that shows the frequency spectrum of these different oscillations that are hidden in the signal. In Figure 3B, we illustrate the power spectra of the two signals presented in Figure 3A. A power spectrum is a frequency graph that describes how much of the signal lies within a given frequency.
(
In the frequency domain analysis, the regulation of CBF in response to changes in BP can be described using transfer function analysis. Transfer function analysis makes it possible to examine the transfer of the BP oscillations to CBF as a measure of autoregulation. It quantifies the extent to which the input signal, BP, is reflected in the output signal, CBF, with CA as the regulator between the input (BP) and output (CBF).
The regulation of CBFV is effective in the low-frequency range of BP fluctuations, but not in the high-frequency range because of the time delay required to initiate cerebrovascular adaptations to the changes in perfusion pressure. Therefore, CA functions like a high-pass filter, allowing rapid BP changes to be transmitted to CBFV, whereas slow BP changes are filtered. Cerebral blood flow velocity in relation to BP can therefore be expressed by transfer function analysis using a high-pass filter model in the frequency range of 0.07 to 0.30 Hz (Zhang et al, 1998; Diehl et al, 1998).
Gain, phase, and coherence
The transfer function between the oscillations in BP and CBFV in this autoregulatory system is characterized by three parameters: gain (or magnitude), phase shift, and coherence.
The gain, or transfer magnitude, quantifies the damping effect between the input and output of the transfer function. Provided that in Figure 2, waveform 1 is the input and waveform 2 is the output of the transfer function, the regulator in this system attenuates the amplitude of the input (A), yielding a low value for gain.
In the transfer function between BP and CBFV, the gain represents the damping effect of CA on the magnitude of the BP oscillations. The gain of this transfer function marks the efficiency of the regulator, which is the response of CA. A low gain indicates an efficient autoregulation, whereas an increase in gain represents a diminished efficiency of the dynamic process of CA. According to the high-pass filter model of CA, the gain rises with increasing frequencies of BP oscillations (Hamner et al, 2004).
A specific problem in the interpretation of gain is that absolute measures of gain (estimated from transfer function analysis of absolute changes in CBFV and BP) are influenced by baseline values of CBFV and BP. Especially for CBFV, interindividual differences can be substantial and reflect the differences in MCA diameter rather than baseline differences in flow. Therefore, normalization of gain has been proposed. This can be achieved by substituting gain by the product of gain and CVR, named normalized gain. If the CVRi is determined from averaged baseline values for BP and CBFV, normalized gain is mathematically similar to gain calculated from relative changes in BP and CBFV (Holstein-Rathlou et al, 1991; Blaber et al, 1997).
The second parameter of the transfer function we will discuss is the phase shift. Synchronous waveforms are ‘in phase.’ The phase shift of a waveform therefore represents the displacement of this waveform relative to another waveform with the same period (Figure 2). The phase shift can be expressed in degrees from 0° to 360°, or in radians from 0 to 2 π, thus ranging from no phase shift to a phase shift of one full period. The phase shift can be recalculated to a time difference between two signals: a 90° phase shift between two signals with 10-sec periods equals a time delay of 2.5 secs between these signals.
The oscillations of CBFV do not occur simultaneous to those of BP. Changes in CBFV recover faster than the changes in BP, which causes a displacement of CBFV relative to BP in such a manner that CBFV oscillations appear to lead BP oscillations. This is interpreted as intact dCA (Kuo et al, 2003). In relation to BP, this leftward shift is mathematically negative. However, in literature, the phase shift between BP and CBFV is often given as a positive number and is defined as a ‘phase lead’. A positive phase indicates an intact CA, whereas in patients with a complete loss of CA, the phase shift between CBFV and BP is expected to be close to 0°. In a clinical population of patients with carotid stenosis or occlusion, phase shifts were significantly lower than in normal subjects and could sometimes approach 0° (Diehl et al, 1995; Reinhard et al, 2003a).
Phase shifts can be considered surrogate measures for the time delay of the autoregulatory response. When we translate the phase shift to the time domain, a phase shift of 0 means no time delay between oscillations of BP and CBFV.
The measurement of phase shifts and gain is applicable to all stationary models that induce oscillatory BP and CBFV changes, and these parameters have an apparent relationship to the rate of autoregulation. During induced oscillations in the three frequencies regions (the high, >0.2 Hz; low, 0.07 to 0.20 Hz; and very low frequencies, <0.07 Hz), the gain values increased and the phase shifts decreased with increasing frequency (Hamner et al, 2004). Analysis of spontaneous oscillations yielded the same results (Zhang et al, 1998; Diehl et al, 1998). These results all confirm the high-pass filter model of dynamic CA. In assessing dCA, gain should be calculated in combination with phase shifts. For the calculation of phase shifts during an short, nonstationary BP/CBFV response, multimodal pressure—flow analysis has been introduced as a mathematical tool (Novak et al, 2004).
The third parameter of the transfer function the coherence function tests the linearity of the relation between input and output. Coherence approaching unity in a specific frequency range suggests a linear relationship in this domain, whereas coherence approximating zero may indicate no relationship between the signals. However, a low coherence could also indicate severe extraneous noise in the signals (Marmarelis, 1988; Giller, 1990). Therefore, for the calculation of phase shifts and gain values, thresholds of coherence of >0.4 or >0.5 have been used by most researchers (Zhang et al, 1998; Diehl et al, 1998). Conversely, low coherence can also be an expression of the nonlinear qualities of dCA, and the validity of using these cutoff and maximum points is debatable (Panerai et al, 2006). A solution to this limitation is to induce oscillatory changes in BP and CBFV. Several maneuvers (as described above) induce oscillations. These enlarge the power of the oscillations and thereby the coherence of the transfer function (Hamner et al, 2004). These maneuvers can be performed in the different frequency regions. Another possible solution is nonlinear analysis and the use of more complex mathematical models.
In accordance with the high-pass filter model of dCA, in healthy older people, values of coherence and gain are the highest in the high-frequency region of BP oscillations and the lowest in the very low frequency region, whereas phase shifts are the highest in the very low frequency region and the lowest in the high-frequency region (Zhang et al, 1998; Lipsitz et al, 2000; Narayanan et al, 2001).
Dynamic Cerebral Autoregulation in Elderly Subjects
Healthy Elderly
To include all the literature regarding the dynamic process of CA in healthy elderly subjects, we performed a literature search with the following search terms: cerebrovascular circulation, cerebrovascular disorders, and aged. Furthermore, we used free text words, aging, ageing, elderly and the truncated free text words cerebr∗ and autoreg∗. We found eight studies that have investigated dCA in healthy elderly subjects (Carey et al, 2000, 2003; Franke et al, 2006). These studies compared the autoregulatory capacity of healthy young subjects with healthy aged people. An overview of these studies is presented In Table 2. The age range was 50 to 75 years. All studies measured BP and assessed CBFV in the MCA, using TCD; one study also measured CBFV in the posterior cerebral artery (PCA) (Sorond et al, 2005). Unfortunately, important methodological differences exist among these studies in the measurements and assessments of dCA.
Dynamic cerebral autoregulation in healthy elderly people
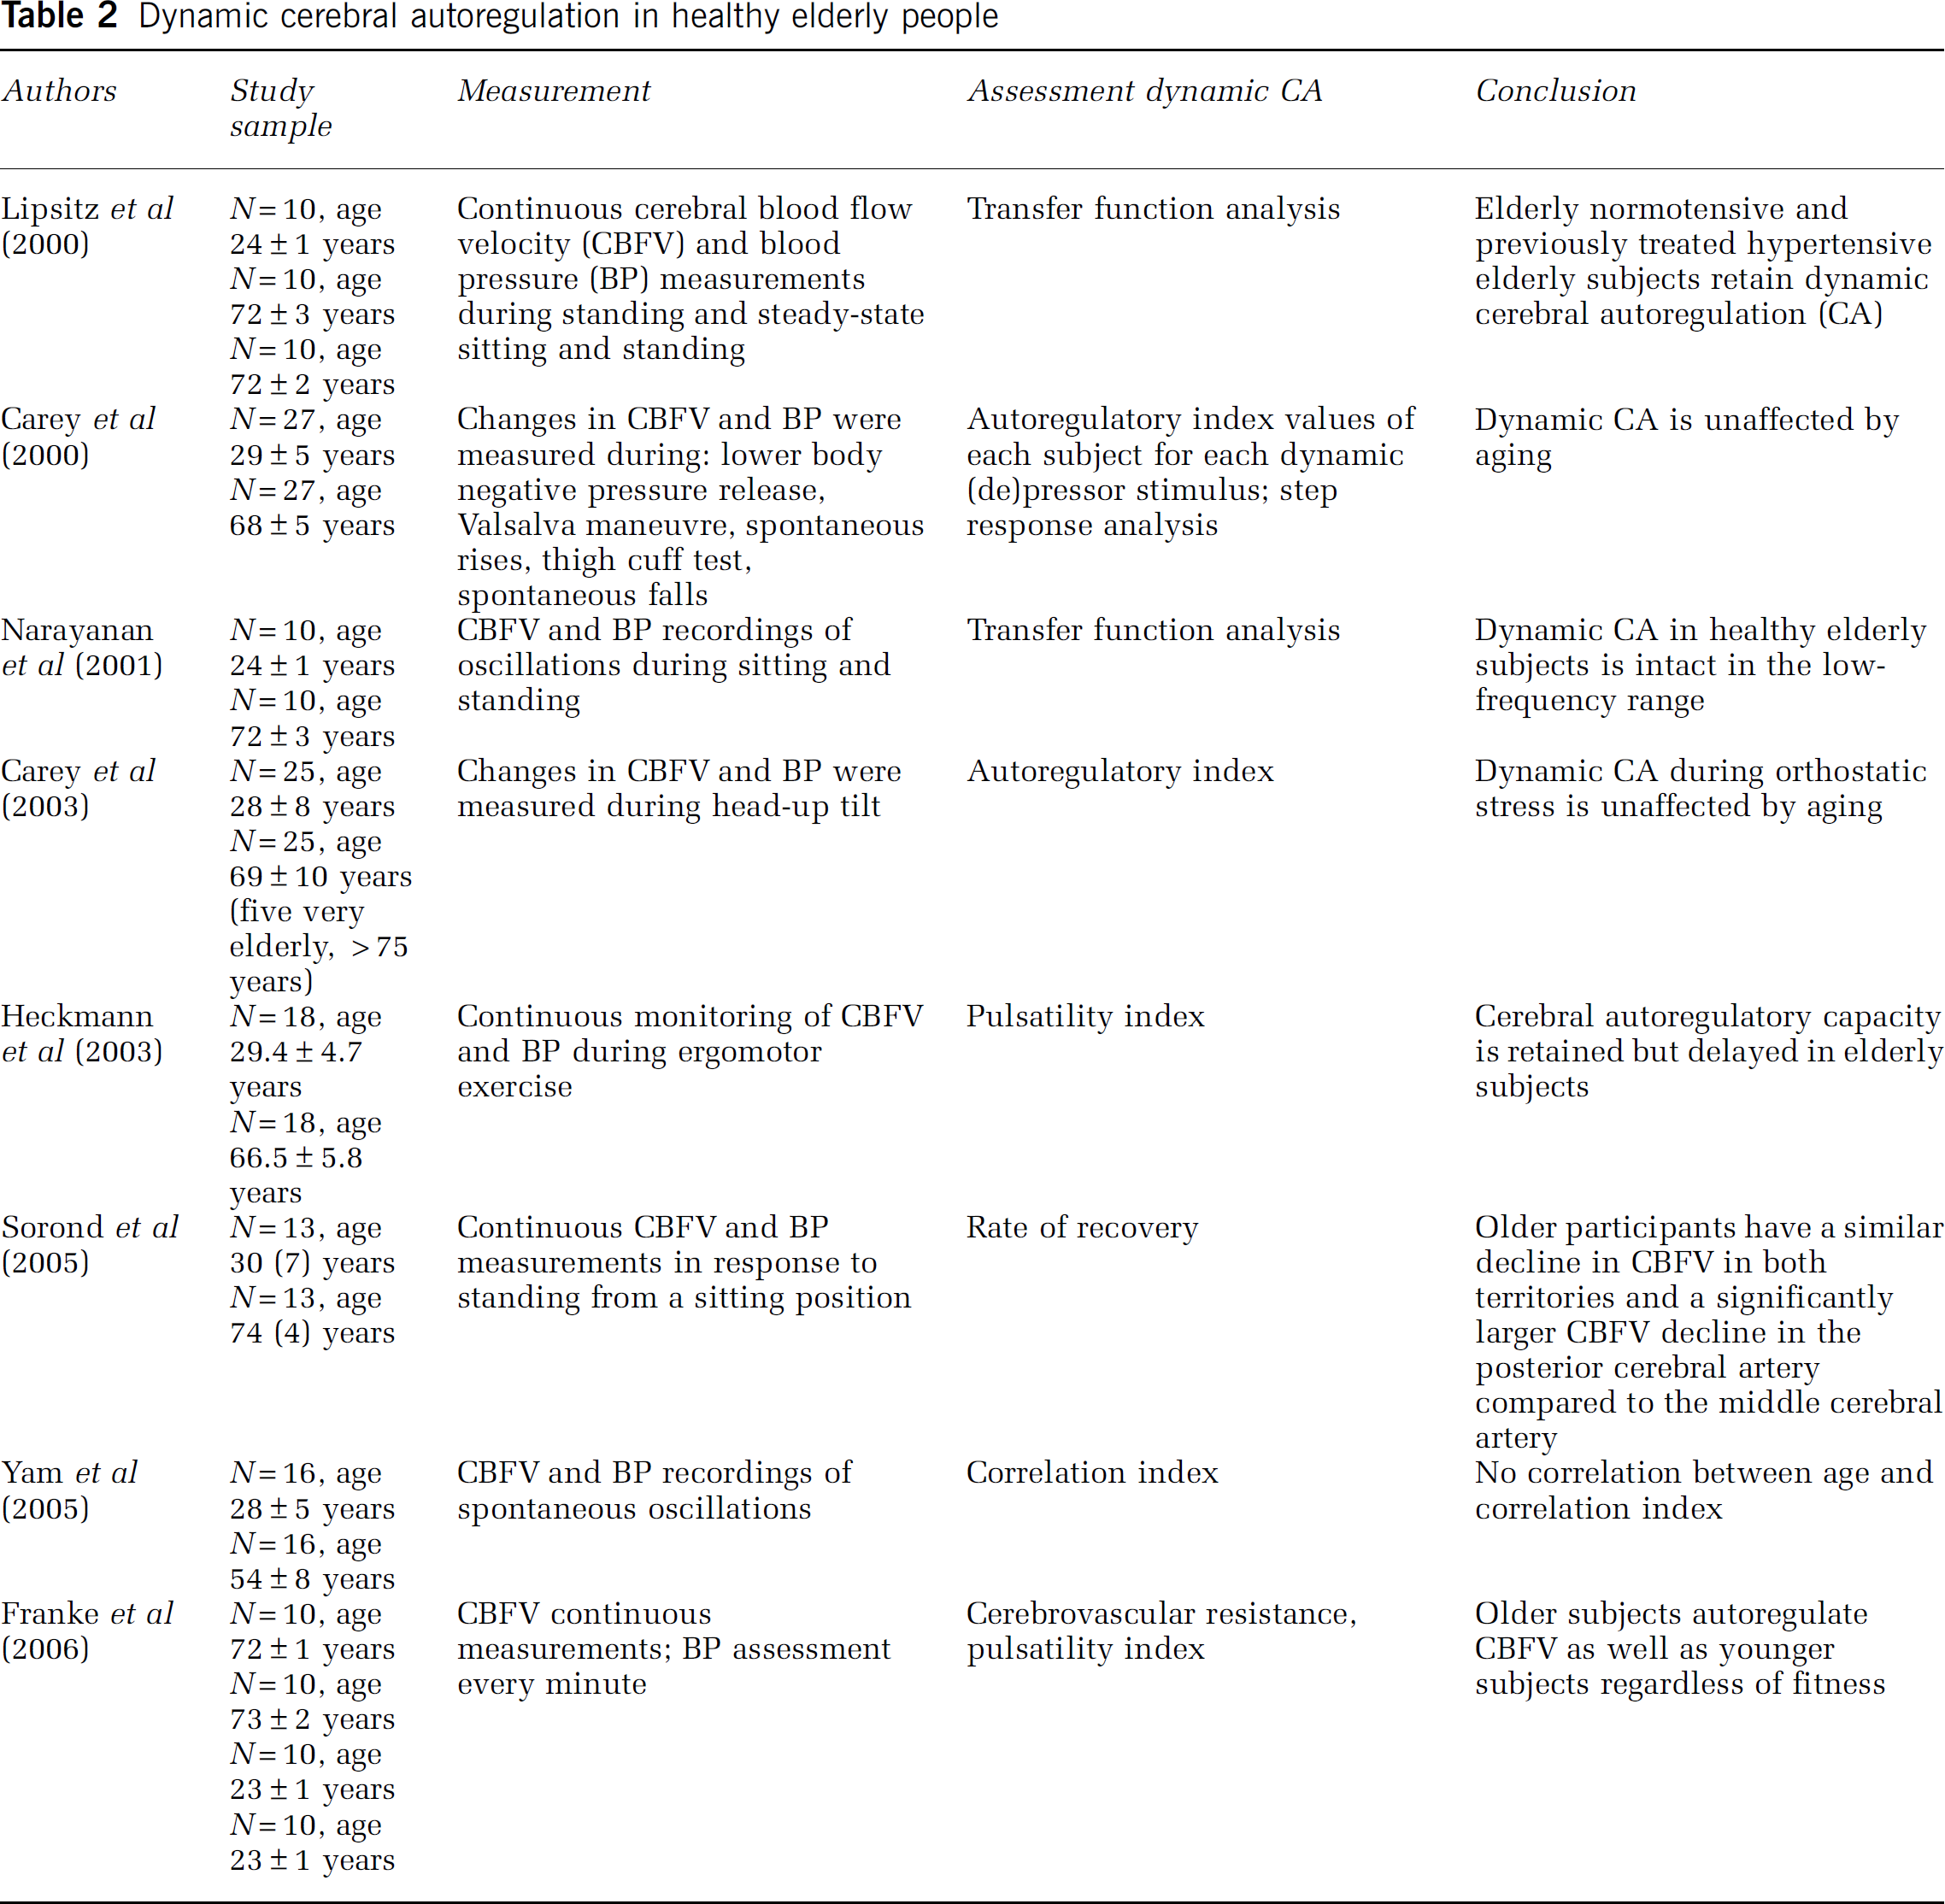
Different investigators measured spontaneous oscillations of BP and CBFV during sitting and standing, and calculated transfer functions (resulting in values of gain, phase shifts, and coherence) in elderly people (Lipsitz et al, 2000; Narayanan et al, 2001). Yam et al (2005) also made use of spontaneous BP and CBFV recordings in moderately aged people, but these investigators calculated the correlation index between BP and CBFV. Sorond et al (2005) measured BP and CBFV in elderly subjects during a sit-to-stand procedure and evaluated the rate of recovery of CBFV. Carey et al (2000, 2003) used lower body negative pressure, the Valsalva maneuver, spontaneous oscillations, the thigh cuff test and head-up tilt to induce BP changes, and for each test they assessed the autoregulatory index. These investigators measured dCA in 25 aged subjects, including five subjects >75 years. Heckmann et al (2003) determined dCA during ergomotor exercise in older subjects and calculated the PI. Franke et al (2006) assessed the PI in two different groups of elderly people; one group of fit elderly subjects and another group of frail elderly subjects. They measured CBFV continuously, but assessed BP only once every minute. To determine dCA, BP should ideally be measured continuously.
Regardless of the method by which it was assessed, all studies concluded that in healthy aged subjects, dCA is preserved during induced decreases in BP and during spontaneous oscillations in BP in the low-frequency range (0.07 to 0.20 Hz). In the high-frequency range (>0.15 Hz), dCA is less efficient in both young and older people (Lipsitz et al, 2000). This is in agreement with the concept that the relationship between CBFV and BP can be expressed by transfer function analysis using a high-pass filter model (see above). The studies that calculated changes in the CVRi and the PI also concluded that cerebral autoregulatory capacity is retained, regardless of physical fitness (Heckmann et al, 2003; Franke et al, 2006). However, these investigators noted that the change of the PI in healthy elderly is delayed during ergomotor exercise compared with young subjects (Heckmann et al, 2003). The CVRi and the PI only have a quantitative relationship under stable conditions, and therefore these parameters are difficult to interpret during exercise.
Most investigators studied dCA in the MCA, but the PCA can also be insonated with the TCD, (Aaslid et al, 1982) and dCA can be investigated in the posterior circulation. Sorond et al (2005) observed that CBFV in the PCA declined to a greater extent than in the MCA. In both young and aged humans, the characteristics of dCA in the PCA differ from that in the MCA. The regulation of CBFV in the PCA to spontaneous BP oscillations acts as a high-pass filter similar to the MCA (Haubrich et al, 2004). The phase shifts in the PCA suggest that the latency of CA is sufficient, as it is in the MCA territory, but in all frequency ranges, the gain values in the PCA were significantly higher compared with the values in the MCA. These higher magnitudes do not necessarily indicate an inefficient autoregulation in the PCA, considering the similar phase shifts. This dissimilarity in gain more likely is reflective of the different resonance properties of the two vascular beds and of the combination of different flow and different vessel diameters; flow-velocity in the MCA is approximately 1.5 times higher than in the PCA (Haubrich et al, 2004; Sorond et al, 2005).
In summary, no evidence was found for an effect of aging on dCA in the age ranges studied (50 to 75 years). Whether dCA is preserved at more advanced age (>75 years) is at present unknown.
CA in Aging and Comorbidity
With TCD, CBFV can be measured during gradual and prolonged changes in BP, cf. the classic method to determine CA (Larsen et al, 1994). Under normal conditions, the upper and lower limits of CA are found at 60 and 150 mm Hg mean arterial pressure, respectively. The important difference between the measurement of classic and dynamic CA is that the classic measurements are performed in the semi-steady state and that the use of vasoactive medication is necessary to drive these prolonged changes in BP. In contrast to this approach, dCA measures flow changes in response to BP fluctuations that are mostly within the limits of autoregulation.
In one study in normal human subjects, dynamic measurement of CA yielded results similar to static testing under conditions of intact autoregulation and following pharmacologically induced impairment of autoregulation (Tiecks et al, 1995a). However, very few studies have combined estimations of sCA and dCA. Therefore, further research should combine sCA and dCA and attempt to describe the behavior of dCA around the lower and upper limits of BP as identified by the classic sCA curve.
However, for clinical applications, dynamic measurements of CA are probably the method of choice. This practice is noninvasive and less prolonged, it could be performed at bedside, and pharmacological interventions are not necessary.
Diseases such as acute ischemic stroke may bilaterally impair sCA leaving the brain tissue unprotected against the potentially harmful effect of BP changes (Paulson et al, 1990). Stroke is more common in older subjects, and 72 to 96 h after an acute stroke, dCA is bilaterally impaired, rendering CBFV dependent on BP (Dawson et al, 2000; Eames et al, 2002). Reinhard et al (2003a2003b, 2005) found no major disturbance of dCA after 4 to 48 h after stroke. However, after 72 to 171 h, they found a trend toward poorer autoregulatory values. Therefore, it could be argued that in poststroke patients, BP should be well controlled to stabilize CBF and to prevent cerebral hyperperfusion or ischemia. However, which levels of BP are acceptable in the acute stroke phase, and to which level BP can or should be lowered, is still uncertain (Spengos et al, 2006).
Further research addressing the dynamic pressure—flow relationship in acute stroke may help to shed light on this important issue.
For hypertensive patients, estimations of CA offer a simple method to evaluate not only the effect of hypertension but also the effect of antihypertensive treatment on cerebral perfusion. Because of an upward shift of the lower limit of the sCA curve toward higher pressure, and with this, a possible impaired tolerance to a decline in BP, a conservative approach in elderly patients with hypertension has been suggested (Strandgaard, 1991). However, classic studies of sCA have shown that this rightward shift with hypertension undergoes a leftward shift with treatment (Barry and Lassen, 1984). Indeed, with dCA, middle-aged and elderly (<75 years) hypertensive patients were found to retain the ability to maintain CBFV in the face of acute BP changes, assessed by the autoregulatory index during different maneuvers (Eames et al, 2003). Using the autoregulatory index during the Valsalva maneuver, Novak et al (2004) did not find any difference between healthy normotensive and hypertensive middle-aged subjects. However, when they used the multimodal pressure—flow analysis, they observed a smaller phase shift pointing toward less efficient autoregulation in the hypertensive group. In patients with controlled hypertension, the cerebral autoregulatory response was preserved (Fu et al, 2005). In newly diagnosed middle-aged patients with untreated mild-to moderate hypertension, dCA was normal. Short- and long-term reduction of BP did not compromise dCA (Zhang et al, 2007). Furthermore, in uncontrolled hypertensive patients with a mean age of 72 years, 6 months of successful, aggressive treatment with antihypertensive therapy increased CBFV significantly compared with controlled hypertensive patients and healthy controls (Lipsitz et al, 2005). This therapy did not impair dCA assessed with an active sit-to-stand procedure.
Autoregulation studies can contribute valuable clinical information regarding CBF control by identifying or confirming patients at high risk for impaired cerebral perfusion. Transient cerebral hypoperfusion can lead to syncope, which is a common medical problem in the elderly (Rubenstein and Josephson, 2002). In addition, many older patients are vulnerable to cerebral hypoperfusion after orthostatic BP decreases (Mehagnoul Schipper et al, 2000). The combined mechanisms of (baroreflex mediated) BP regulation and CA limit the reduction of the cerebral perfusion induced by the postural position. However, if, despite these protective mechanisms, cerebral perfusion becomes impaired, symptoms of orthostatic hypotension such as dizziness and syncope occur (Carey et al, 2001). For recurrent falls among elderly subjects, orthostatic hypotension is an independent risk factor, but orthostatic hypotension alone may not be sufficient to produce symptoms like falls in most elderly patients (Ooi et al, 2000). In contrast, decreases in standing BP that are smaller than the formal definition of orthostatic hypotension (a decrease of 20 mm Hg or more) may exceed the threshold for CA in some patients and therefore be sufficient to cause cerebral hypoperfusion. In many patients with orthostatic hypotension, BP remains within the autoregulatory range. Because of CA, the effect of a given change in BP on cerebral perfusion cannot be predicted.
Conclusion
Classic studies regarding CA are performed in the semi-steady state, and they measure CBF after a persistent change in BP with a gradual onset. In contrast, recent studies have investigated the fast modifications of CBF in relation to rapid changes in BP. Technological developments, such as TCD and servo-controlled finger photoplethysmography, have offered the possibilities to investigate more thoroughly the dynamics of the process of CA. This dynamic approach is the most promising approach for the clinical evaluation of CA. These measurements are less time consuming, entirely noninvasive, and could be performed at bedside.
However, no uniform method exists to assess the dynamic cerebral autoregulatory capacity of the human brain. Researchers have introduced several techniques to challenge CA, ranging from a single episode of induced hypotension to induced oscillatory changes in BP, and additionally have used spontaneous BP oscillations to quantify dCA. The quantifications used vary from calculated indices using regression analysis to rate of CVR changes and to transfer function analysis. We have provided an overview of the various methods applied to study CA dynamically.
Subsequently, we have reviewed the literature regarding dCA in healthy elderly subjects. Regardless of the assessment used, dCA is preserved in healthy elderly subjects <75 years. Owing to this intact dCA, a lowering of BP should not influence CBF. However, in diseases affecting the elderly, symptoms of cerebral hypoperfusion are frequent. Testing the dynamic cerebral autoregulatory capacity could be a promising tool to determine the risk of hypoperfusion and ischemia of the brain.
To determine dCA during orthostatic stress, the sit-to-stand procedure is a feasible method in elderly patients. Baseline measurements of spontaneous fluctuations in BP and CBFV are elegant measurements to assess dCA and ask little of the patient. If the magnitude of the spontaneous oscillations in BP is not high enough to assess dCA (i.e., coherence is <0.4), it may be necessary to induce oscillations with any of the methods described above. In both situations, CBFV in relation to BP can then be expressed by transfer function analysis using a high pass-filter model resulting in values of gain, phase, and coherence. More clinical studies are necessary to investigate the effect of a truly old age (80 years and older) and comorbidity on the dynamic pressure—flow relationship. At present, technological developments have given good prospects to study this relationship in the elderly population.