
Abstract
C57BL/6 mice have more cerebral arterial branches and collaterals than BALB/c mice. We measured and compared blood flow dynamics of the middle cerebral artery (MCA) in these two strains, using noninvasive optical imaging with indocyanine green (ICG). Relative maximum fluorescence intensity (
Keywords
INTRODUCTION
BALB/c mice have more severe tissue damage, and take longer to recover from stroke than C57BL/6 mice.1,2 These differences have been attributed to disparities in branch density and collateral interconnections of the cerebral vasculature. 3 Anatomically, C57BL/6 mice have more collateral anastomoses than other mouse strains; 4 however, there is little physiological data showing differences in cerebral blood flow (CBF) dynamics between BALB/c and C57BL/6 mice.
Measurement of CBF is important for the diagnosis and monitoring of vascular diseases. The fluorescent dye indocyanine green (ICG) can be used to measure CBF, and can significantly enhance the signal-to-noise ratio. Moreover, the kinetics of the ICG bolus can improve the detection of deep organs and tissue blood flow in experimental animals5,6 and humans.7,8 A recent study showed that near infrared imaging of ICG fluorescence, combined with a time-series analysis of its molecular dynamics, can be useful for CBF analysis. 9
Thus, in the current study, we visualized blood flow in the cerebral arteries and venous sinuses using ICG-optical imaging, and measured several features of blood flow dynamics to assess CBF differences in cerebral arteries of BALB/c and C57BL/6 mice.
To the best of our knowledge, this is the first study showing differences in CBF in two mouse strains.
MATERIALS AND METHODS
Animal Preparation
Eight-week-old male BALB/c and C57BL/6 mice were obtained from Daehan Biolink (Gyeonggi-do, Republic of Korea). In these two mice strains, males have the same blood pressure. 10 Animals were anesthetized with ketamine (0.1 mg/g wt) and xylazine (0.01 mg/g wt). We measured systemic physiologic parameters of blood relevant for resting CBF (Supplementary Information S1). Body temperatures were monitored by a rectal probe, and maintained at 37°C using a temperature-controlled heating pad (Harvard Apparatus, Holliston, MA, USA). All procedures were approved by the Institutional Animal Care and Use Committee of the Kyung Hee University. We performed all experimental procedures and handled experimental animals according to the ARRIVE guidelines (http://www.nc3rs.org.uk/ARRIVE). 11
Indocyanine Green Imaging
Under anesthesia, an incision was made to expose the entire skull. Then, mice were placed under an 830-nm band-pass filter CCD camera. A solution (40 μL) of ICG (0.001 mg/g wt) was injected manually into the tail vein (the rate of injection: 80 μL/s) using a 31-gauge needle, and the head was illuminated with 760 nm wavelength lights. Time series of ICG fluorescence signal was acquired every 160 ms for 2 minutes. Using a customized software (Vieworks Co., Ltd., Anyang, Republic of Korea), the initial 100 frames were used to generate blood flow maps as previously reported by Ku
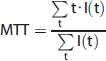
The
After adjusting the baseline intensity to zero, the following equation was applied:
Statistical Analysis
Data are given as the mean ± s.e.m. for
RESULTS
Structural Differences in the Arterial Tree between BALB/c and C57BL/6 Mice
Two minutes after intravenous ICG injection, raw images were acquired and streamed to a computer. In the raw fluorescent image, blood vessels appeared as bright areas. We made a representative movie to show the kinetics of blood flow (Supplementary Information S2). From the serial images, we created a filtered time-series stack image, and noticed that the number of distal arterial branches appeared to differ between BALB/c and C57BL/6 mice during angiographic analyses (Figure 1A). Therefore, we measured the number of branching points from the middle cerebral artery (MCA) and anterior cerebral artery. After magnifying the image on the monitor, we delineated the arterial trees on the overlying layer. The vessels delineated in this image were analyzed using ImageJ and the Skeleton plugins (http://rsbweb.nih.gov/ij/). Our data showed that C57BL/6 mice had significantly more branching points (20.5±2.195) than BALB/c mice (10±1.065) (**
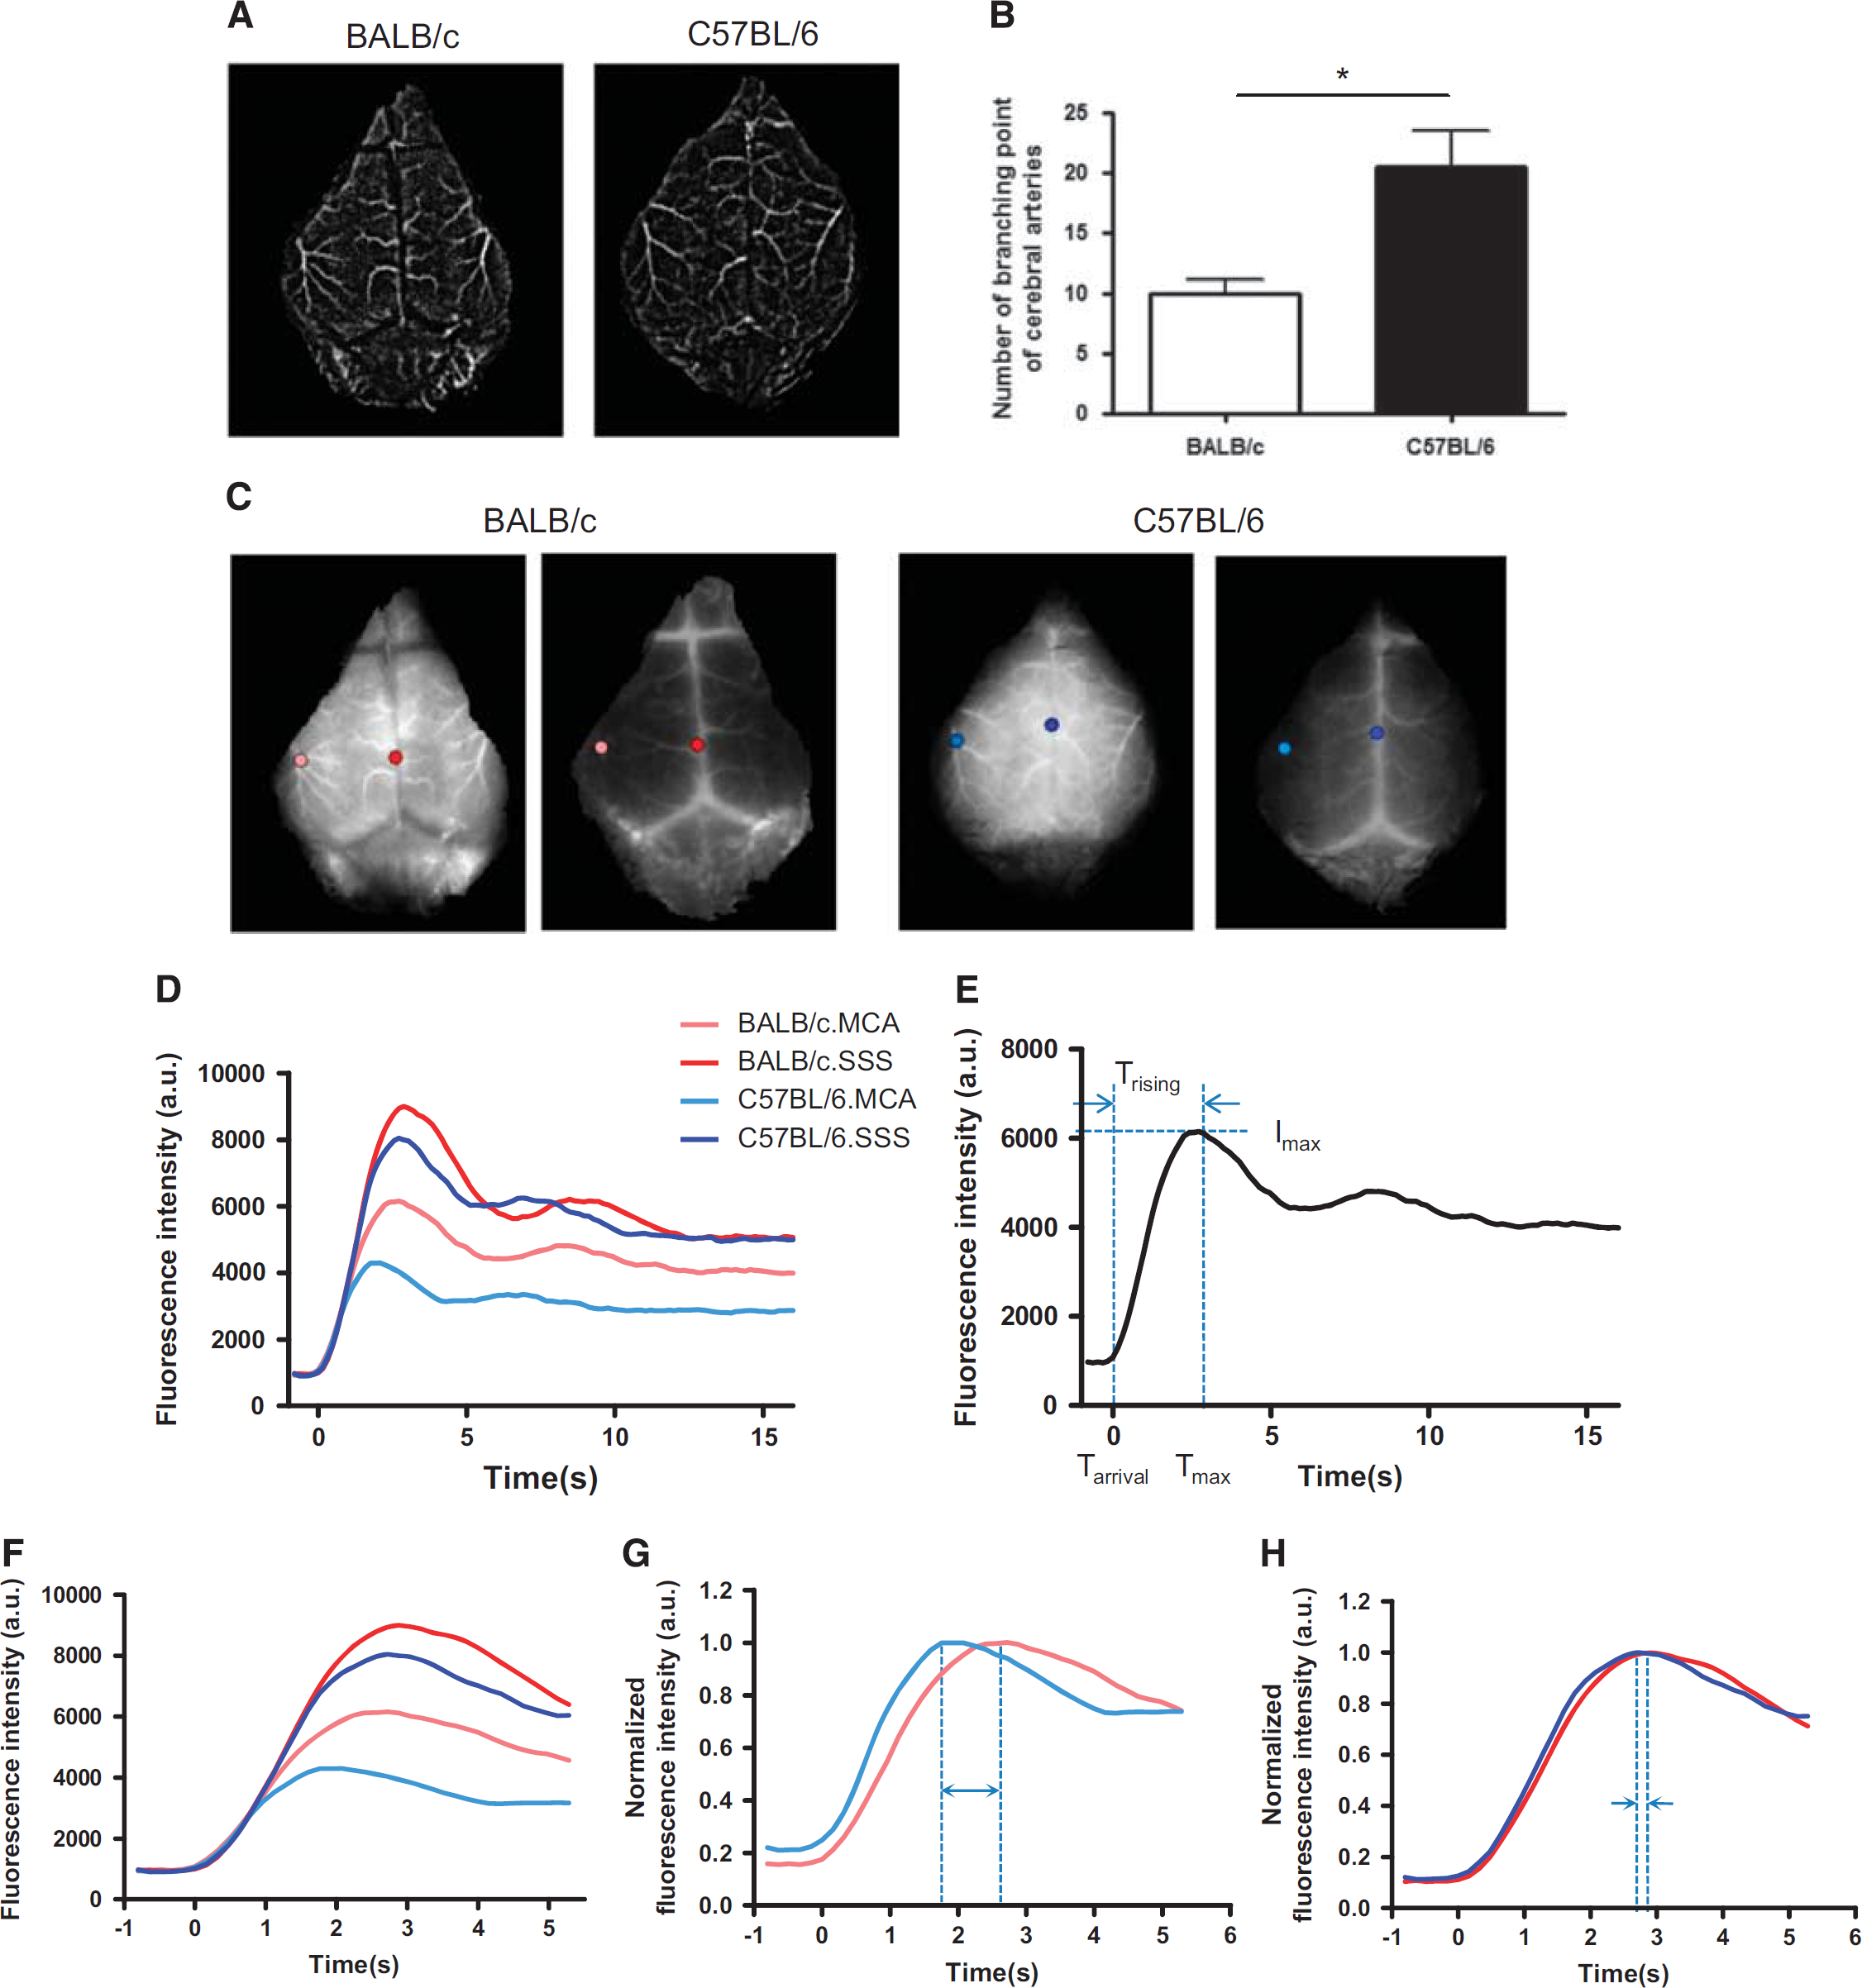
Time-series stack image and single-pixel dynamics of two mouse strains. (
Analysis of Single-Pixel Indocyanine Green Dynamics in Cerebral Vessels and Comparison Between Strains
We selected one pixel in the first branching area of the MCA, and one in the superior sagittal sinus (SSS) (Figure 1C), in fluorescence images. Then, we examined the dynamics of each pixel (Figure 1D), which typically consisted of an initial peak followed by subsequent peaks produced by systemic recirculation (Figure 1E). Afterwards, we extracted a
Blood Flow Feature Maps and Comparison Between Strains To analyze statistical differences in CBF between BALB/c and C57BL/6 mice, we assessed blood flow features in the following regions of interest (ROIs; 0.5 mm diameter): the first MCA branching area (yellow circle) appearing on the lateral area of the parietal bones in both hemispheres, and two ROIs in the SSS (blue circles) around the junction with the cerebral veins (Figure 2A). Values for each blood flow feature (
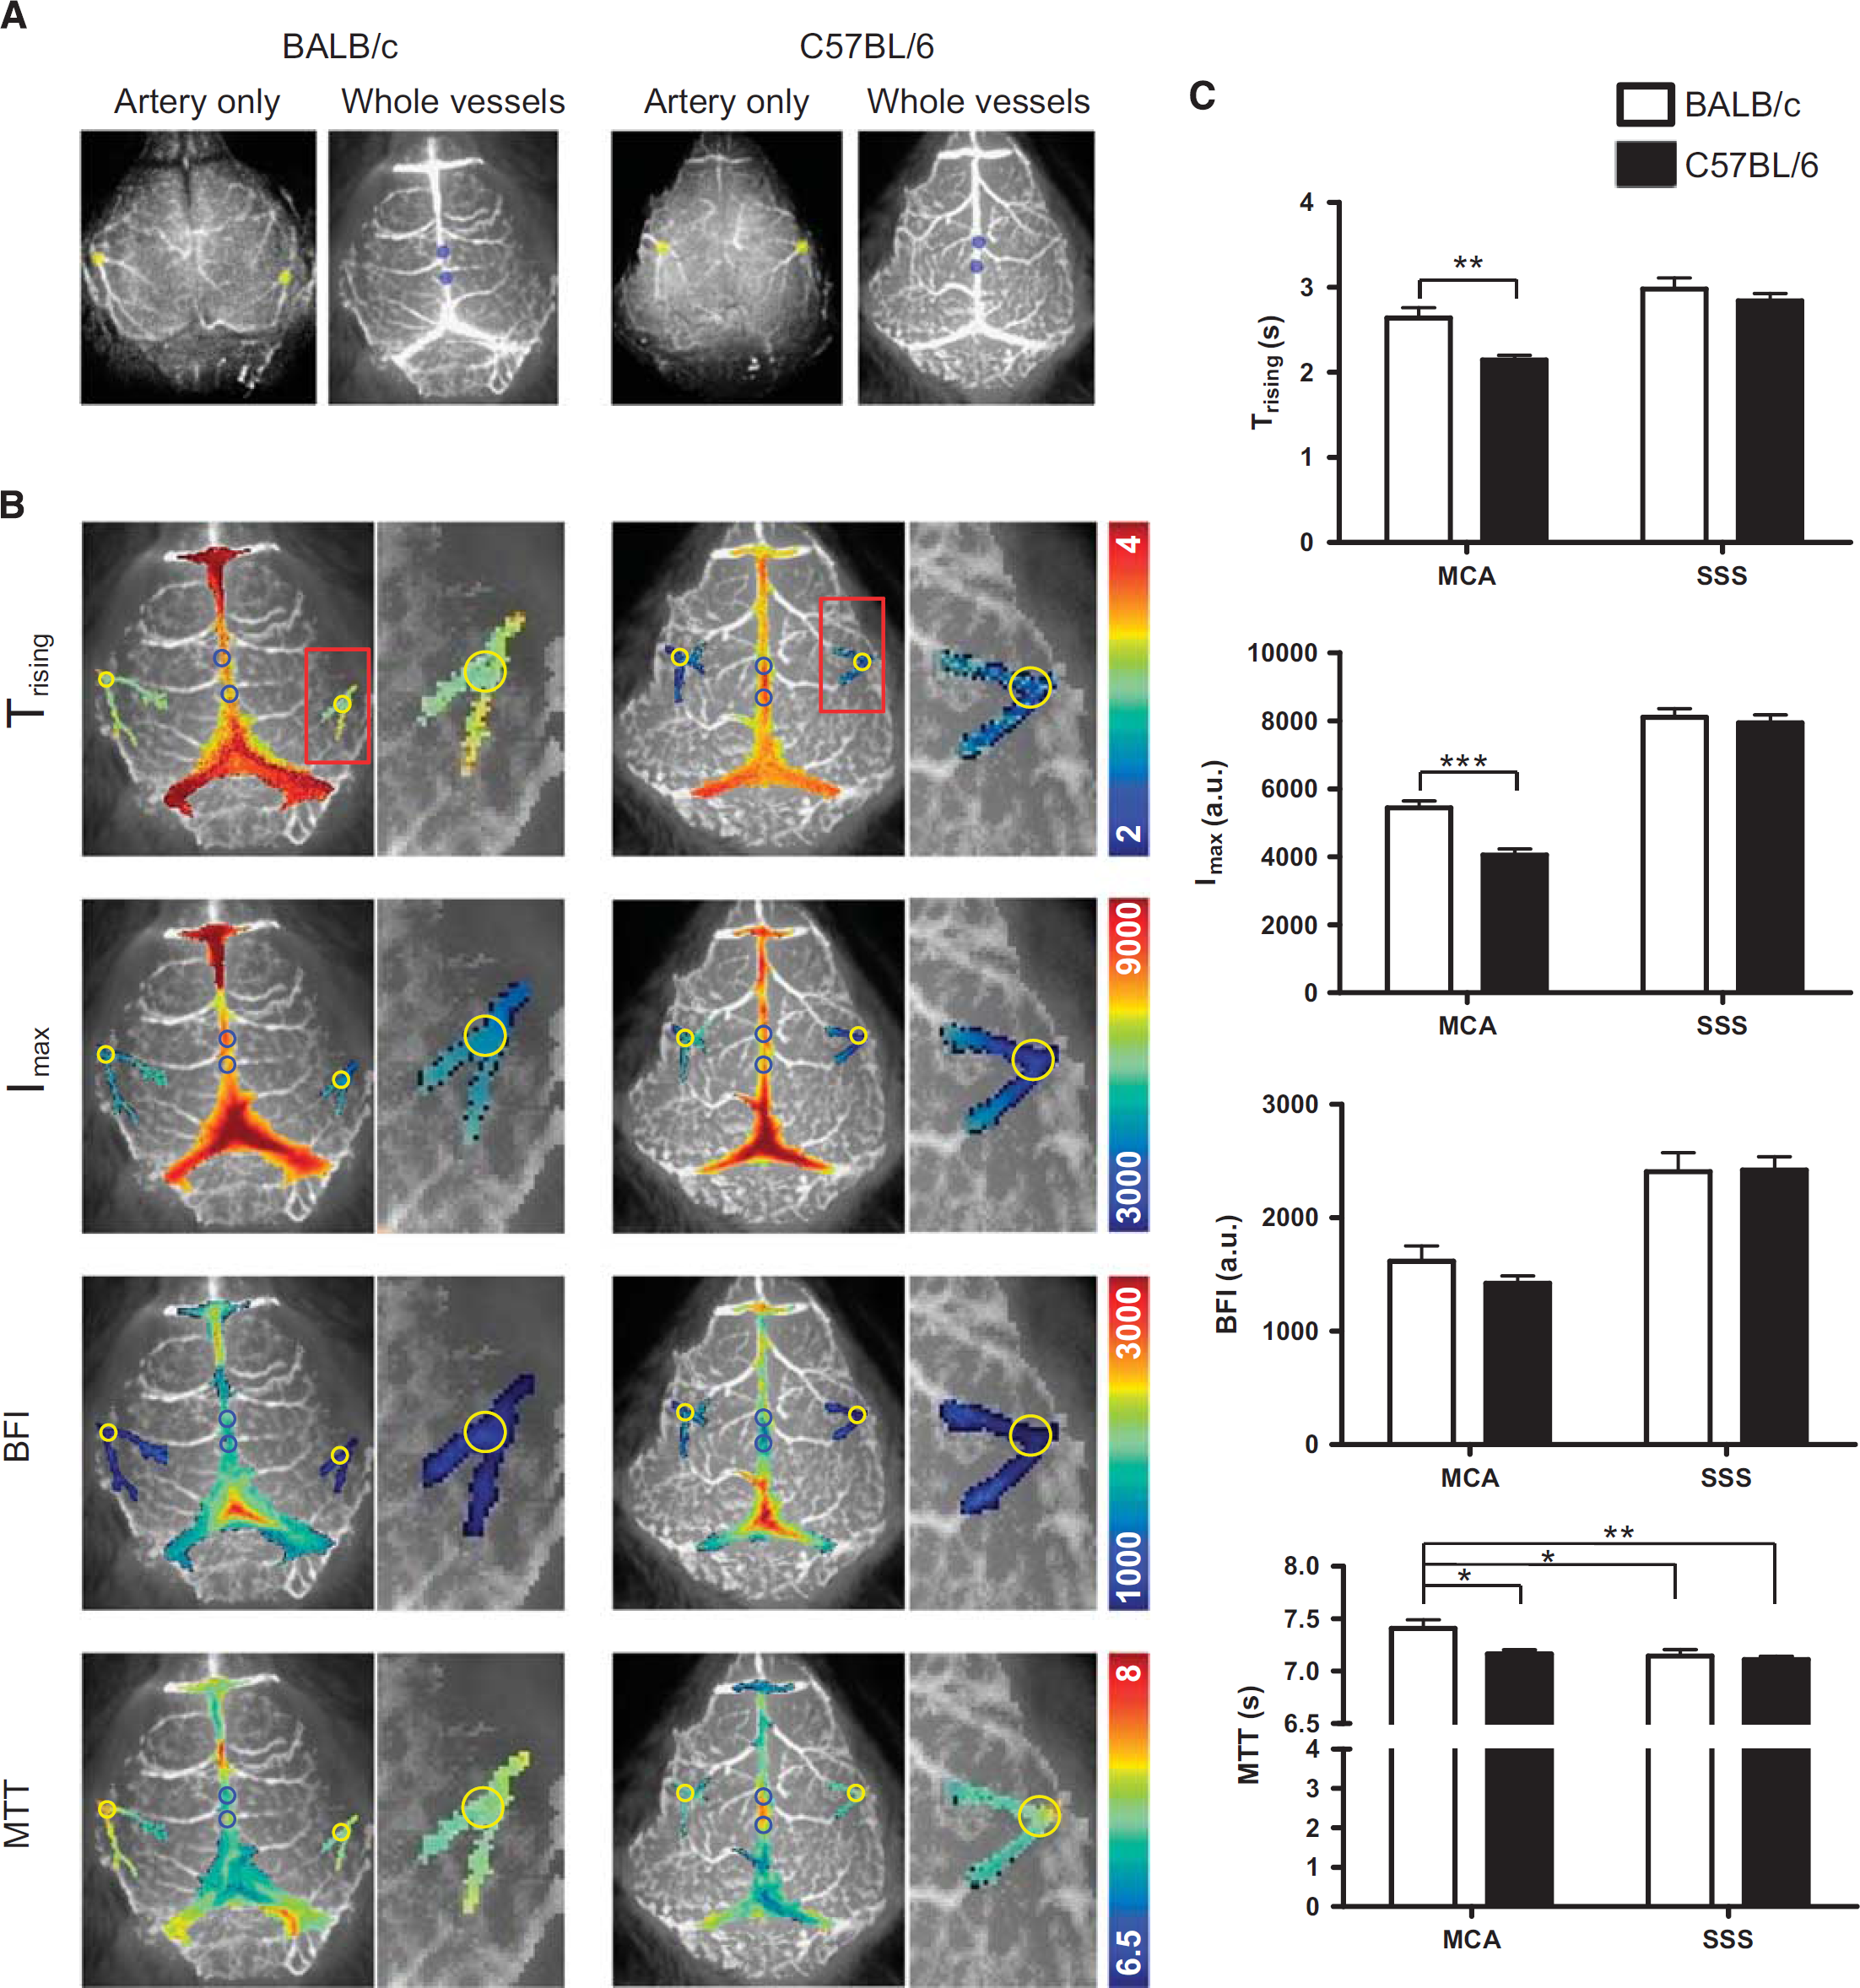
Types of cerebral blood flow (CBF) maps, and comparison of CBF parameters in BALB/c and C57BL/6 mice. (
To evaluate CBF in the distal branches of the MCA and microvessels in cortical tissue, we delineated 2 mm diameter ROIs covering these areas on both hemispheres. The ROI centers were positioned 2 mm posterior and 2 mm lateral from bregma (Supplementary Information S4). Interestingly,
DISCUSSION
Although previous study reported that blood flow assessed by [
14
C]iodoantipyrine autoradiography in the lateral cortex (the MCA territory) was not significantly different between C57BL/6 and BALB/c,
1
we hypothesized that differences in branch density and collaterals could lead to dissimilarities in CBF across mouse strains. To examine this hypothesis, we adopted a very sensitive optical imaging method using the near-infrared fluorescence dye ICG, combined with a time-series analysis of ICG molecular dynamics. There were differences in ICG dynamics between strains, which were successfully detected using four dynamic parameters (i.e.,
Our study revealed that cerebral arterial branching and collaterals determined the values of the various CBF parameters. Thus, since cerebral arterial branching and collaterals differ across mouse strains, CBF parameters differ according to their genetic backgrounds. Single-pixel ICG dynamics in the vessels of the two strains revealed that differences in CBF could be analyzed statistically. Particularly, it was determined that
In our study, C57BL/6 mice reached faster an ICG peak in the MCA, but the rate did not differ in the SSS. Thus, we compared CBF of the distal part of the MCA and cortical microvessels in the center area of the hemisphere. The results showed that there were no differences in MTT between the two strains, suggesting that microvessel networks in the cerebral cortex have similar blood flow rates. Interestingly, BALB/c mice showed a tendency for slightly higher cortical microvessel area density, 14 which may explain the similar peak time of ICG's for SSS and MCA.
Several anatomic studies have showed that differences in cerebral vasculature (e.g., branching and collaterals) in mouse strains can influence infarct size, and the recovery time after stoke.1,4 In the current study, we showed that two mouse strains have different physiologic patterns of arterial blood flow, using ICG optical imaging. Our data showed that a larger volume of blood flows in a branch of the MCA in BALB/c, which explains why a blockage of a branch of cerebral artery in BALB/c could induce a bigger infarction than C57BL/6.
Other optical methods to measure CBF include Laser Doppler flowmetry, and Laser Speckle imaging. These two techniques measure the velocity of flow of red blood cells. 15 Laser Doppler flowmetry lacks on sensitivity to estimate regional CBF, and only detects relative changes, 9 while Laser Speckle imaging is usuallyused to visualize the vasculature and make an image of relative blood flow. 15 Indocyanine green provides accurate and reliable identification of feeder and drainer vessels. This information is of great use to identify artery and vein. In addition, ICG imaging provides information of blood volume. 15 Indocyanine green image shows a much stronger signal in the larger vessels compared to small vessels with same blood flow rate. In this study, we used the properties of ICG to delineate the arteries and veins, and measured CBF parameters on a specific region of the brain. In future studies, we will use this noninvasive optical imaging method to examine the effect of neurovascular-related diseases on the perfusion rate of vessels in specific brain region.
AUTHOR CONTRIBUTIONS
HK and CP conceived and designed the experiments; HK and IS performed the experiments; HK, SK, DK, JJ, JWJ, and CP analyzed the data; HK and CP wrote the paper; all authors reviewed the manuscript before submission.
DISCLOSURE/CONFLICT OF INTEREST
The authors declare no conflict of interest.
Footnotes
References
Supplementary Material
Please find the following supplemental material available below.
For Open Access articles published under a Creative Commons License, all supplemental material carries the same license as the article it is associated with.
For non-Open Access articles published, all supplemental material carries a non-exclusive license, and permission requests for re-use of supplemental material or any part of supplemental material shall be sent directly to the copyright owner as specified in the copyright notice associated with the article.