
Abstract
This study quantified the effect of age on cerebrovascular reactivity and cerebrovascular conductance while accounting for differences in grey matter volume in younger (YA: n = 12; 24 ± 4 years, six females) and older adults (OA: n = 10; 66 ± 7 years; five females). Cerebral blood flow velocity (CBFV; transcranial Doppler) in the middle cerebral artery (MCA), MCA cross-sectional area (CSA), intracranial volumes (magnetic resonance imaging), and mean arterial pressure (MAP; Finometer), were measured under normocapnic and hypercapnic (6% carbon dioxide) conditions. Cerebral blood flow (CBF) was quantified from CBFV and MCA CSA and normalized to grey matter volume. Grey matter volume was 719 ± 98 mL in YA and 622 ± 50 mL in OA (P = 0.009). Cerebrovascular reactivity (%ΔCBF/ΔPETCO2) was not different between YA and OA. In contrast, cerebrovascular conductance (CBF/MAP) in response to hypercapnia was reduced in OA (P = 0.02). Of note, MAP increased more with hypercapnia in OA compared with YA. Therefore, the central hemodynamic response to hypercapnia compensated for a diminished dilatory response downstream from the MCA so that the CBF response to hypercapnia per unit of brain mass was not affected by age. This impairment was not detected by traditional measures of cerebrovascular reactivity.
Introduction
Age remains a major risk factor for development of cerebrovascular disease 1 and reduced reactivity to vasodilators represents an early sign of abnormal cerebrovascular health. In the case of the cerebral circulation, indicators of the relative change in cerebral blood flow velocity (CBFV), or cerebral blood flow (CBF), per unit change in the partial pressure of carbon dioxide are used commonly to assess an index of cerebrovascular reactivity (CVR). In general, a small CVR is interpreted as increased risk of stroke and all-cause mortality.2,3 Aging reduces absolute CBFV, as measured at the middle cerebral artery (MCA) with transcranial Doppler ultrasound.4–6 However, the evidence regarding the effect of age on CVR remains unclear with some studies reporting a decreased CVR,4,7–9 while others reported no difference.6,10–12 Different vasodilatory stimuli, ranging from 5 to 7% CO2 in room air4,6–12 or 5% CO2 in 95% oxygen, 7 or measures of CBFV versus CBF (transcranial Doppler ultrasound,4,6–8,10,11 positron emission tomography, 12 xenon inhalation 9 ) represent potential sources of variation amongst studies.
To relate measures of CBFV, as made by transcranial Doppler ultrasound in the MCA, for example, to CBF, additional details are needed regarding the baseline diameter of this vessel, as well as the vasoreactivity of subcortical vessels through which blood flow velocity data are obtained. Other sources of variation include contributions of central hemodynamics to brain perfusion and the brain volume being perfused. These values are difficult to obtain and many studies obtain CVR data using transcranial Doppler methods that target the MCA with the assumption that the cross-sectional area of the MCA does not change. However, recent measures using 3T13,14 and 7T 15 magnetic resonance imaging (MRI) in separate groups of young healthy subjects indicate that the cross-sectional area of the MCA increases by approximately 8% during hypercapnia with 6% CO2. Thus, CVR as calculated using CBF was 58% greater than CVR calculated from CBFV. 14 Clearly, at least in young adults, the vasoreactivity of the MCA makes considerable contributions to the overall cerebrovascular dilatory response to hypercapnia. To date, however, the impact of healthy aging on MCA vasoreactivity has not been reported. These features are important because CVR reflects the relative change in flow for a given stimulus, such as carbon dioxide, but does not quantify specifically the dilatory response. Rather, an increase in CBF during hypercapnia could be a result of vasodilation and/or changes in perfusion pressure, the proportions of which may change with age. Failure to account for these possibilities may lead to erroneous conclusions about vasoreactivity. Thus, we argue that evaluations of changes in cerebrovascular conductance are required to interpret cerebral vasoactive properties and responses.
Additionally, brain atrophy occurs with aging and is more pronounced in grey matter than white matter. 16 This atrophy may occur to a greater extent in the frontal and parietal portions of the cerebral cortex, including those perfused by the MCA vascular bed.17,18 Normalization of CBF to changes in cortical volume is expected to more accurately establish age-related changes in brain blood flow.
The purpose of this study was to test the overall hypothesis that advancing age impairs cerebrovascular dilation. These studies incorporated evaluations of brain volume, MCA dilation to hypercapnia, and central hemodynamics, in cohorts of young adults (YA) and older adults (OA).
Materials and methods
Ten older subjects aged 59 to 75 years (66 ± 7 years, five females) and 12 younger subjects (24 ± 4 years, range 20–30 years, six females) gave informed consent to participate in this study that was approved by the Health Sciences Research Ethics Board at Western University and performed in accordance with the Declaration of Helsinki. Subjects were non-smokers who had no history of cardiovascular disease. Two of the participants were medicated at the time of the study: one female OA was taking 10 mg per day of Clobazam for seizures (but had not had a seizure in 13 years), and one older male was taking Warfarin for a blood clot that occurred five years prior. All participants were recreationally active. Female OA reported that they were postmenopausal (confirmed by sex hormone analysis) and not on hormone replacement therapy. Young female participants were studied in the early follicular phase of their menstrual cycle (days 1–6) or the low hormone phase of oral contraceptives (four of six young female participants were taking oral contraceptives).
Experimental protocols and measurements
All participants participated in a familiarization session and two experimental sessions, including what will be referred to as an MRI day and a Laboratory day. During the familiarization session, all experimental protocols were thoroughly explained, participants practiced breathing 6% CO2, and completed the Montreal Cognitive Assessment (MoCA: www.mocatest.org) 19 and the Trail Making Test to assess cognitive abilities. 20 Prior to each experimental session, participants were asked to refrain from alcohol, physical activity, and caffeine, for 12 h. During the Laboratory session, a blood sample was obtained after a 12-h fast that was analyzed for blood glucose, hemoglobin, cholesterol, triglycerides, 17-β estradiol, progesterone, and testosterone concentrations. A small meal consisting of a granola bar and juice was then provided. For the MRI day, participants ate a small breakfast 3 h prior to the testing session.
For each day, a hypercapnia trial was performed where participants breathed a gas mixture containing 6% CO2, 21% oxygen, balance nitrogen. Each of these hypercapnia trials consisted of approximately 3 min of baseline and 5 min of hypercapnia. During hypercapnia, the partial pressure of oxygen was not clamped because the ensuing hyperventilation would, if anything, augment alveolar PO2, minimizing any risk of additional hypoxia.
Laboratory session
Initially, three seated blood pressure measurements were made (HEM-790-ITCAN, Omron, Lake Forest, IL, USA). To gain insight into the general vascular health of each individual, images of the right and left common carotid artery (10 MHz probe; Vivid 7 system, GE HealthCare Canada, Mississauga, ON, Canada) were captured while supine in order to quantify intima-media thickness (IMT). To assess brachial endothelial function, a flow-mediated dilation protocol was performed where ischemia was induced for 5 min using an air bladder cuff positioned around the forearm and inflated to supra-systolic levels. Longitudinal images of vessel diameter were made at baseline (average of three measures) and every 15 s for 3 min after release of forearm ischemia. Throughout all protocols, the heart rate was acquired from a standard ECG recording. Arterial blood pressure was measured using finger cuff plethysmography (Finometer, Finapres Medical Systems BV, Amsterdam, The Netherlands) and the brachial blood pressure derived from the finger pressure waveform was corrected to manual sphygmomanometric values. Respiration rate and PETCO2 were monitored with a strain gauge and a gas analyzer (ML206, ADInstruments, Colorado Springs, CO, USA), respectively. In the supine position, the right MCA was insonated to measure CBFV (2 MHz pulsed wave TCD probe; Neurovision, Multigon Industries, Elmsford, CA, USA) with an average insonation depth of 4.9 ± 0.4 cm in YA and 5.0 ± 0.5 cm in OA.
MRI session
CBFV and MCA CSA were collected at the same time of day on separate days and, on average, the interval between each test was 11 ± 11 days. Magnetic resonance imaging was performed with a 3T system (Magnetom Prisma, Siemens Medical Solutions, Erlangen, Germany). A 3D time-of-flight pulse sequence exposed the location on the M1 segment of the MCA for application of a T2 fast spin echo sequence (eight slices, repetition time = 3000 ms, echo time = 96 ms, flip angle = 120°, voxel dimensions = 0.4 × 0.4 × 2.0 mm3). The T2 sequence was gated to the peak of the pulse wave measured at the third finger of the right hand with an MRI-compatible pulse oximeter (8600FO MRI, Nonin Medical Inc., Plymouth, MN, USA). Collection of an image took approximately 1.25 min. Respiration was monitored with a strain gauge around the upper abdomen and PETCO2 data were collected as described during the Lab session.
Additionally, a T1-weighted structural image was acquired with a 3D MP-RAGE pulse sequence for determination of grey matter, white matter, and cerebrospinal fluid volume (repetition time = 2.3 ms, echo time = 30 ms, flip angle = 9°, voxel dimensions = 1.0 × 1.0 × 1.0 mm).
Data analysis
The right and left common carotid artery IMT was quantified with calipers (GE Echopac software) at end-diastole at three regions along the artery and averaged. An independent observer also completed the analysis and the intra-class coefficient between the observers was 0.99 (P < 0.001); therefore, an average of the values from the two investigators is reported. To assess brachial endothelial function, the peak diastolic diameter during the reactive phase (normally occurring at 60–90 s) 21 was used for statistical analysis. Two observers also completed brachial measurements and the intra-class correlation coefficient was 0.99 (P < 0.001).
Baseline PETCO2 values from the MRI were corrected to Lab values. This was done because the length of the hose to the CO2 analyzer (located outside the MRI area) resulted in a systematic and constant damping of the signal that diminished PETCO2 values at baseline. Since there was no difference in respiration rates between the Lab and MRI day, we corrected MRI values to the average baseline Lab PETCO2. The MCA CSA was measured manually by two blinded observers using Osirix imaging software (Pixmeo, Bernex, Switzerland) and the data from both observers were averaged and reported. The agreement between the two observers was very good (intra-class correlation coefficient was 0.99 (P < 0.001)). The reported CSA during hypercapnia is the maximal value from the 5-min period and this is reported along with absolute and percent change (%Δ) from baseline. All other reported variables for hypercapnia correspond to this maximal CSA value. Cerebral blood flow was calculated as CBF (ml/min) = CBFV (cm/s) × CSA (cm2) × 60 (s/min). CBFV and CBF are also reported as %Δ.
Using SPM 8 (http://www.fil.ion.ucl.ac.uk/spm/), high-dimensional spatial normalization was performed with T1 images using the DARTEL toolbox. Images were then segmented into grey matter, white matter, and cerebrospinal fluid. Total intracranial volume was calculated as the sum of these three components.
Cerebrovascular conductance was calculated as the quotient of CBF and MAP, along with absolute and percent change. CVR indices were calculated both as the percent and absolute change in CBF and CBFV per mmHg change in PETCO2 at approximately every 1.25 min during hypercapnia (to correspond with the timing of MCA images).
Statistical analysis
The effects of group (YA versus OA) and condition (baseline versus hypercapnia) were assessed using a general linear mixed model ANOVA and a Holm-Sidak post-hoc test for pairwise comparisons (SigmaStat 12.0; Systat Software, San Jose, CA). Unpaired t-tests were used to assess the impact of group on grey matter, white matter, and cerebrospinal fluid as well as on relative (%Δ) indices. Regression analysis quantified the relationship between grey matter volume and CBF. An ANCOVA compared the slope of the regression lines for YA and OA (SPSS 20.0; IBM Corporation, Armonk, NY). In addition, we performed ANCOVA analysis to determine the effect of age on CBF when controlling for grey matter (GM) volume. Since GM had a significant effect on CBF, in this model we normalized all measurements of CBFV, CBF, CVC, and CVR to grey matter volume and these variables are reported as CBFVGM, CBFGM, CVCGM, and CVRGM. The probability level for statistical significance was p ≤ 0.05.
Results
Baseline measures
Subject characteristics.
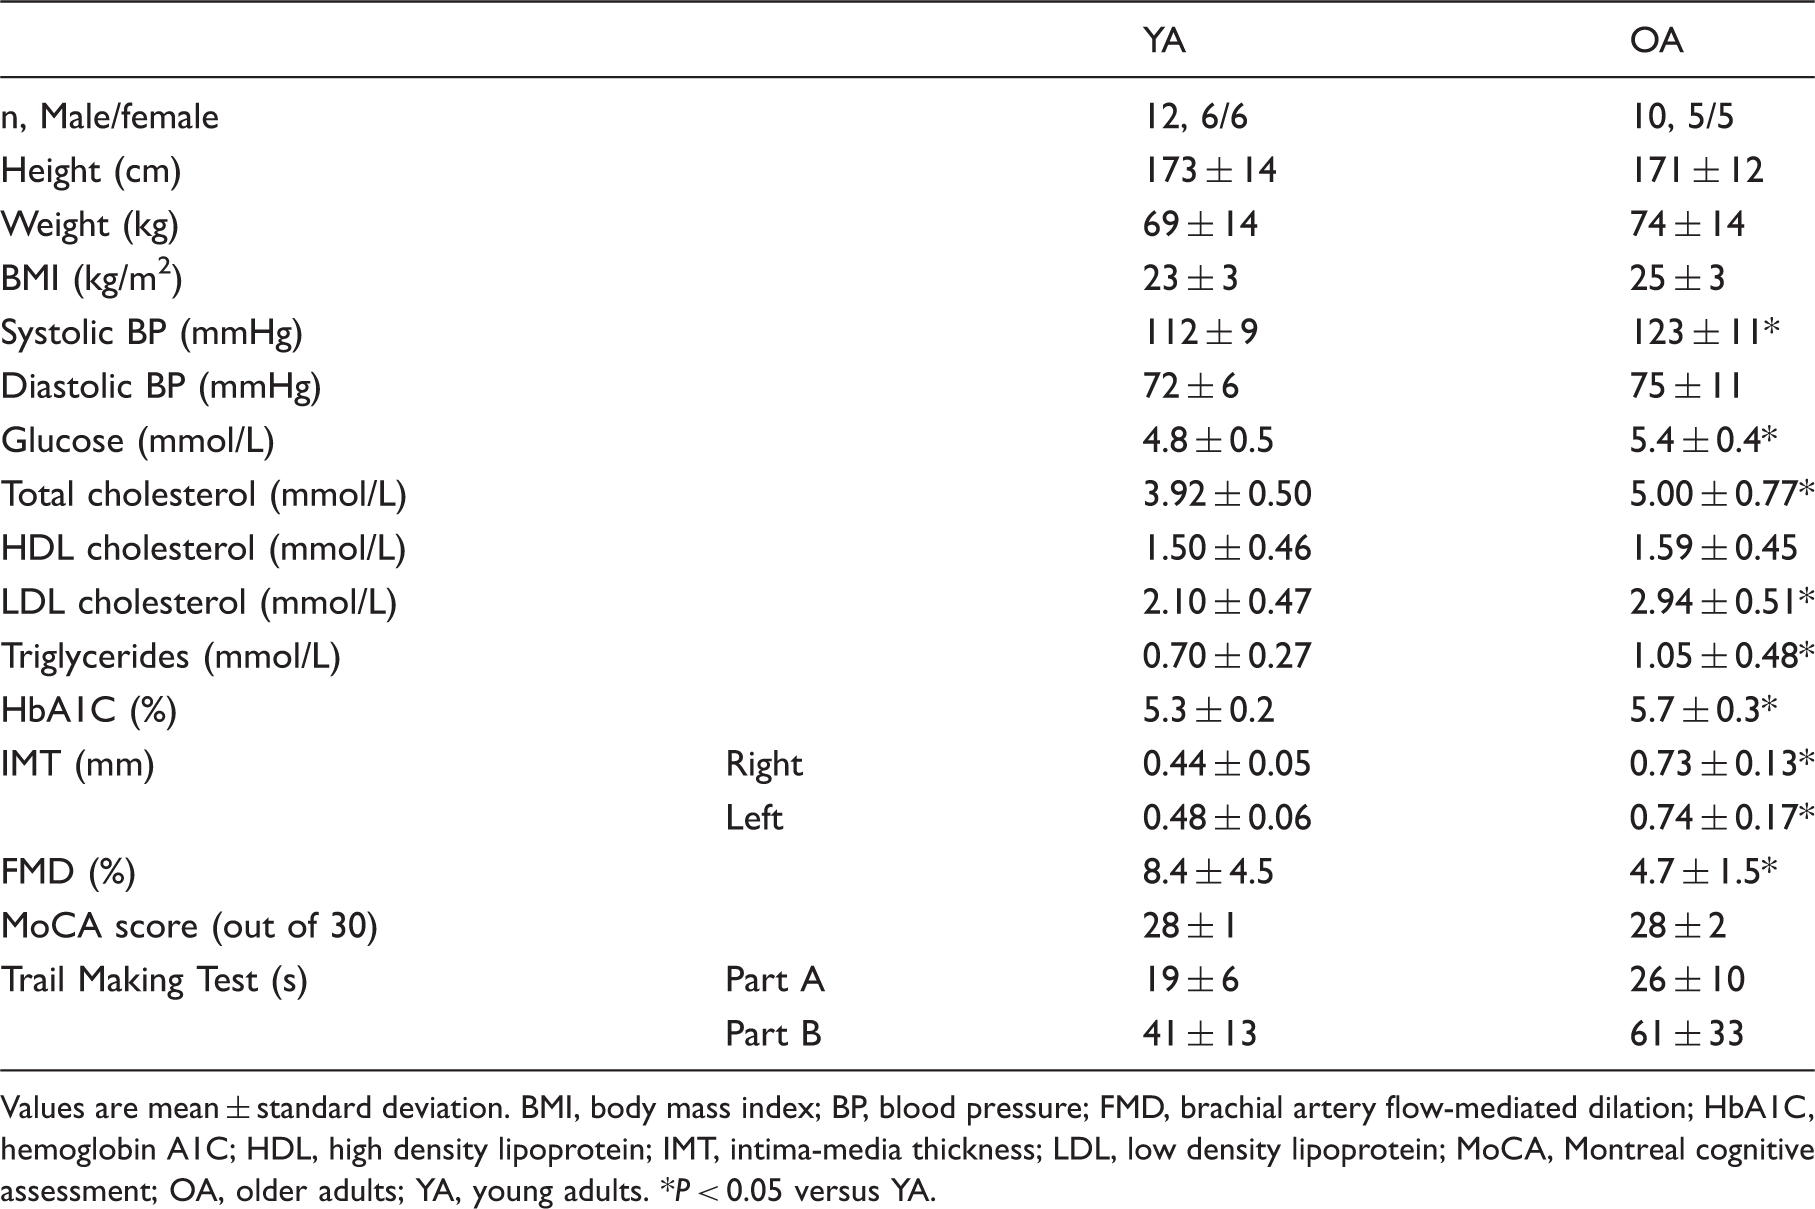
Values are mean ± standard deviation. BMI, body mass index; BP, blood pressure; FMD, brachial artery flow-mediated dilation; HbA1C, hemoglobin A1C; HDL, high density lipoprotein; IMT, intima-media thickness; LDL, low density lipoprotein; MoCA, Montreal cognitive assessment; OA, older adults; YA, young adults.
P < 0.05 versus YA.
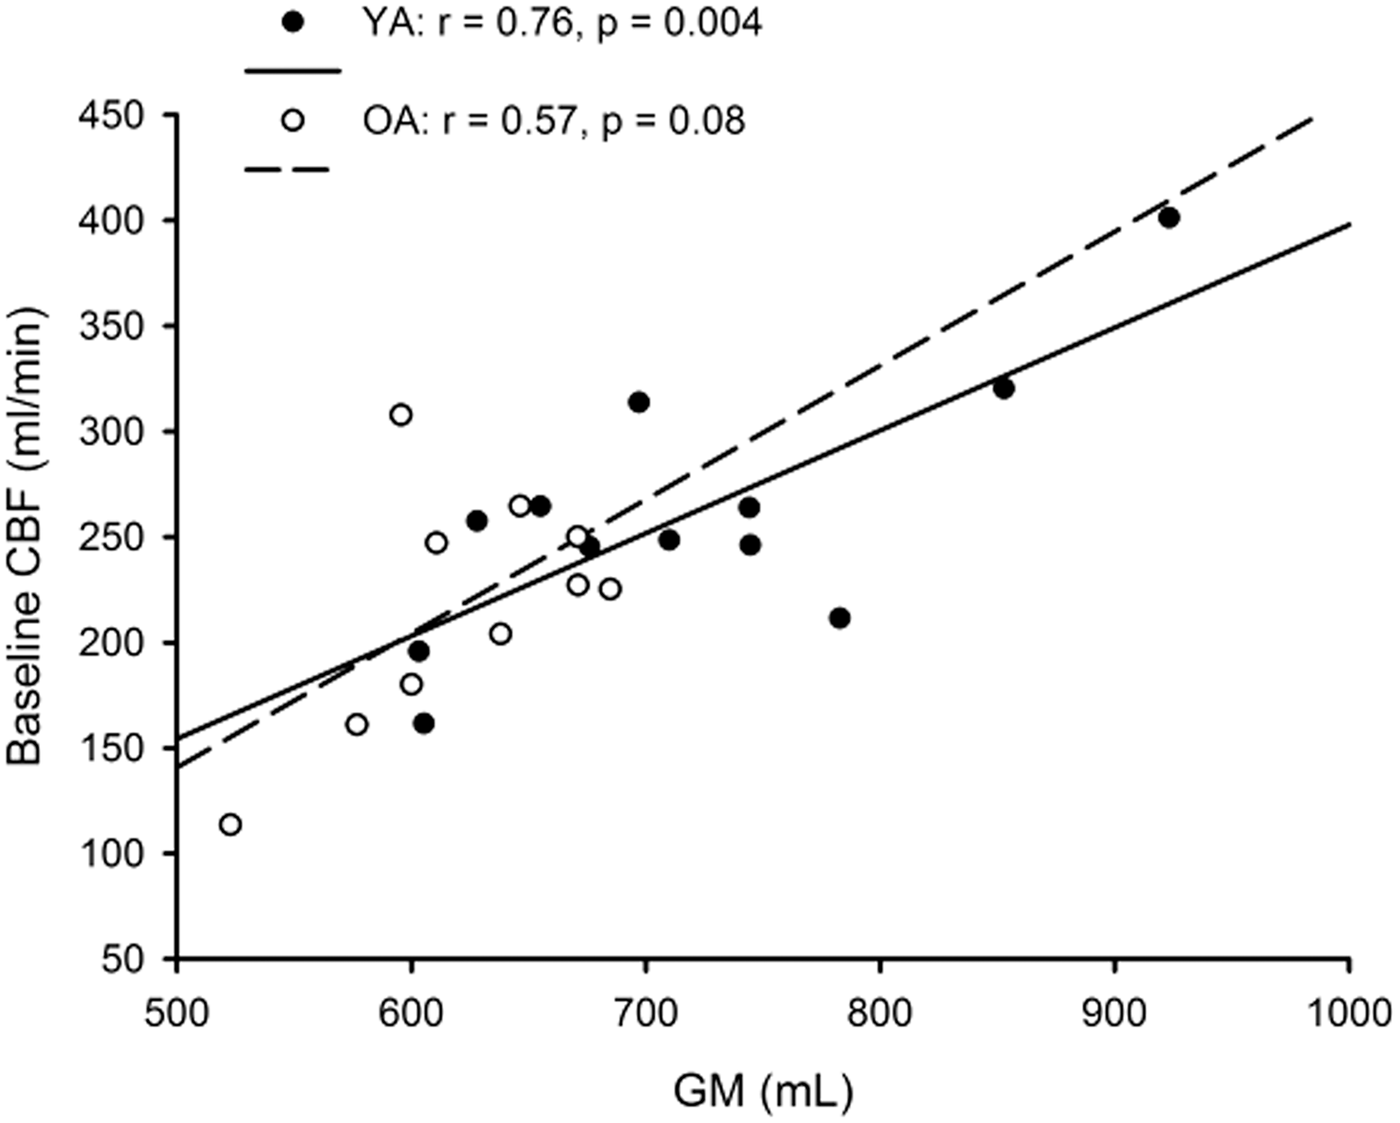
The relationship between baseline cerebral blood flow (CBF) and grey matter volume (GM) in young adults (YA) and older adults (OA). For YA, the equation of the regression line is CBF = −89.21 + 0.49 × GM and for OA CBF = −176.67 + 0.64 × GM.
Cerebrovascular reactivity measures
Physiological characteristics at baseline and hypercapnia (HC) for Laboratory and MRI days.
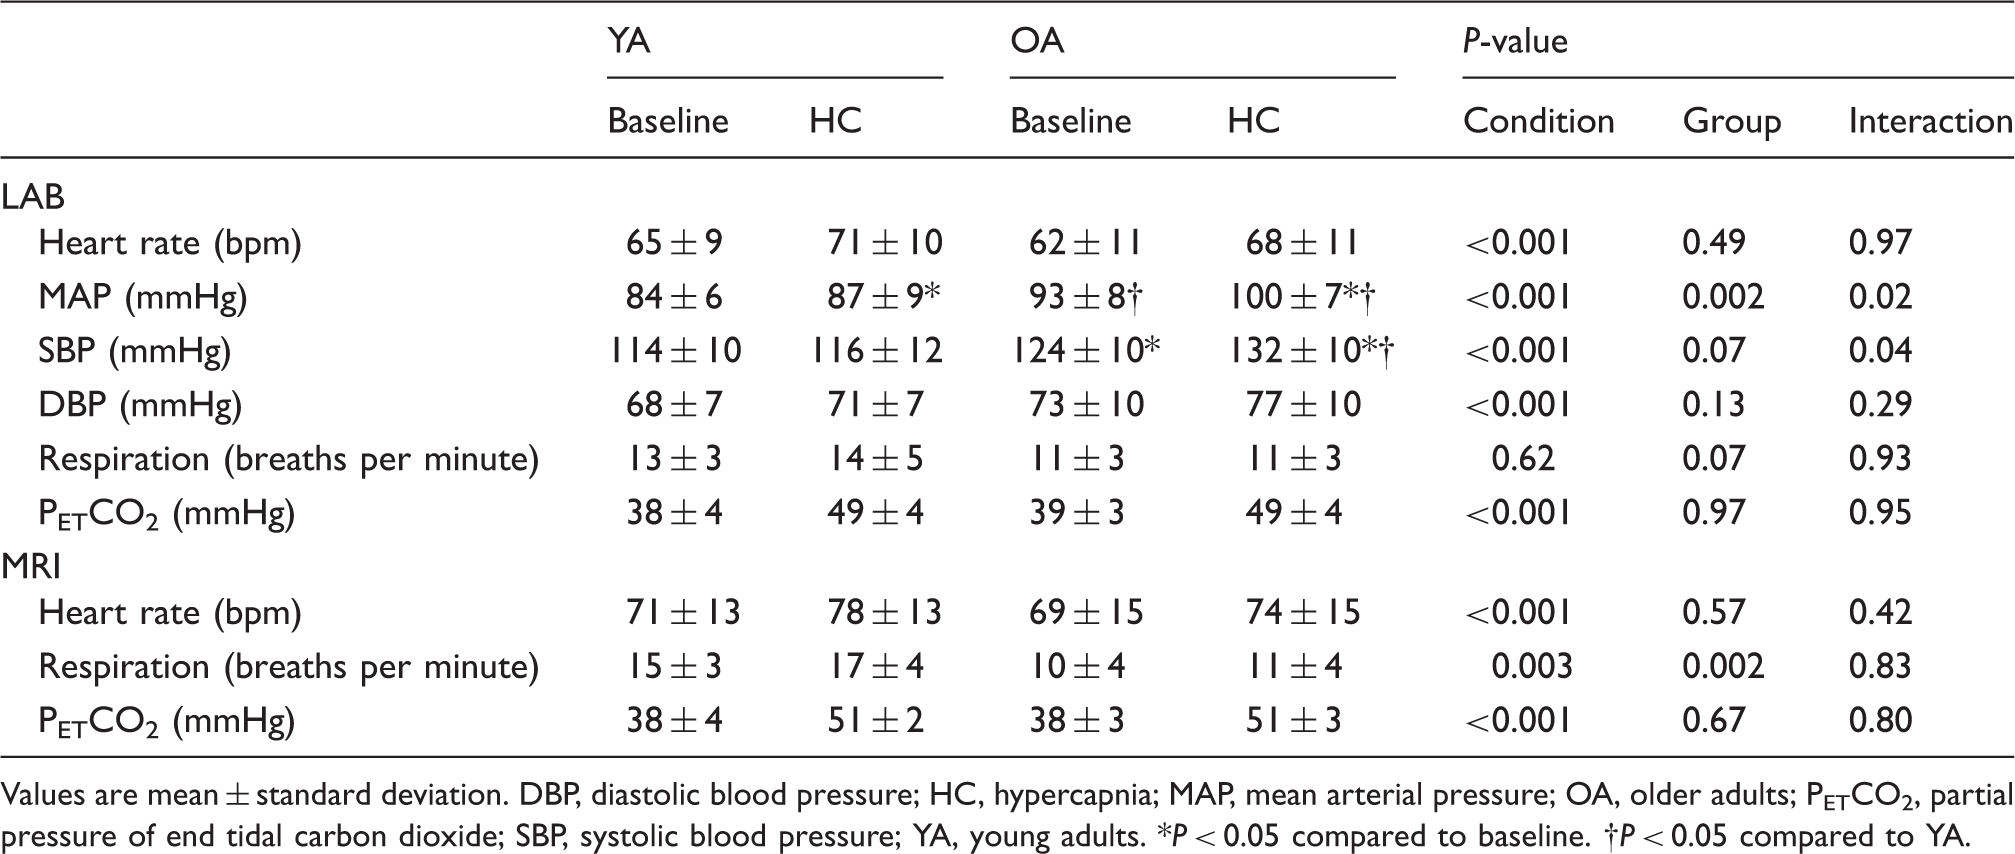
Values are mean ± standard deviation. DBP, diastolic blood pressure; HC, hypercapnia; MAP, mean arterial pressure; OA, older adults; PETCO2, partial pressure of end tidal carbon dioxide; SBP, systolic blood pressure; YA, young adults.
P < 0.05 compared to baseline.
P < 0.05 compared to YA.
Individual patterns of change in MCA CSA are shown for YA and OA in Figure 2(a) and (b), respectively. Specifically, in YA, MCA CSA increased from 6.5 ± 1.6 to 7.1 ± 1.4 mm2 with hypercapnia with all participants demonstrating a similar increase. In contrast, MCA CSA changed from 7.0 ± 1.2 to 7.3 ± 1.4 mm2 in OA with a less consistent effect across participants. Compared to baseline, absolute MCA CSA increased with hypercapnia (main effect of condition P < 0.001) (Figure 2(c)). Overall, the difference in CSA (Figure 2(d)) on going from baseline to hypercapnia was not different between groups (P = 0.11) while the %ΔCSA was greater in YA compared to OA (P = 0.04; Figure 2(e)) but the slightly larger baseline MCA in the OA group likely influenced this latter comparison.
Middle cerebral artery cross-sectional area (CSA) during hypercapnia in young adults (YA; a) and older adults (OA; b) expressed as absolute values (c), absolute change (d) and percent change CSA (e). *P < 0.05 versus YA.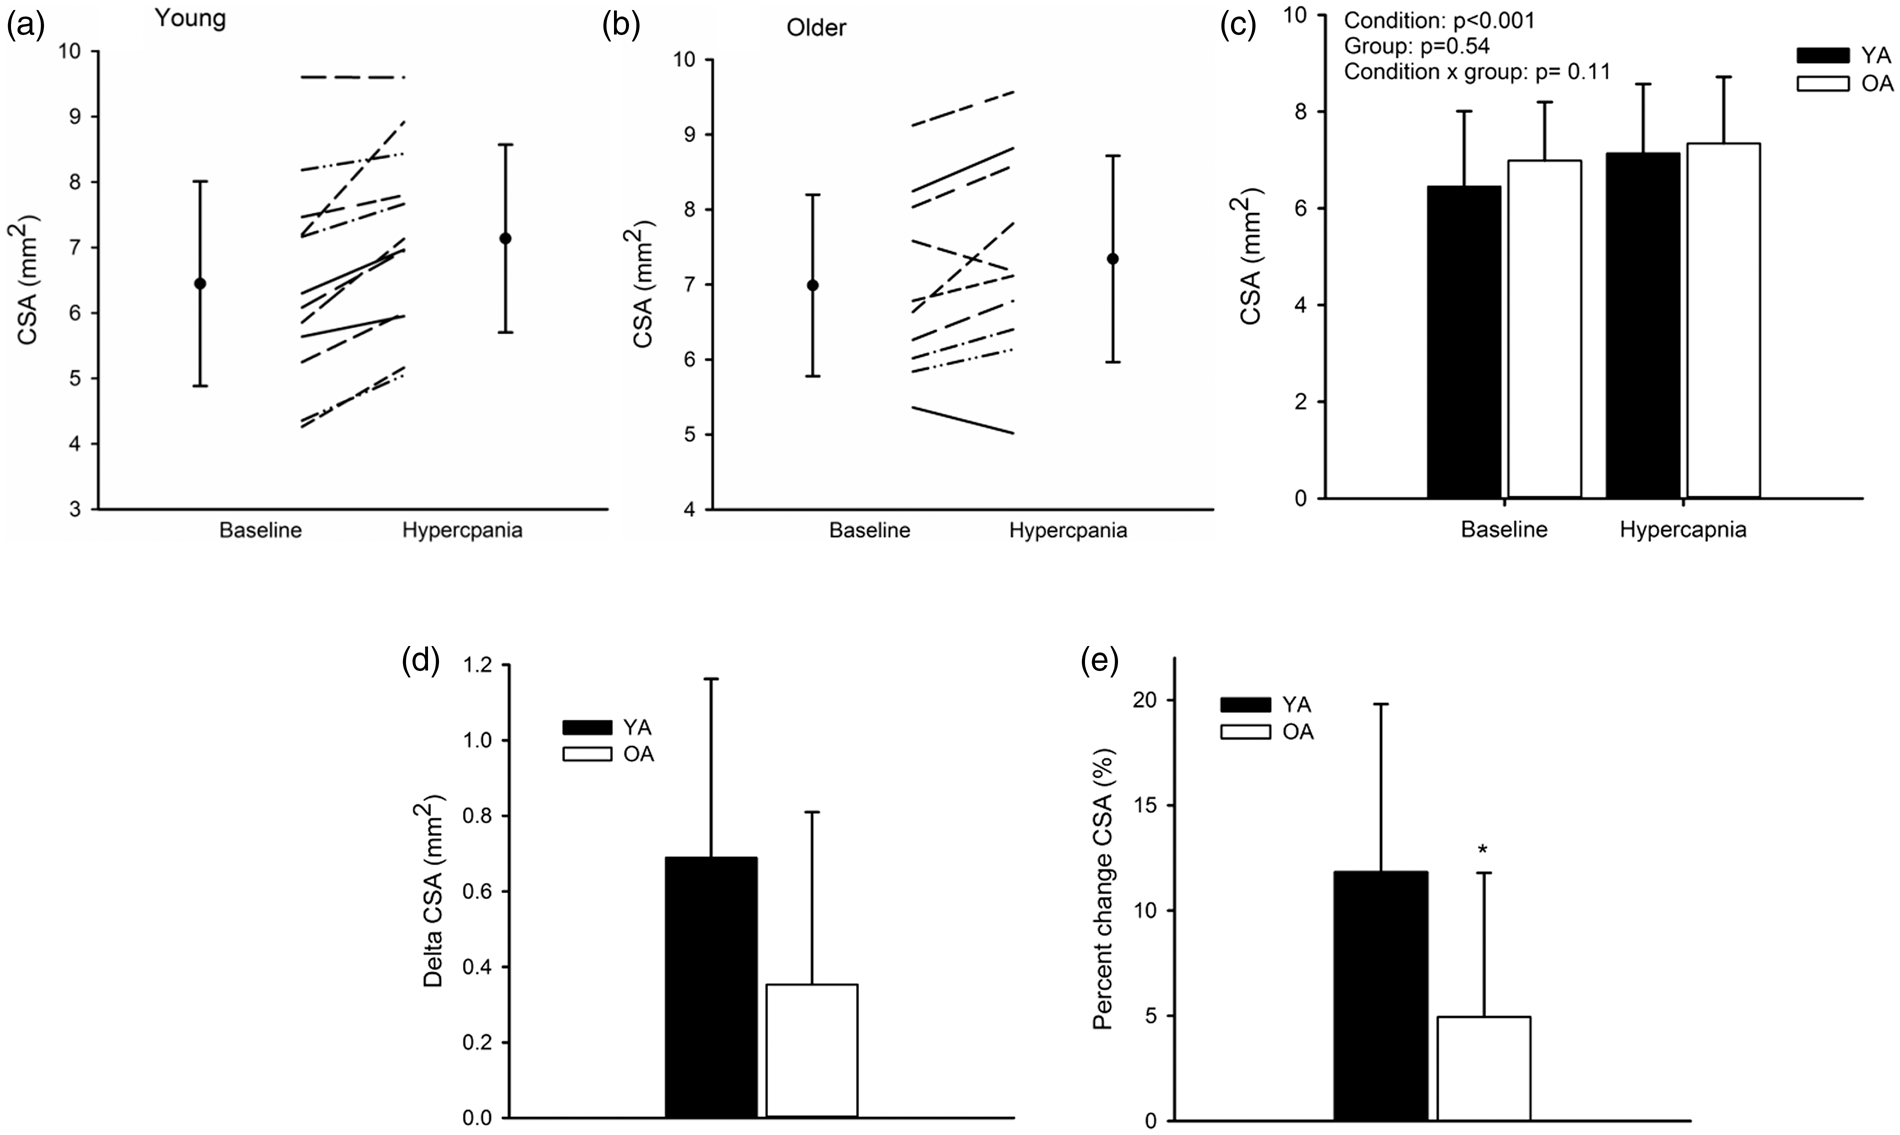
In both groups, CBFVGM (Figure 3(a)) and CBFGM (Figure 3(b)) increased with hypercapnia (main effect of condition: P < 0.001), but no effect of group was observed. However, the %ΔCBFVGM was less than %ΔCBFGM in both groups (YA: P < 0.001; OA: P = 0.04; Figure 3(c)) indicating an important influence of MCA cross-sectional area on the cerebrovascular response to hypercapnia.
Cerebral blood flow velocity (CBFVGM; a) and cerebral blood flow (CBFGM; b) at baseline and during hypercapnia in young adults (YA) and older adults (OA) expressed as absolute values and percent change (c). *P < 0.05 versus CBFVGM.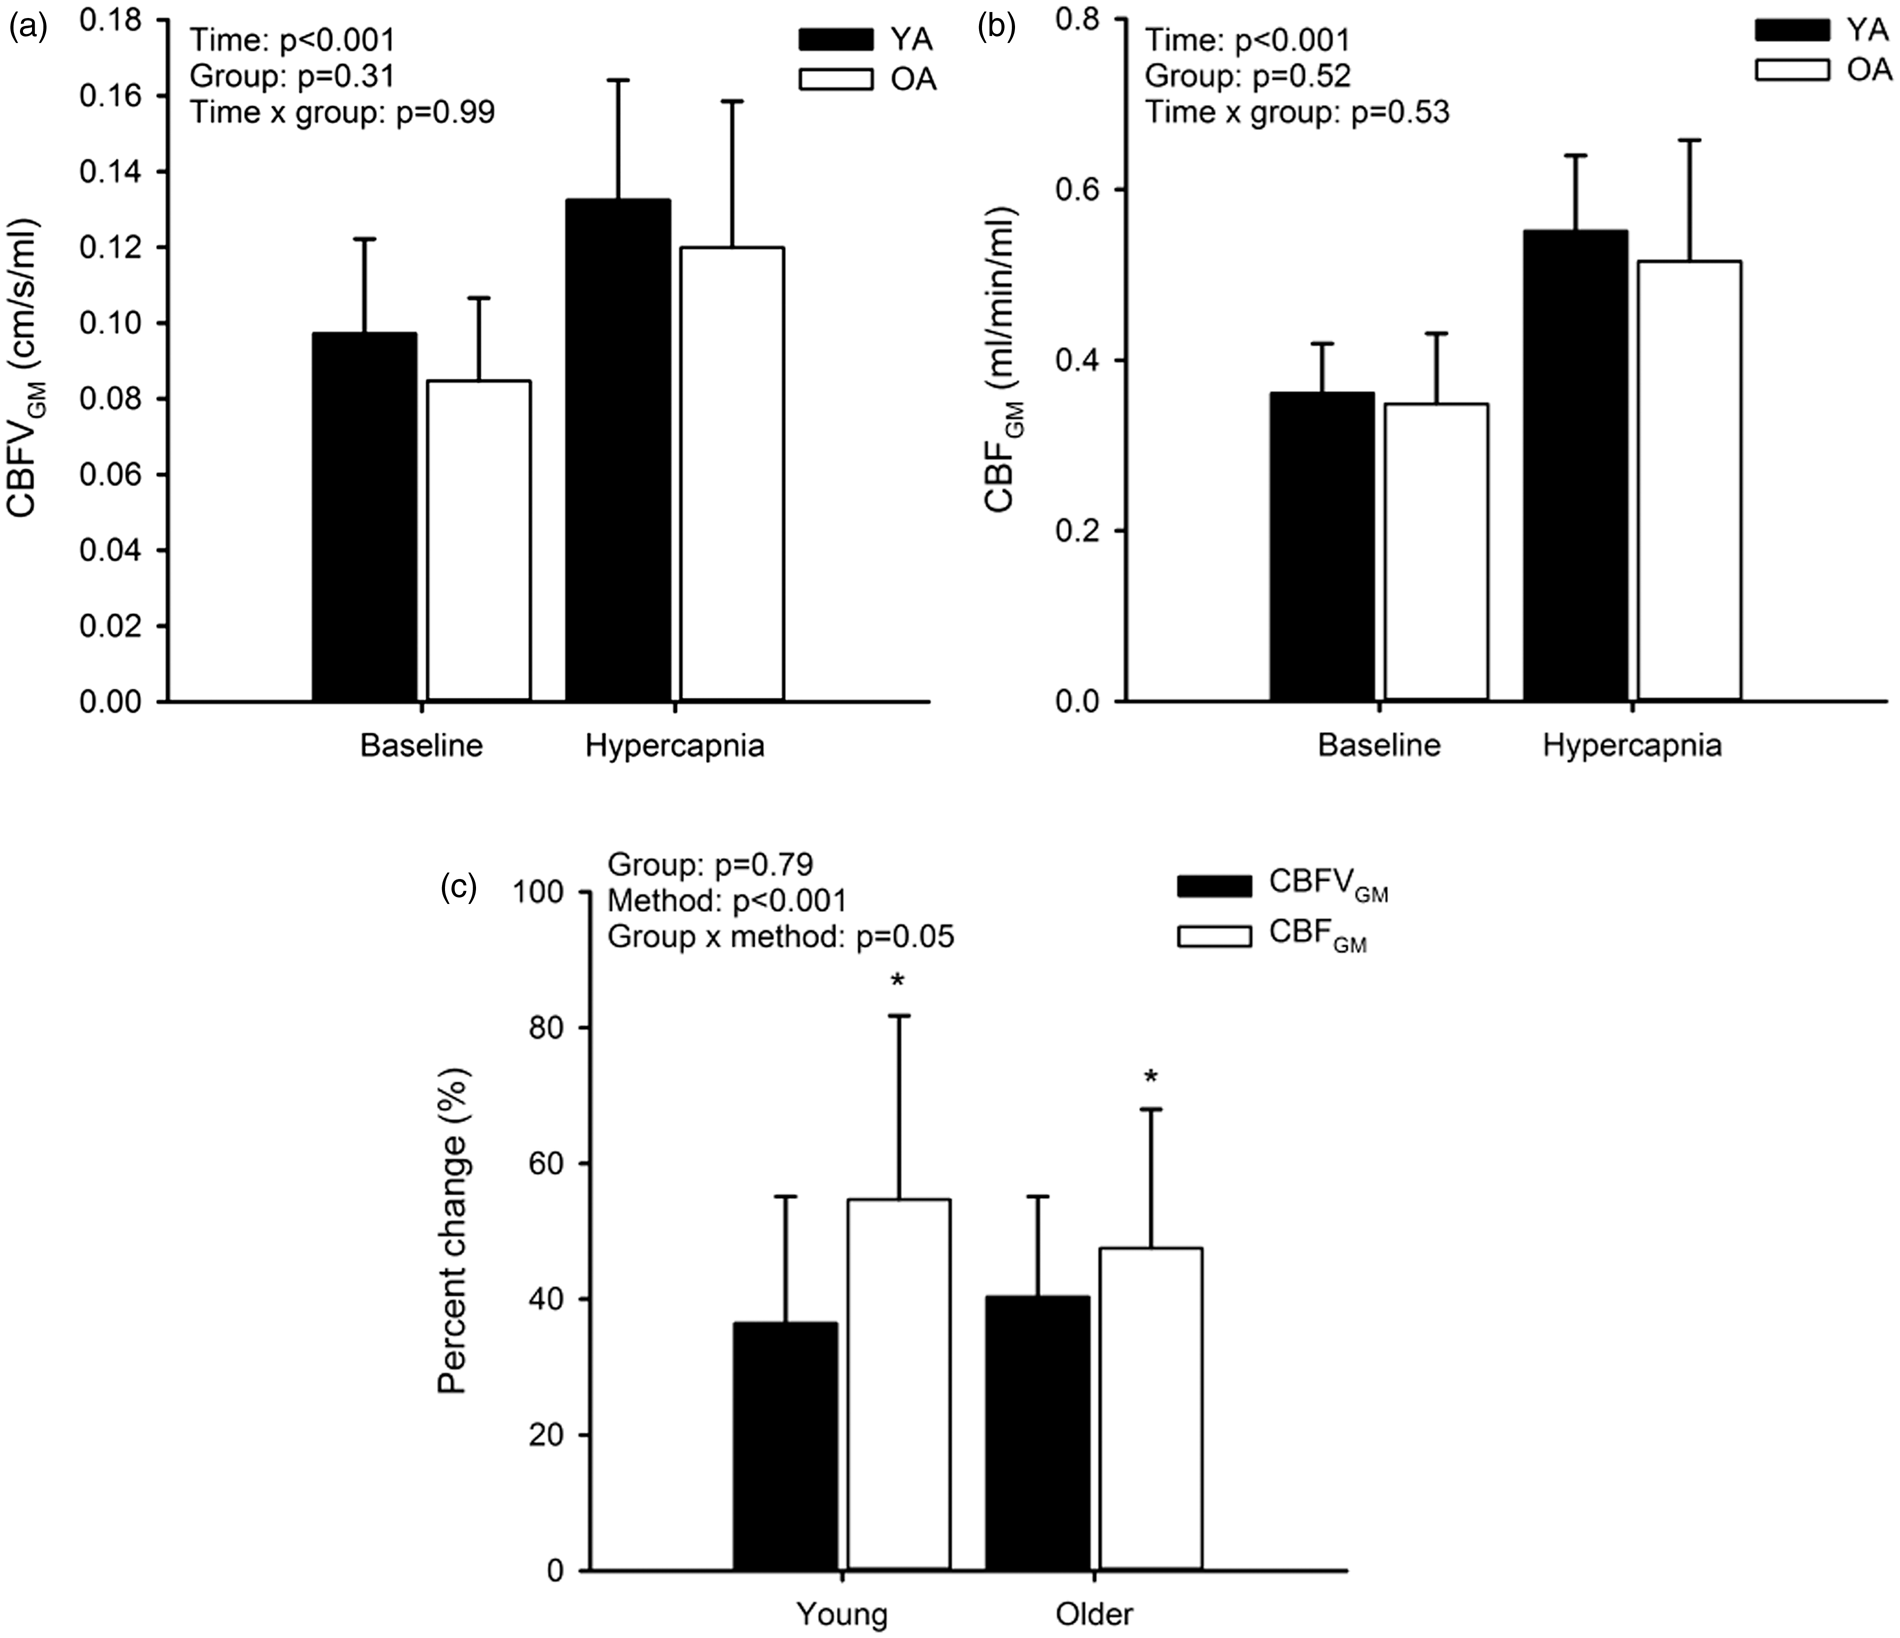
Baseline CVCGM was not different between YA and OA (Figure 4(a)). Although CVCGM increased in both groups in response to hypercapnia (P < 0.001; Figure 4(a)), the end levels of conductance were less in OA (0.0052 ± 0.002 ml/min/mmHg) than YA (0.0064 ± 0.001 ml/min/mmHg) (P = 0.02; Figure 3(a); effect size = 0.64, 1 − β = 0.4). The increase in CVCGM was 2.1 × 10⁻³ ± 0.78 × 10⁻³ ml/min/mmHg in YA compared to 1.4 × 10⁻³ ± 0.68 × 10⁻³ ml/min/mmHg in OA (P = 0.05; Figure 4(b); effect size = 0.95; 1 − β = 0.69). Additionally, the %Δ CVC was 50 ± 23% in YA and 37 ± 16% in OA (P = 0.16; Figure 4(c); effect size = 0.96; 1 − β = 0.57).
Cerebrovascular conductance (CVCGM; a) at baseline and hypercapnia and the absolute (b) and percent change (c) from baseline to hypercapnia in young adults (YA) and older adults (OA). *P < 0.05 versus baseline; †P < 0.05 versus YA.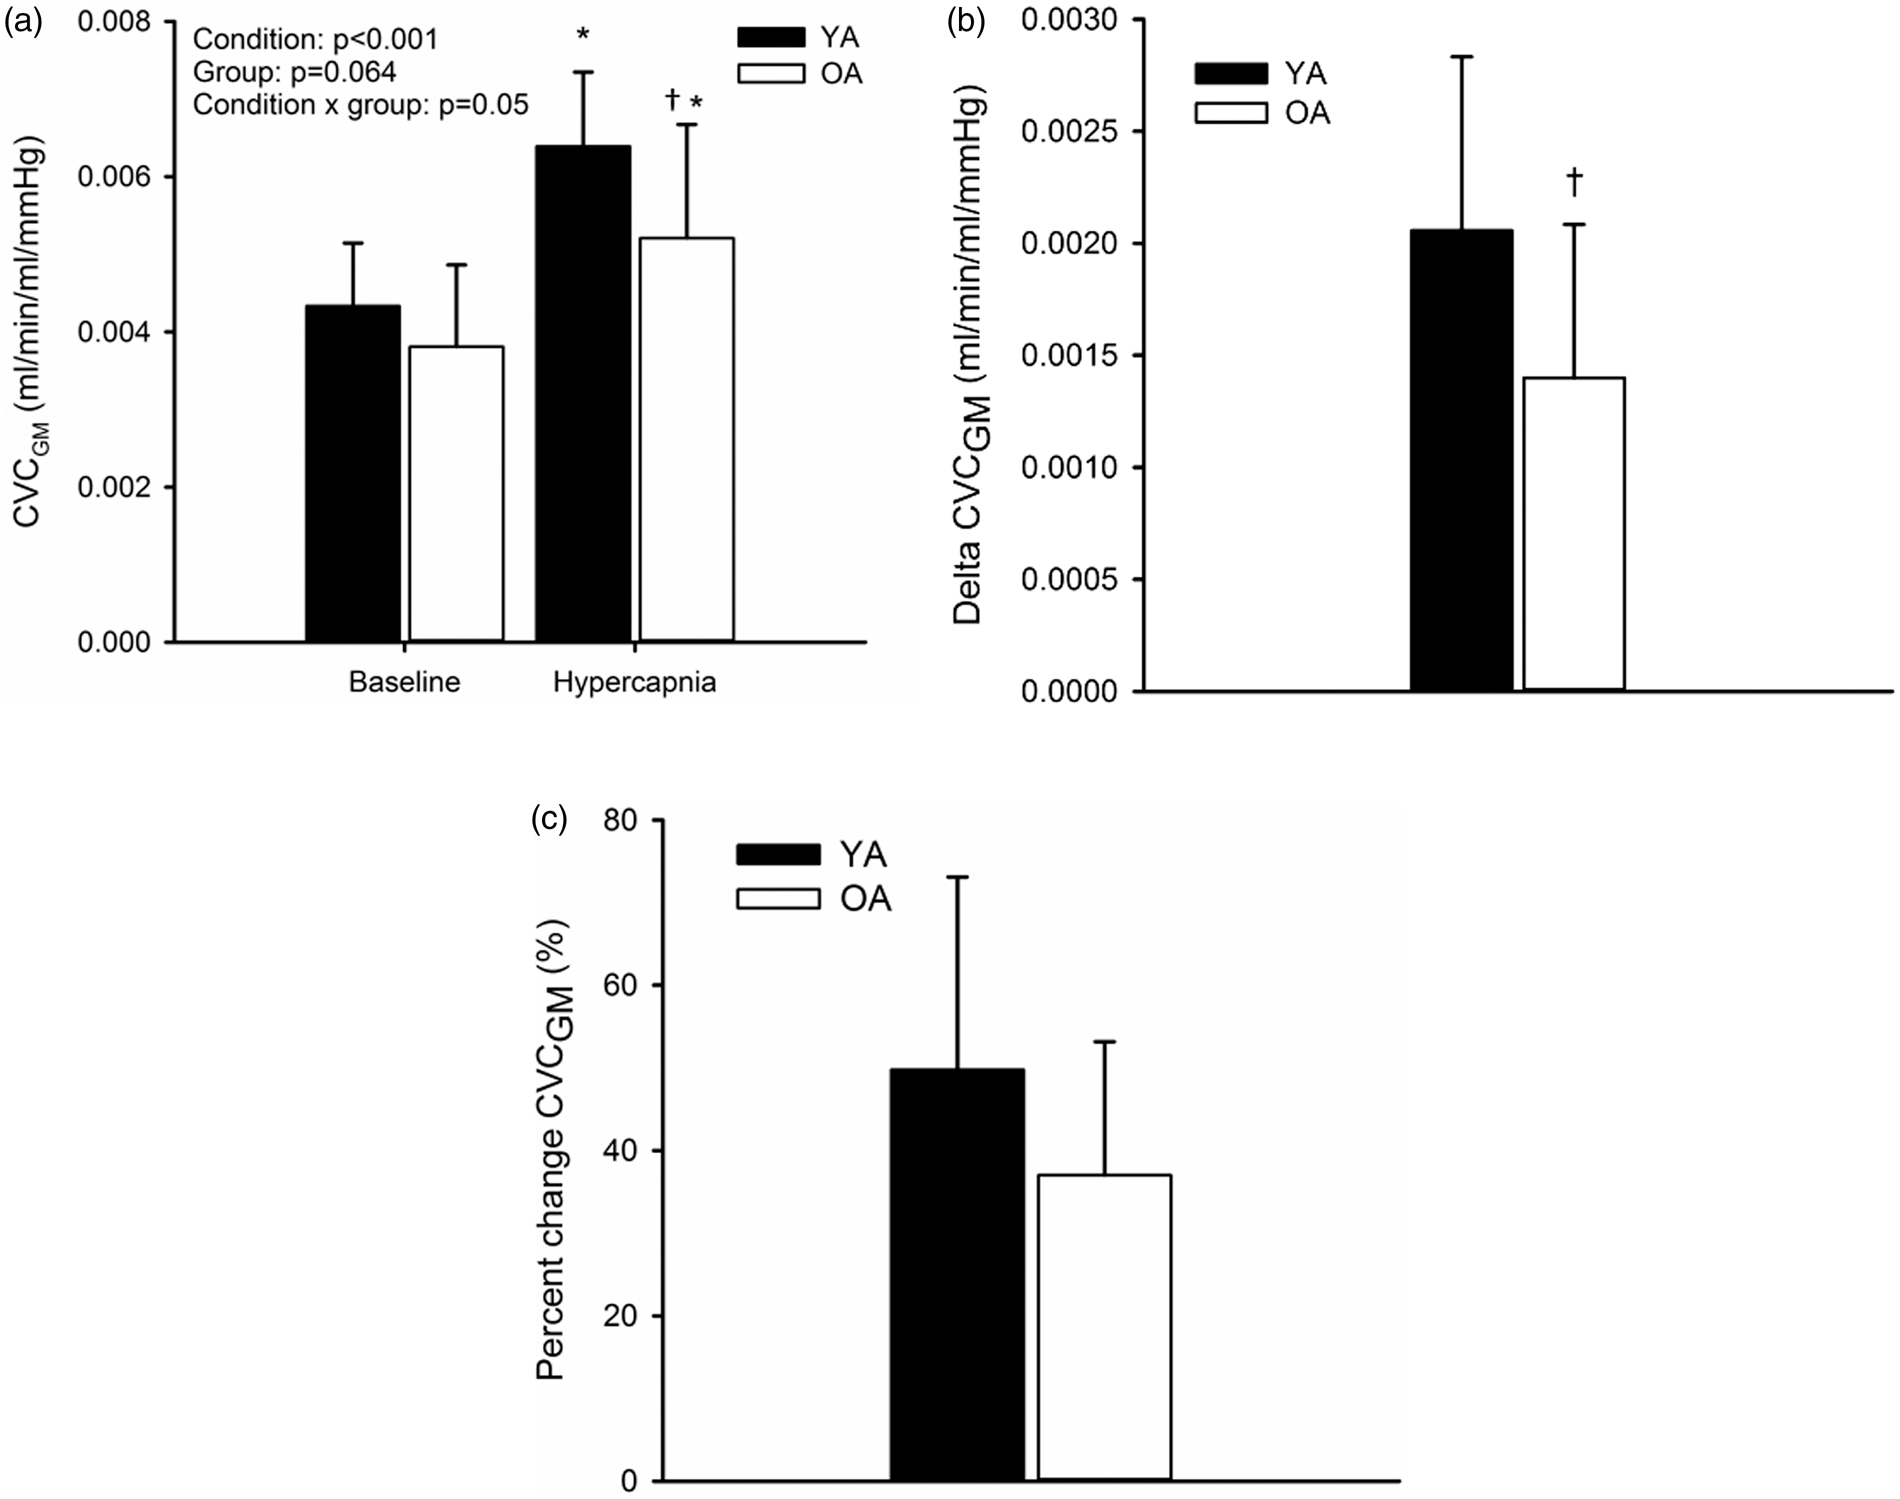
CVR was studied in absolute and relative terms using both CBFVGM and CBFGM to account for the effect of MCA CSA changes on CVR estimates. There was no effect of group (YA versus OA; Figure 5) for absolute CVR, but CBFVGM underestimated the response in comparison to CBFGM in YA when considered in relative terms (P < 0.001; Figure 5(b)). Therefore, in YA only, failure to account for MCA changes resulted in decreased relative CVRGM estimates. Additionally, there was a main effect of CBFVGM versus CBFGM for absolute CVR (Figure 5(a)).
Absolute (a) and relative (b) cerebrovascular reactivity (CVRGM) at baseline and hypercapnia in young adults (YA) and older adults (OA) and the error in calculating CVRGM when CBFVGM was used instead of CBFGM for YA and OA (c). *P < 0.05 versus CBFVGM; †P < 0.05 versus YA.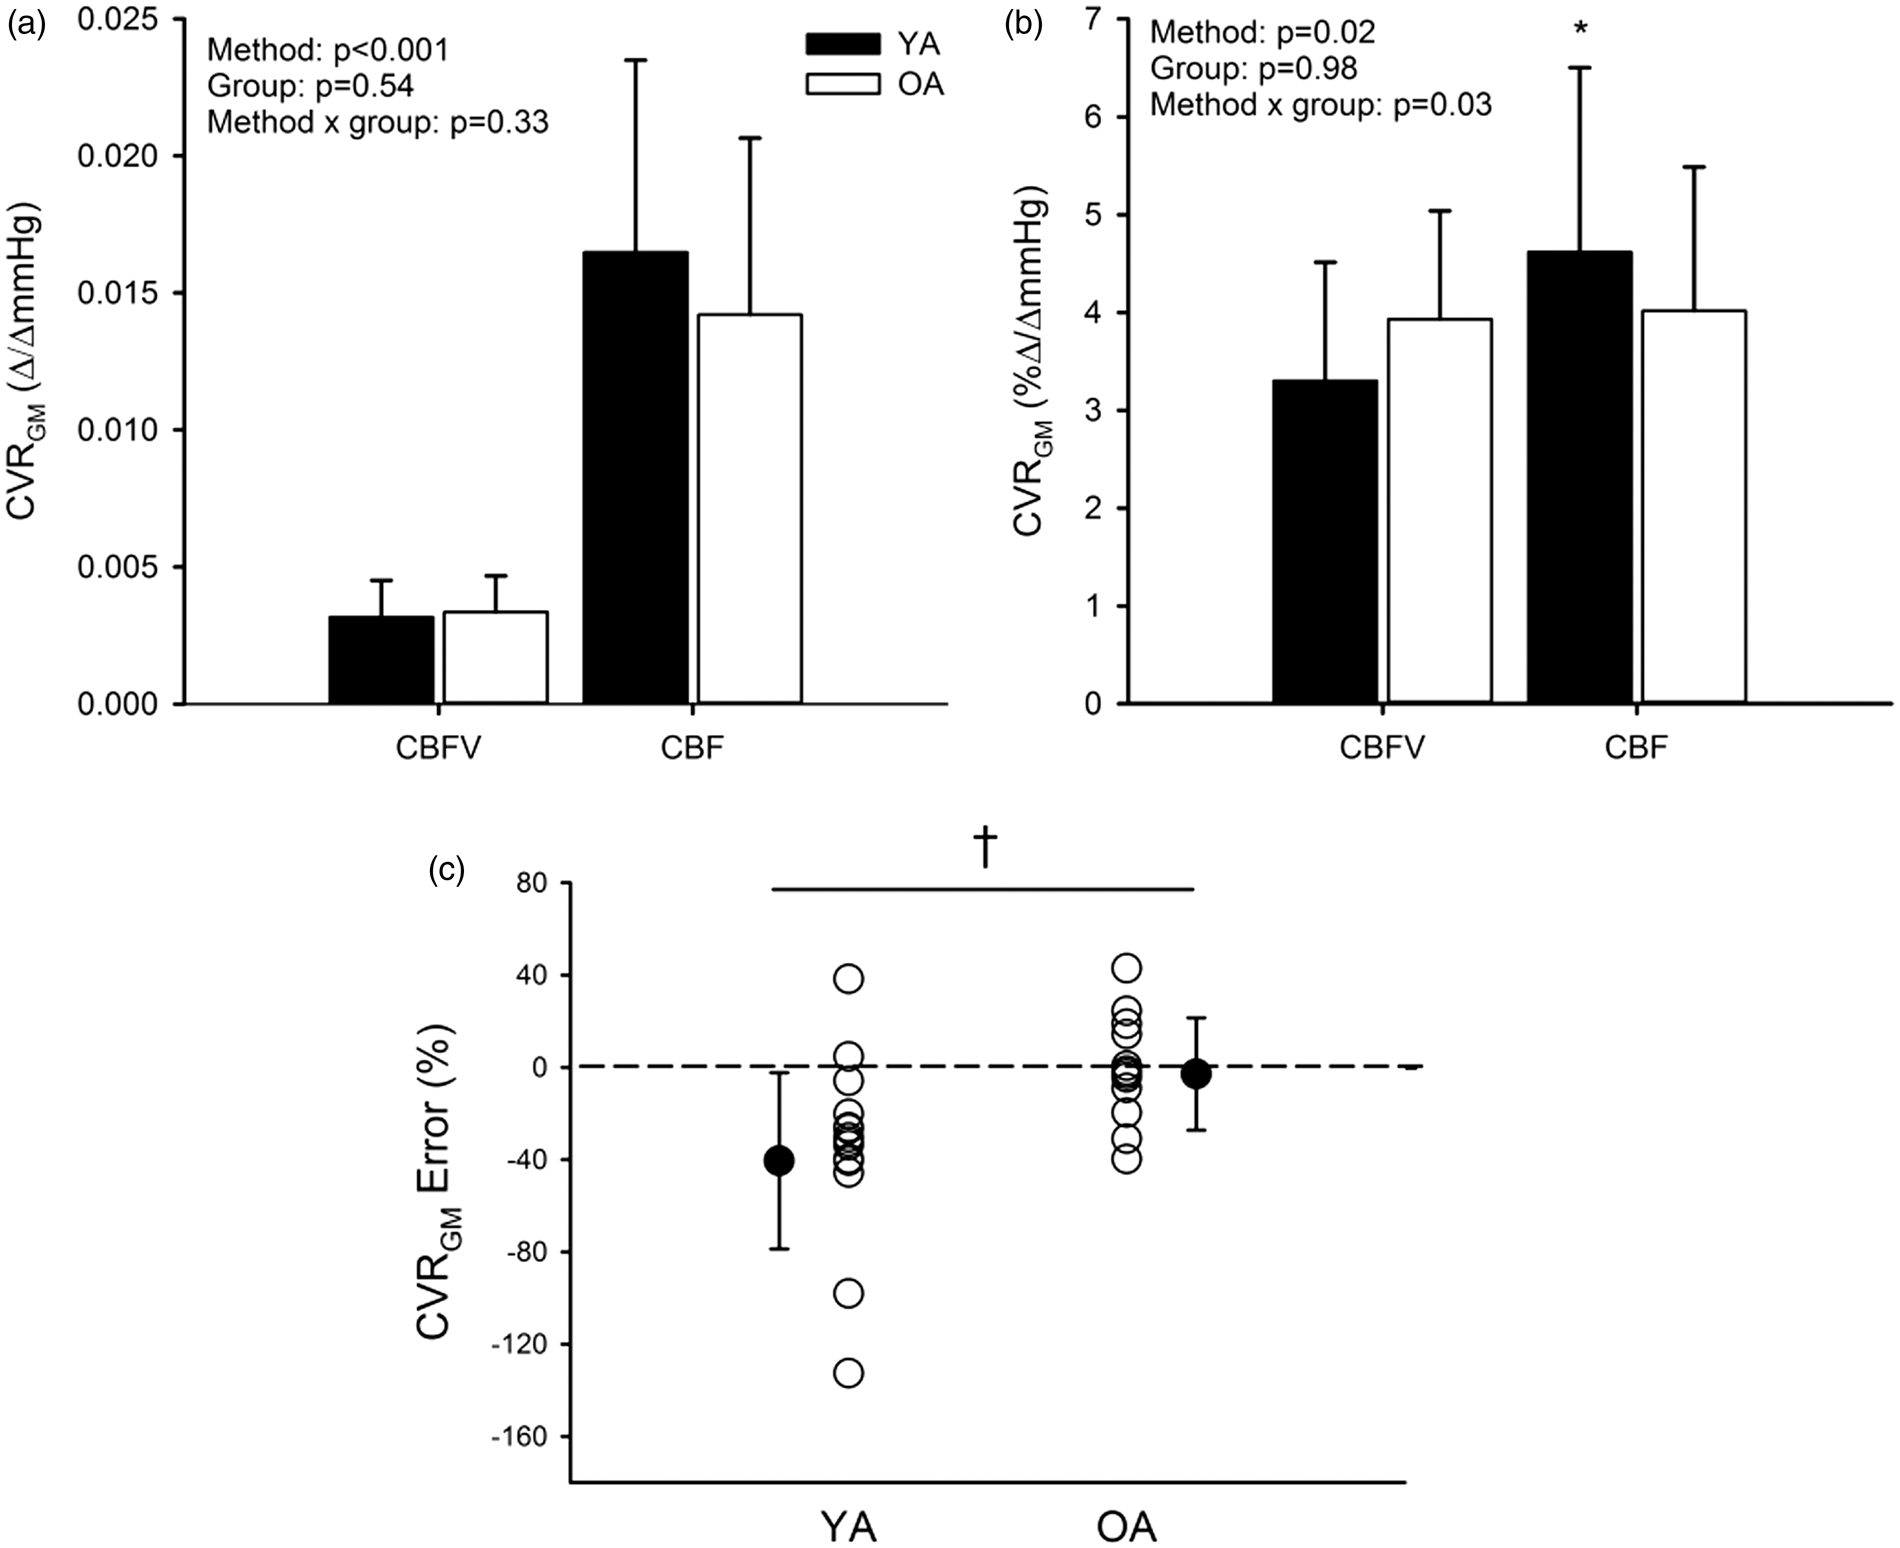
The proportionate errors created in the CVRGM estimate by not accounting for MCA dilation and subsequent use of CBFGM versus CBFVGM, are illustrated for each individual, as well as the group averages, in Figure 5(c). These data illustrate that the errors are greater in YA (−40 ± 38%) compared to OA (−3 ± 24%; P = 0.01; effect size = 1.16, 1 − β = 0.71).
Discussion
The main findings of this study are as follows: (1) age-related cerebral atrophy affected values of baseline mean flow velocity and CBF between YA and OA. (2) The increase in MCA cross-sectional area with hypercapnia was similar between groups. (3) The CVRGM response to hypercapnia was similar between the two groups due to a compensatory mean arterial pressure response in the OA group. (3) The global dilation response, as quantified by CVCGM, was diminished in the OA group for the same PETCO2 stimulus. (4) Despite the diminished dilation in OA, a compensatory MAP response resulted in a “normal” total CBFGM. Therefore, an error resulted in interpreting CVRGM as a dilation signal.
Several conclusions are drawn from these observations. First, MCA dilation was observed during the hypercapnia challenge used here in all YA and in all but two OA participants. However, age did produce a more consistent impairment of vascular reactivity to hypercapnia in the vascular bed downstream from the MCA, as indicated by the CVC data. Measures of MCA diameter (so that CBF can be calculated) but also total grey matter volume enabled determination of the impaired cerebral vasodilatory outcomes. Second these data outline the concern that the sole use of CVR may be misleading when used to study cerebrovascular health due to compensatory central hemodynamic responses.
This study provides the first observations of MCA cross-sectional area changes in young and older adults. The dilation of about 8% in YA replicates earlier results.13,14 Although we observed a difference when comparing percent change in the MCA between groups, this difference potentially was affected by the non-significant smaller baseline diameter in the YA group because the change in MCA CSA, as well as absolute values, were not different between groups. The somewhat greater baseline arterial CSA in the OA group may reflect a generalized effect of age that are reported in the carotid artery, likely as a result of the change in the elastic properties of the artery with aging. 22 Additionally, in two of the OA participants, a decrease in CSA was noted in response to hypercapnia. One of these participants was on the anti-epileptic medication. It is unclear whether this would have had an effect on our results but there is some evidence that these medications affect the peripheral vasculature; either directly or via an indirect influence by modification of risk factors. 23 For example, anti-epileptic medications may increase cholesterol levels, thus causing atherogenesis and increased IMT. 24 In this study, IMT was not different than the group average for the participant on clobazam (left IMT was 0.64 mm and right was 0.81). No apparent reason can be found to explain the second participant’s constrictor pattern. Furthermore, another of the OA participants was on warfarin. Long-term use of vitamin K-antagonists has been associated with calcification of the coronary arteries. 25 It is unclear if a similar effect occurs in the cerebral vessels. However, the change in MCA CSA with hypercapnia in this participant (0.57 mm) was similar to the group average, as was the average IMT (0.68 mm for both right and left common carotid arteries). Therefore, data for this participant were retained in the analysis. An additional important aspect of these observations is the inter-individual variability of the MCA responses to hypercapnia which was greater in the YA than OA. In fact, the YA group is characterized by considerable variability in this response, an outcome that we have observed previously in two separate groups of similarly aged individuals.13,14
Determining the mechanism(s) involved in the impaired CVC outcome in the OA group was beyond the scope of this study but may include arterial stiffening or impaired endothelial function as it pertains to hypercapnic or shear stress stimuli. Extracellular pH of the cerebrovasculature is the main mediator of the hypercapnia-induced increase in CBF 26 via an effect on potassium channels 27 and it is unclear how aging may affect these channels. In addition, nitric oxide and prostaglandins may also play a role in this response.4,28 Unfortunately, difficulties arise in studying endothelial function in the intact, conscious human brain. Nonetheless, pharmacological approaches indicate an impairment of the hypercapnic increase in CBFV following nitric oxide synthase blockade as measured with TCD in humans 29 and CBF with the 133Xe clearance method in rats. 30 Additionally, administration of a nitric oxide donor to patients with endothelial dysfunction restored CVR, measured with TCD, to levels of healthy age-matched controls. 28 However, the findings are equivocal with other studies showing no effect of nitric oxide inhibition on the response to hypercapnia in humans.31,32 Perhaps blockade of one pathway results in upregulation of another (for example, the prostaglandin pathway) since it is not the nitric oxide pathway alone that is responsible for the hyperemic response to hypercapnia. Additionally, when indomethacin is administered to block the prostaglandin pathway in humans, a difference in YA and OA in baseline TCD CBFV and CVR is abolished, a finding that suggests impairment of the prostaglandin-mediated response to hypercapnia. 4
While measures of cerebral endothelial function could not be obtained from the current study, measures of greater carotid intima-media thickness, diminished brachial artery flow-mediated dilation, and heightened levels of circulating lipids, are consistent with an overall reduction in endothelial health in the OA group.33–35 These data confirm the findings of Barnes et al. based on TCD CBFV measures. 4 Additionally, Barnes et al. 4 found no differences in CVC between young and older adults when indomethacin was administered. These findings suggest that with age, one pathway that may be altered is endothelial cyclooxygenase-mediated dilation. Our results add to these findings because they confirm that changes in CVC, calculated based on CBF rather than CBFV, are diminished in OA, and that these changes occur in the presence of peripheral vascular endothelial impairment.
A second major outcome of this study was the observation that while healthy aging may reduce the change in CVC (that is, the dilation response), this outcome cannot be concluded from standard measures of CVR. Previously, reports on the impact of age on CVR were based primarily on mean CBFV through the MCA,4,6,10,11 without taking into account the effect of MCA CSA. In agreement with previous studies, CVR calculated using CBFV in the current study was the same between groups.10,11
The discussion above outlines the problem that measures of CVRGM and CVCGM support opposing conclusions in the context of studying human cerebrovascular health. These findings lead to the question of whether CVR or CVC is a more appropriate metric for examining the dilatory capacity of the cerebrovasculature. CVR does not measure vasodilation per se, but only the flow response relative to the magnitude of the stimulus. In turn, changes in flow can be induced by either a change in downstream conductance and/or by a change in the perfusion pressure gradient. The cerebrovascular pressure gradient, comprised of mean arterial pressure, intra-cranial pressure, and venous pressure, remains difficult to measure in humans. However, the systemic blood pressure determines to a large extent the intracranial pressure gradient. Nonetheless, rarely is blood pressure measured or reported in CVR measures despite evidence that hypercapnia elevates blood pressure.10,11,36,37 The current study indicated that the pressor response to hypercapnia is greater in OA compared to YA. By accounting for changes in mean arterial pressure, the current calculation of CVCGM exposed the reduced dilatory response in the OA. Therefore, the aging process appears to include compensatory central hemodynamic responses to preserve CBF adjustments during hypercapnia despite limited cerebral vasodilation. This conclusion is preceded by evidence that MAP has an independent effect on mean flow velocity during hypercapnia. Specifically, above a threshold PETCO2, increases in mean arterial pressure with PETCO2 have a linear relationship with CBFV. 36 As well, Claassen et al. found that the magnitude of increase in an index of CVC (CBFV/MAP) during a rebreathing challenge was greater than the magnitude of change in CBFV which suggests that MAP has a direct effect on CBFV. 37 Clearly, there is an integrated response to hypercapnia that contributes to cerebral blood flow and these factors should be considered when examining CVR.
We examined the relationship between grey matter volume and cerebrovascular indices based on the idea that there is a linkage between total CBF and tissue atrophy. Previous studies have reported decreased CBFV in OA compared to YA,4–6 but did not consider the volume of brain tissue perfused. Once normalized to grey matter volume, group-based differences in baseline CBFVGM, CBFGM, or CVRGM were not evident in the current study. However, a difference in CVC between groups was present during hypercapnia even when normalized to grey matter volume. This normalization approach did not take into account the limited perfusion region of the MCA which could not be quantified in the current study. A further limitation of the current approach is that total blood flow may not reflect flow patterns at the microvascular region. For example, Chen et al. examined voxel-wise measures of cortical blood flow using MRI perfusion methods (arterial spin labelling), as well as cortical thickness, and reported that, on the voxel-wise scale, reduction in CBF with aging can be dissociated from the concurrent process of cortical atrophy. 17 Therefore, our results suggest that while an overall relationship exists between CBF and grey matter volumes, the pattern may become dissociated at the voxel scale.
In conclusion, this study was the first to show that patterns of MCA dilation, and central arterial pressor responses, form important determinants of the cerebrovascular response to hypercapnia. However, in this study, the increase in MAP to hypercapnia makes it difficult to determine whether the results reflect an age-related difference in reactivity to CO2 or to pressure-dependent vascular effects. Overall, the vascular bed supplied by the MCA, but not the MCA itself, displayed impaired dilation to hypercapnia in healthy older adults. Further, our studies support the idea that measures of CVC, normalized to brain volume, provide a more appropriate estimate of the dilatory capacity of the cerebrovasculature than a traditional estimate of CVR. In this regard, the impaired cerebrovascular dilatory response may be an important marker of cerebrovascular risk in healthy aging.
Footnotes
Funding
JKS was supported by the Canadian Institutes for Health Research (CIHR) Team Grant “Physical Activity, Mobility, and Neural Health” (grant no. 217532). NSC and MBB were funded through CIHR doctoral research scholarships.
Declaration of conflicting interests
The author(s) declared no potential conflicts of interest with respect to the research, authorship, and/or publication of this article.
Authors’ contributions
NSC and JKS took part in the conception and design; NSC and MBB took part in the data collection; NSC and MBB analyzed the data; NSC, MBB and JKS drafted and revised the manuscript; and NSC, MBB and JKS approved the final version of the manuscript.