
Abstract
Blood and cerebrospinal fluid (CSF) of 30 Fisher grade 3 aneurysmal subarachnoid hemorrhage (ASAH) patients were analyzed for the presence of the phosphorylated axonal form of the major neurofilament subunit NF-H (pNF-H), a promising biomarker of axonal injury. Patient demographic data including development of vasospasm and outcome scores at 6 months after aneurysmal rupture (AR) were evaluated. Higher pNF-H blood levels in the first few days after AR were strongly predictive of a negative outcome. Blood pNF-H levels in most recovering patients showed a steady increase into the second week after AR, presumably reflecting axonal degeneration secondary to the original insult. Almost half of the patients studied showed sudden dramatic peaks of pNF-H protein release into CSF in the 3- to 14-day time period after AR, which must reflect profound, coordinated, and secondary loss of axons. Patients in whom vasospasm was detected had significantly more pNF-H in both blood and CSF compared with those in whom vasospasm was not detected. We conclude that the analysis of pNF-H levels in blood and CSF differentiates between patients with poor and favorable outcomes and also reveals several novel features of ASAH progression and recovery.
Introduction
Cerebral arterial aneurysms may rupture, leading to a condition known as aneurysmal subarachnoid hemorrhage (ASAH), which is a leading cause of significant morbidity and mortality after hemorrhagic stroke. Current demographic data suggest that the majority of patients afflicted with this disease are less than 55 years of age, with a mortality rate approaching 50%. Most of those who survive do not recover fully (van Gijn et al, 2007). Surviving the initial hemorrhage is often associated with further complications, including rebleeding, arterial vasospasm, and hydrocephalus. The standard treatment for intracranial aneurysms is endovascular coiling or surgical clipping. During recovery, patients are monitored by various means for the onset of cerebral arterial vasospasm or other complications. Cerebral arterial vasospasm results in delayed ischemic neurologic deficits (DIND) and is an important complication, typically occurring 3 to 14 days after the initial hemorrhage. Many therapies, including calcium channel antagonists, hemodynamic therapy, magnesium, endothelin antagonists, and anticoagulants, such as tissue plasminogen activator, have been tested to combat vasospasm and DIND with variable success (Mocco et al, 2006; van Gijn et al, 2007; Weyer et al, 2006).
Biomarkers released from damaged CNS (central nervous system) tissues may provide information about the presence and progression of CNS injury in patients with neurologic problems (Rabinstein, 2006). The heavily phosphorylated axonal form of the major neurofilament subunit NF-H (pNF-H) is abundant, resistant to proteases, restricted to axons, and has unusual protein chemical properties rendering it readily detectable using antibody-based methodologies. We developed a sensitive and reproducible enzyme-linked immunosorbent assay (ELISA) for pNF-H and showed that pNF-H was present in the blood of rats subjected to experimental brain and spinal cord injuries, but not in the blood of control animals (Shaw et al, 2005). We also recently showed that the assay would detect informative levels of pNF-H in the cerebrospinal fluid (CSF) of a cohort of humans afflicted with various neurologic problems (Petzold and Shaw, 2007). Obviously, it would be of interest to examine the utility of this assay in human CSF and blood of the same individual, focusing on one particular disease or injury state. Aneurysmal subarachnoid hemorrhage patients provide several distinct advantages in this regard; the time of aneurysmal rupture (AR) is usually known and patients are prone to axonal injury not only because of AR, but also because of DIND secondary to cerebral arterial vasospasm. Access to blood samples and CSF is routine in ASAH patients over a relatively long recovery period of typically about 12 days. The patient outcome is presumably a function of the original damage done by the aneurysm and the later effects of DIND, both of which might be detectable with a suitable biomarker assay. These patients are therefore a unique population for studying the effects of initial brain injury and secondary DIND. We therefore obtained the approval of the institutional review board and appropriate patient consent to take blood and CSF samples every 6 h from 30 Fisher grade 3 ASAH patients. We hypothesized that the levels of pNF-H detectable in blood and CSF after AR would at first reflect the degree of initial AR-related injury and later the development of further injury because of DIND. We also hypothesized that pNF-H levels would reflect the amount of axonal injury, which would in turn predict patient outcome. This study reports our findings on the first 30 ASAH patients studied.
Materials and Methods
Patients
Patients admitted to the Department of Neurosurgery at the University of Florida (Gainesville, FL, USA) with ASAH and requiring external ventricular drainage were considered for this study, and were enrolled after consent was obtained. Almost all patients were admitted within 72 h after AR (average of 41.5±19.7 h). However, also included in the analysis were patients 3 and 15 who did not enter the clinic until 180 and 166 h after AR, respectively. Subarachnoid hemorrhage was confirmed by computerized tomography (CT) scanning. Aneurysms were identified by CT angiography, with or without digital subtraction angiography. Patients with Fisher grade 3 hemorrhage were included in this study if a ventriculostomy catheter was required to treat ASAH-associated hydrocephalus. Post-resuscitation Glasgow Coma Scale scores and World Federation of Neurological Surgery scores were recorded for each patient after placement of an external ventricular drain. All patients received Phenytoin (Mylan Laboratories, Canonsburg, PA, USA) for seizure prophylaxis and Nimodipine (Nimotop; Bayer Pharmaceuticals, West Haven, CT, USA) 60 mg per os every 4 h through post-hemorrhage day 15. Patients were treated by appropriate clipping or coiling, in almost all cases within 24 h of admission. Clinical onset of cerebral vasospasm was defined as the acute onset of a focal neurologic deficit or a change in the Glasgow Coma Scale score of 2 or more points. All suspected cases of cerebral vasospasm were confirmed by CT angiography and were then taken to the interventional radiology suite for cerebral angiography. Patients with cerebral arterial vasospasm were treated by intraarterial injection of the calcium channel blocker Verapamil, and/or balloon angioplasty. Patients in whom vasospasm was detected were managed with ‘triple H’ therapy (hypertension with a mean arterial pressure goal greater than 100 mm Hg, hypervolemia and hemodilution with a goal hematocrit of 30) through 12 days after hemorrhage. Patient follow-up was conducted using the Extended Glasgow Outcome Scale (GOS-E) and the Modified Rankin Scale at the time of discharge and at 3 and 6 months after discharge. The cohort is fairly typical of ASAH patients, containing 22 females and 8 males of an average age of 55 (range: 33 to 86; see Table 1).
Patients
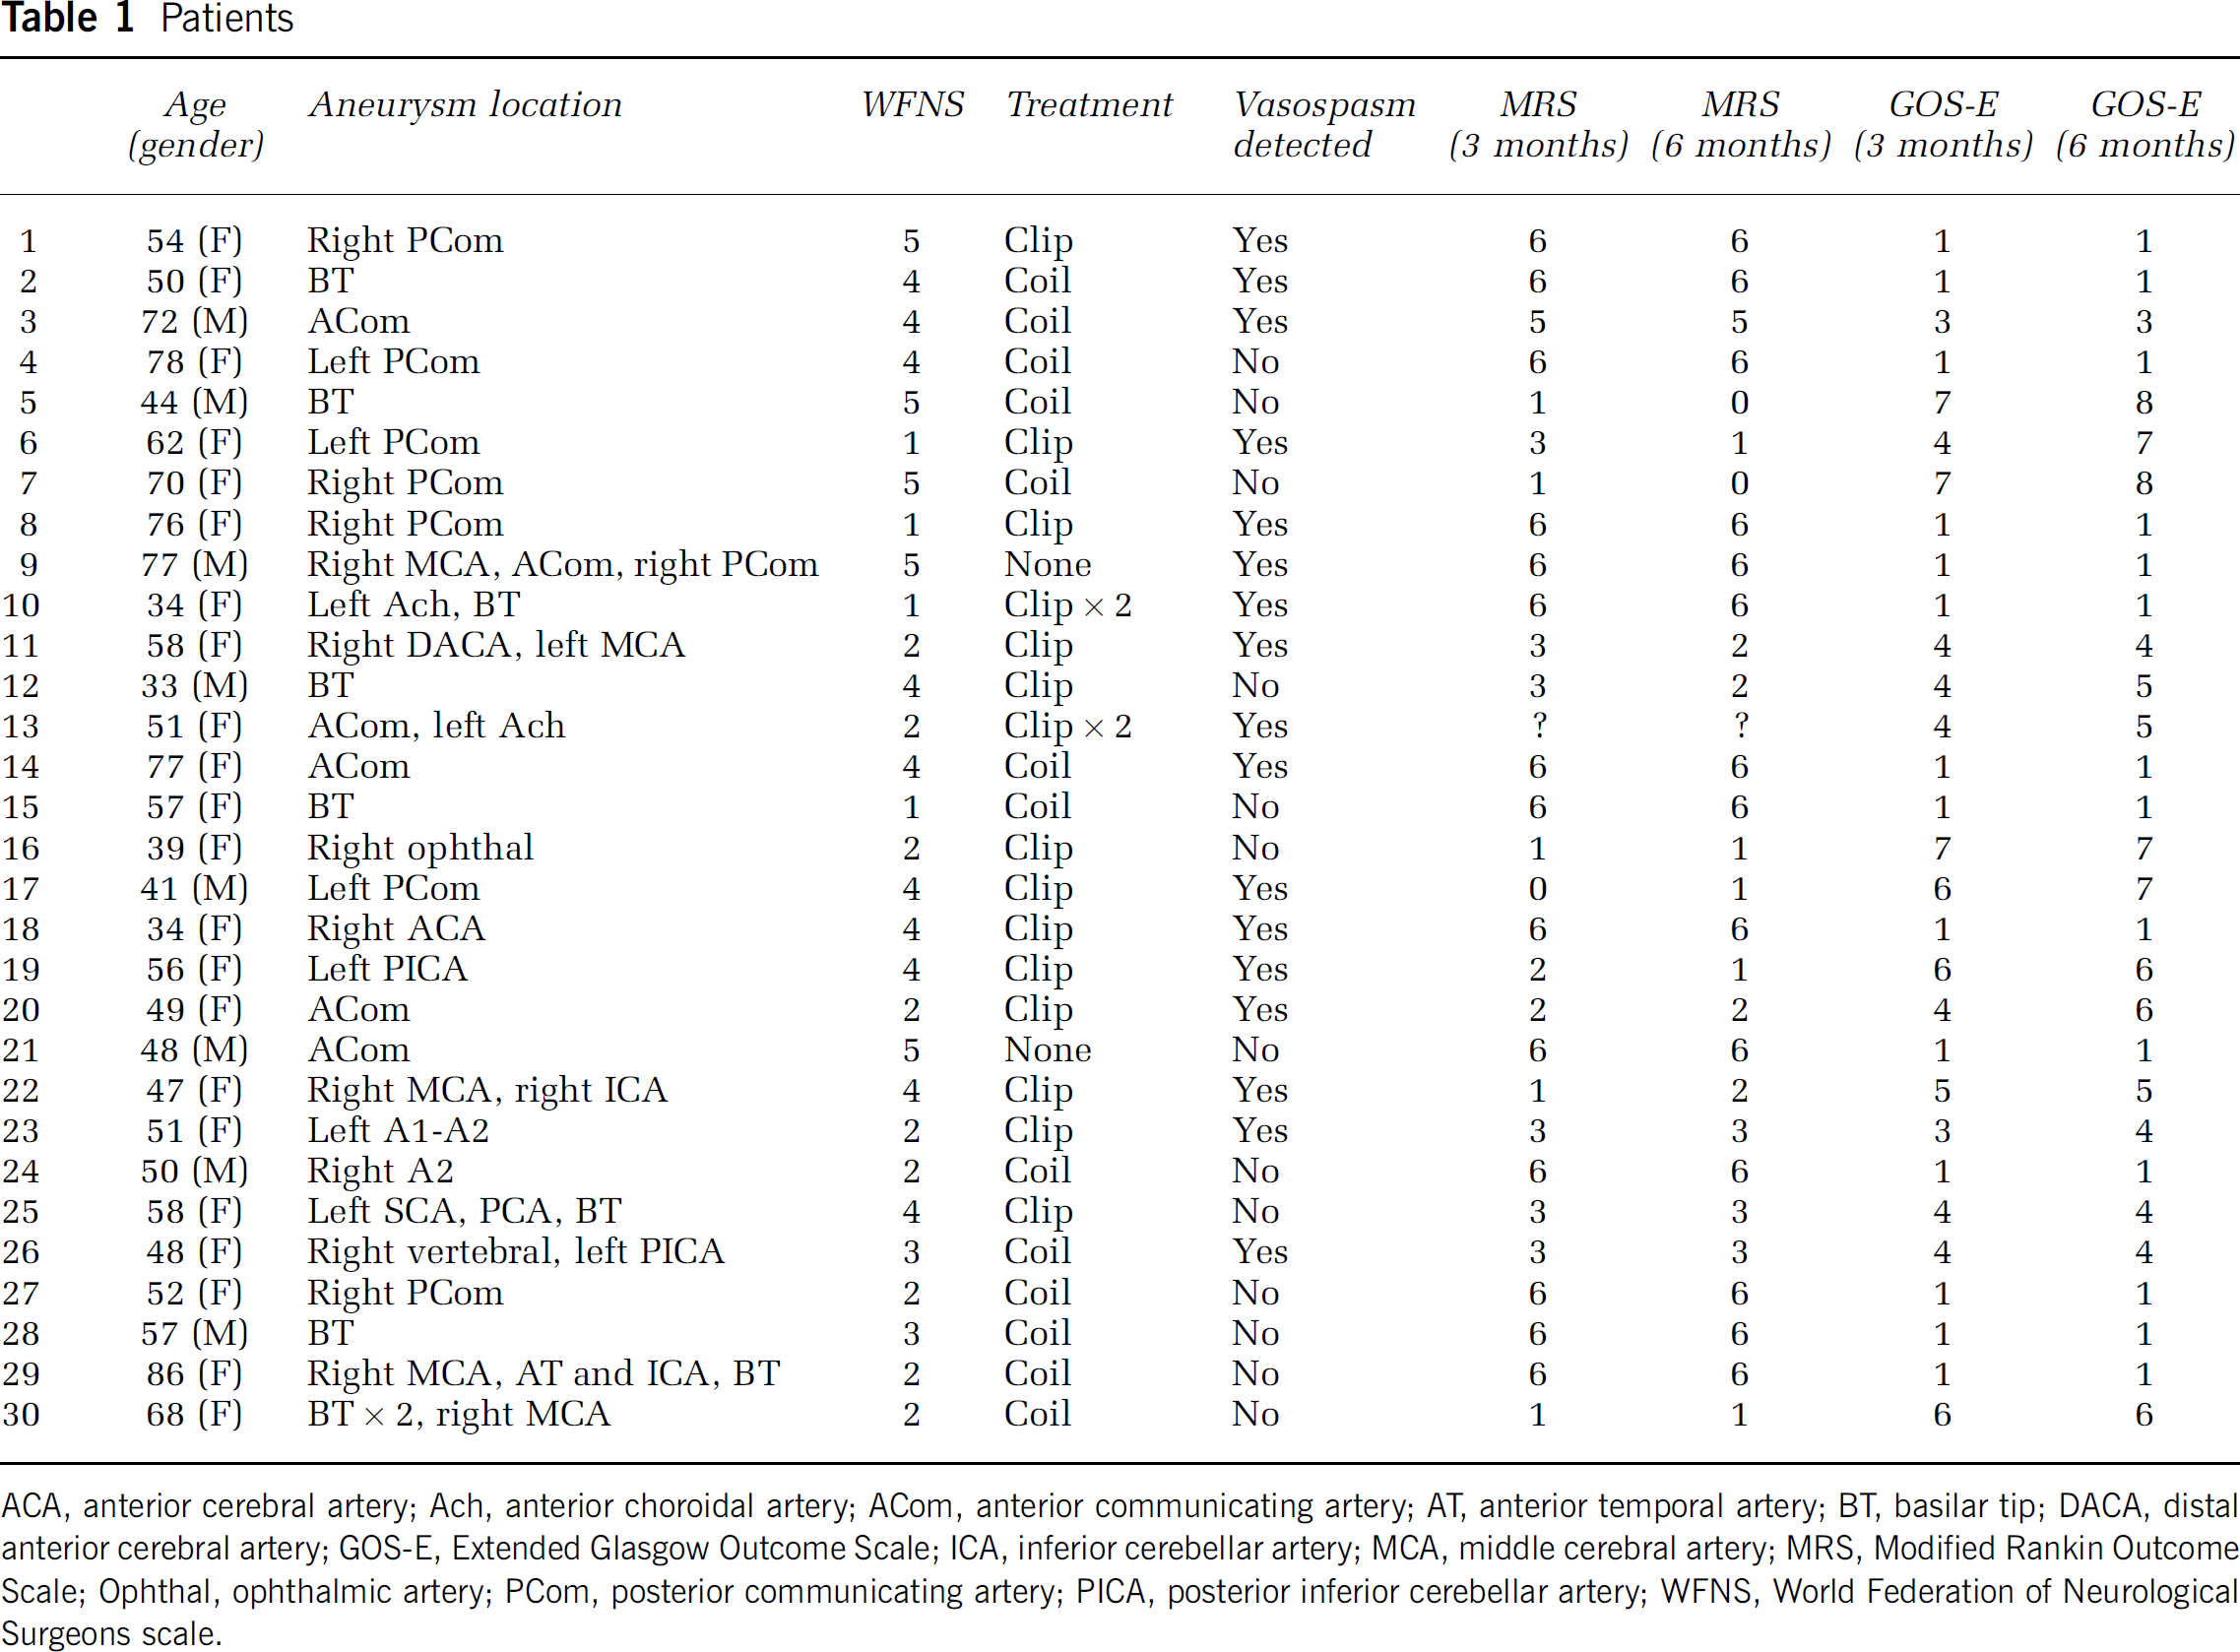
ACA, anterior cerebral artery; Ach, anterior choroidal artery; ACom, anterior communicating artery; AT, anterior temporal artery; BT, basilar tip; DACA, distal anterior cerebral artery; GOS-E, Extended Glasgow Outcome Scale; ICA, inferior cerebellar artery; MCA, middle cerebral artery; MRS, Modified Rankin Outcome Scale; Ophthal, ophthalmic artery; PCom, posterior communicating artery; PICA, posterior inferior cerebellar artery; WFNS, World Federation of Neurological Surgeons scale.
Sample
Arterial blood and CSF samples (5 ml) were obtained every 6 h starting at 0400 h each day for 8 days in the initial group of six patients and then extended for up to 12 days for the remainder. In five cases, the patient had died by the fifth day but in all other cases, a full set of samples was collected over at least 8 days. Clotted blood was centrifuged in a Sorvall RT6000B centrifuge at 3,000 r.p.m. for 10 mins. Blood and CSF samples were obtained at the time of ventriculostomy catheter placement, and, subsequently, CSF was taken from the ventriculostomy burette, an approach representing minimal risk of infection to the patients. All samples were frozen at −20°C, coded, and anonymized to ensure patient confidentiality. Researchers running ELISAs were blinded to all patient details, only being informed whether the samples were blood or CSF. Control samples of CSF and blood were obtained from age-matched patients undergoing elective non-CNS surgery.
pNF-H Assay
The pNF-H ELISA has been described previously (Shaw et al, 2005; Petzold and Shaw, 2007). Briefly, the samples were applied to standard Immulon 96-well ELISA plates coated with affinity-purified (AP) chicken polyclonal antibody to pNF-H and blocked in 1% non-fat milk in TBS (Tris-buffered saline). Typically, 5 μL of CSF or 20 μL of blood was diluted to a final volume of 50 μL in 2% non-fat milk in TBS plus 0.1% Tween-20. The CSF samples were run in duplicate, but, to conserve material for later studies, only a subset of the blood samples were duplicated. Bound pNF-H was detected with AP rabbit polyclonal pNF-H antibody, which in turn was detected with goat anti-rabbit alkaline phosphatase conjugate (Sigma, St Louis, MO, USA). Binding was visualized with 1 mg/mL p-nitrophenol (Sigma), and optical density was measured at a wavelength of 405 nm with a Biotek plate reader. A standard curve was generated using serial dilutions of purified bovine brain pNF-H on each ELISA plate.
Statistics
Preliminary data analyses were performed with the Data Analysis add-on to Microsoft Excel (Microsoft Corp., Redmond, WA, USA), with more sophisticated statistical analysis being performed with GraphPad Prism versions 4.0 (GraphPad Software, San Diego, CA, USA).
Western Blotting
The CSF samples were run on 8% SDS—polyacrylamide gels and electrophoretically transferred to polyvinylidene fluoride membranes using standard procedures and were incubated with SMI31 and SMI35 antibodies (Covance; Princeton, NJ, USA), reactive with heavily phosphorylated forms of NF-H (Lee et al, 1988), or with AP rabbit or chicken pNF-H antibodies (EnCor Biotechnology Inc., Gainesville, FL, USA), as described (Shaw et al, 2005). Membranes were incubated with the appropriate goat anti-mouse, -rabbit (Cell Signaling Technology, Danvers, MA, USA), or -chicken (Sigma) peroxidase conjugates; binding was visualized using chemiluminescent reagents (Amersham, Piscataway, NJ) and documented on a Bio-Rad digital gel documentation apparatus.
Results
Control pNF-H Levels
Blood samples from both hospital patients who did not have ruptured cerebral aneurysms and apparently healthy individuals revealed what are likely to be nonspecific pNF-H signals averaging at 0.11±0.08 ng/mL pNF-H. The levels of pNF-H in human CSF were measured in samples obtained by lumbar puncture from a cohort of individuals known with no neurologic disorders, and a normal cutoff level of 0.94 ng/mL with the current assay was deduced (Petzold and Shaw, 2007).
Blood pNF-H Levels
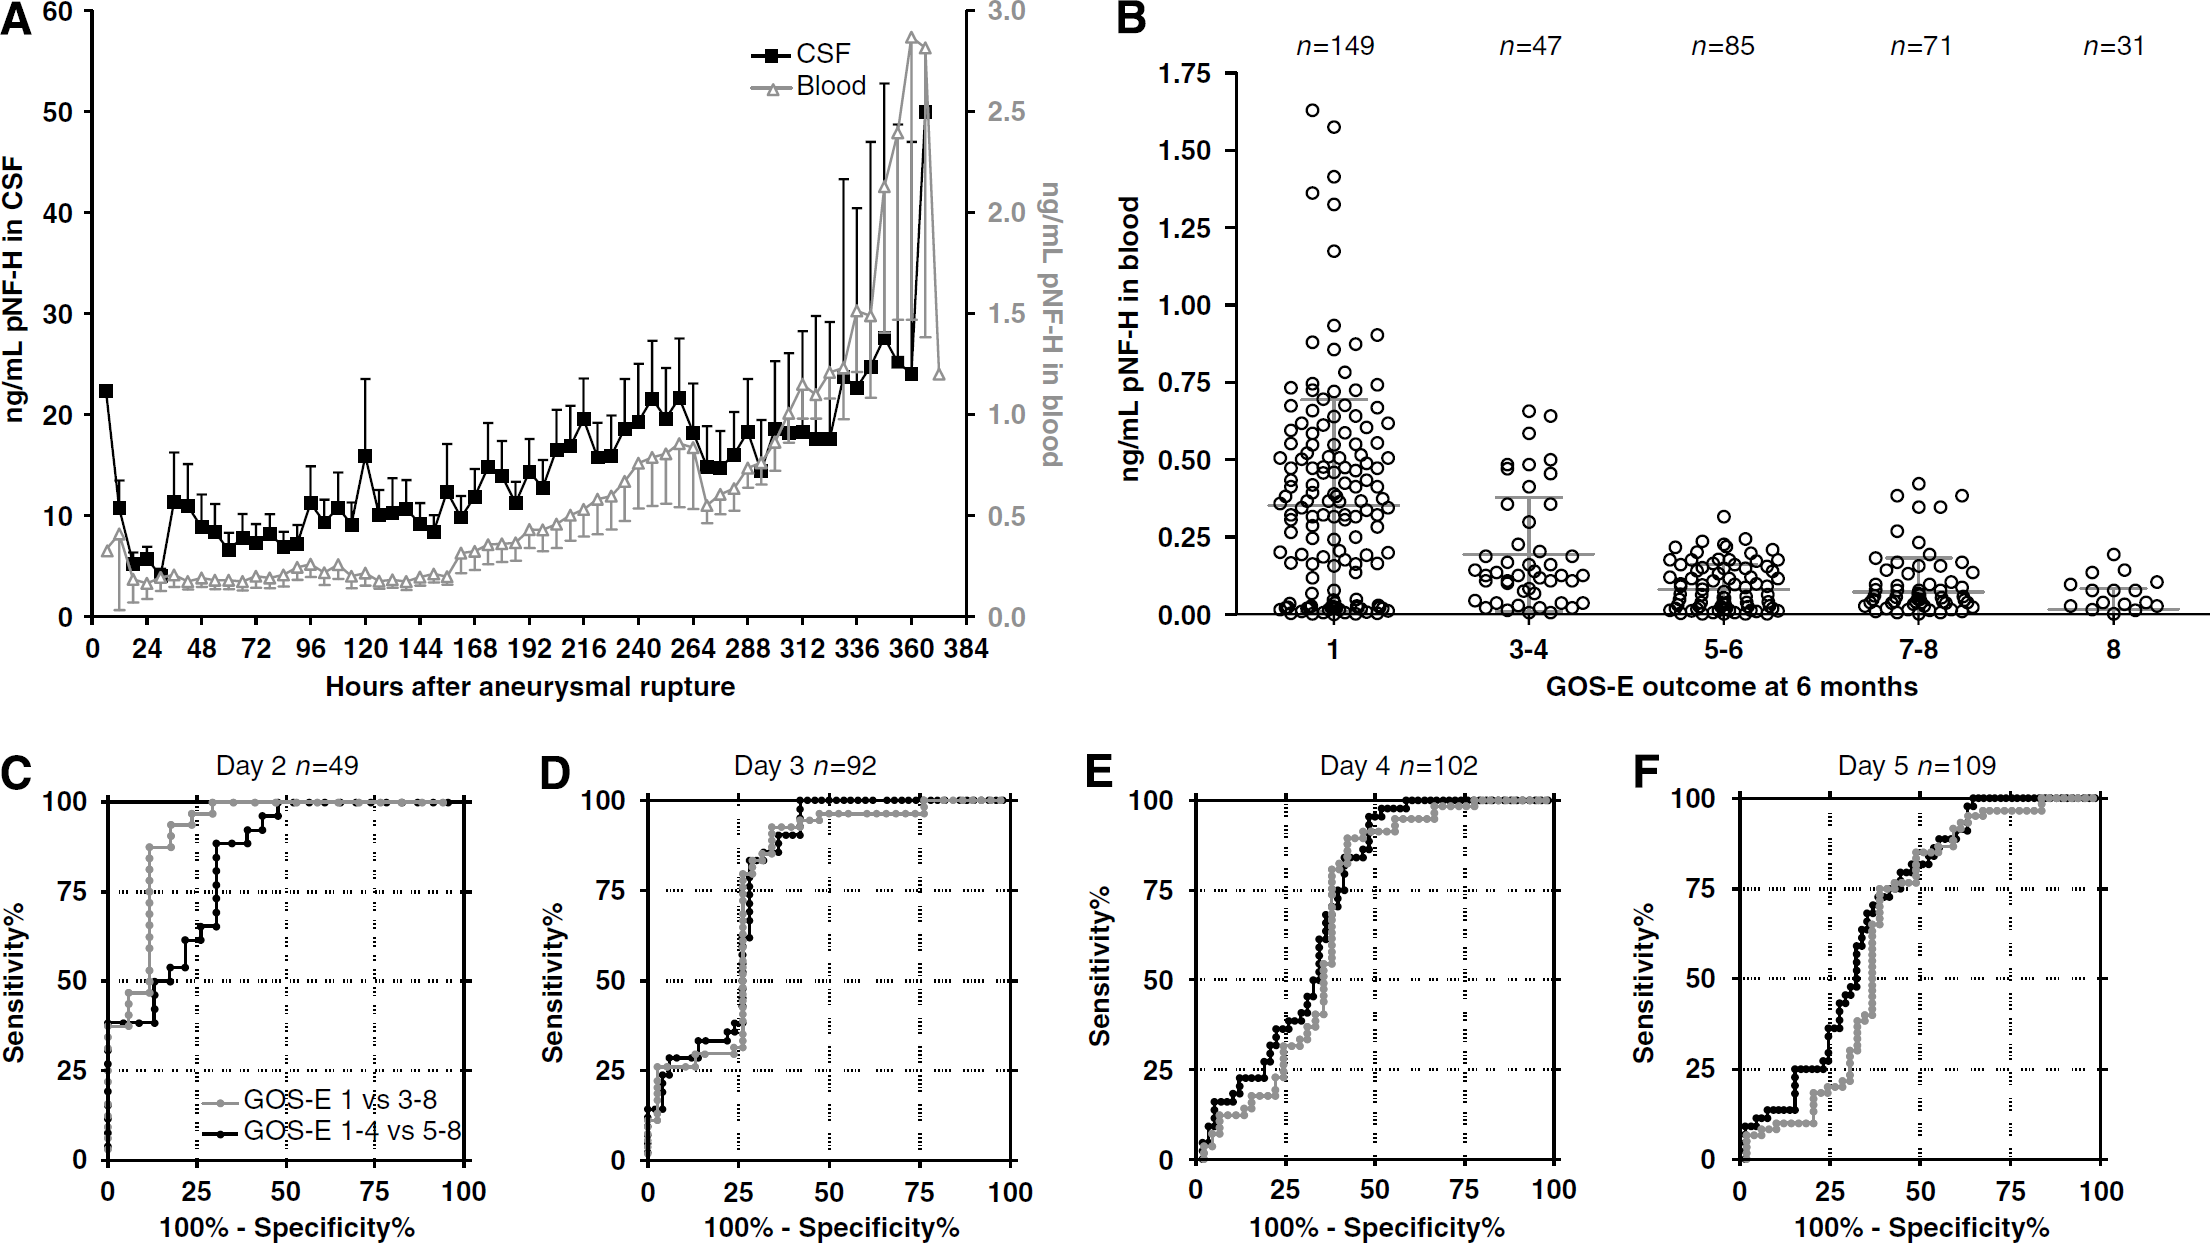
The levels of blood pNF-H detected in this cohort varied from undetectable (less than 0.05 ng/mL) to one determination of more than 6 ng/mL, with an average of 0.44±0.93 ng/mL for 1,126 samples. Figure 1 shows in red a plot of the average level of blood pNF-H after AR as a function of time, showing a persistent increase in average pNF-H levels (for data on single patients see Figures 2 and 3). Blood pNF-H levels over the period of up to day 5 after AR were studied as a function of GOS-E outcome at 6 months (Figure 1B, Table 2). Clearly, the levels of blood pNF-H in the first few days after AR were elevated in patients who died or had a poor outcome as compared with the average levels of those who survived. Figures 1C to 1F show receiver operating characteristic curves comparing blood pNF-H levels obtained on day 2 to day 5 after AR. The plot in red shows the discrimination between GOS-E 1 (death) and GOS-E 3 or better (alive) by 6 months, and the plots in black show the discrimination between GOS-E 1–4 and GOS-E 5–8 outcomes at 6 months (i.e., death or poor recovery versus better or excellent recovery). The pNF-H assay predicts a GOS-E 1 outcome on day 2 after AR at cutoff levels of 0.27 ng/mL, with 100% sensitivity and 71% specificity. The same cutoff level predicts GOS-E 1–4 versus GOS-E 5–8 outcomes at 6 months with 100% sensitivity with a specificity of 52%. The assay was 100% sensitive, predicting poor versus good outcome with appropriate blood pNF-H cutoff values on day 3 (0.21 ng/mL), day 4 (0.35 ng/mL), and day 5 (0.44 ng/mL) after AR. Clearly, the specificity declines with time after AR, but the predictive value of high blood pNF-H levels remains high throughout. We obtained only seven blood samples taken within 1 day of AR in this study, and therefore did not include these in the present analysis. However, these also showed strong predictive value: the two samples revealing pNF-H levels more than 0.5 ng/mL were from a single patient who subsequently died, and samples from two patients who survived had blood pNF-H levels below 0.35 ng/mL. Significantly, every patient showing even a single blood level above 0.7 ng/mL at any time in the first 5 days after AR was dead within 6 months, and every patient with a blood level above 0.4 ng/mL over this period either died or recovered only poorly (i.e., no better than GOS-E 4). In contrast, patients with good outcomes had very low or no pNF-H in the blood over the first 5 days after AR and throughout the assay period. However, not all individuals with low levels of blood pNF-H recover well. Data in Table 2 show the average levels of blood pNF-H in patients over 2 to 5 days after AR. The GOS-E 1 and GOS-E 3–4 groups were statistically significantly different in pNF-H level (P<0.005 ANOVA for combined 2 to 5 day post-AR data), and the GOS-E 3–4 group was significantly different from the GOS-E 5–6 (P<10−5 ANOVA) group. The GOS-E 5–6 and GOS-E 7–8 groups were not significantly different. However, the two patients in the GOS-E 8 group were significantly different from the GOS-E 5–6 and combined GOS-E 7–8 groups (P<0.02 and P<0.0005 ANOVA, respectively).
(
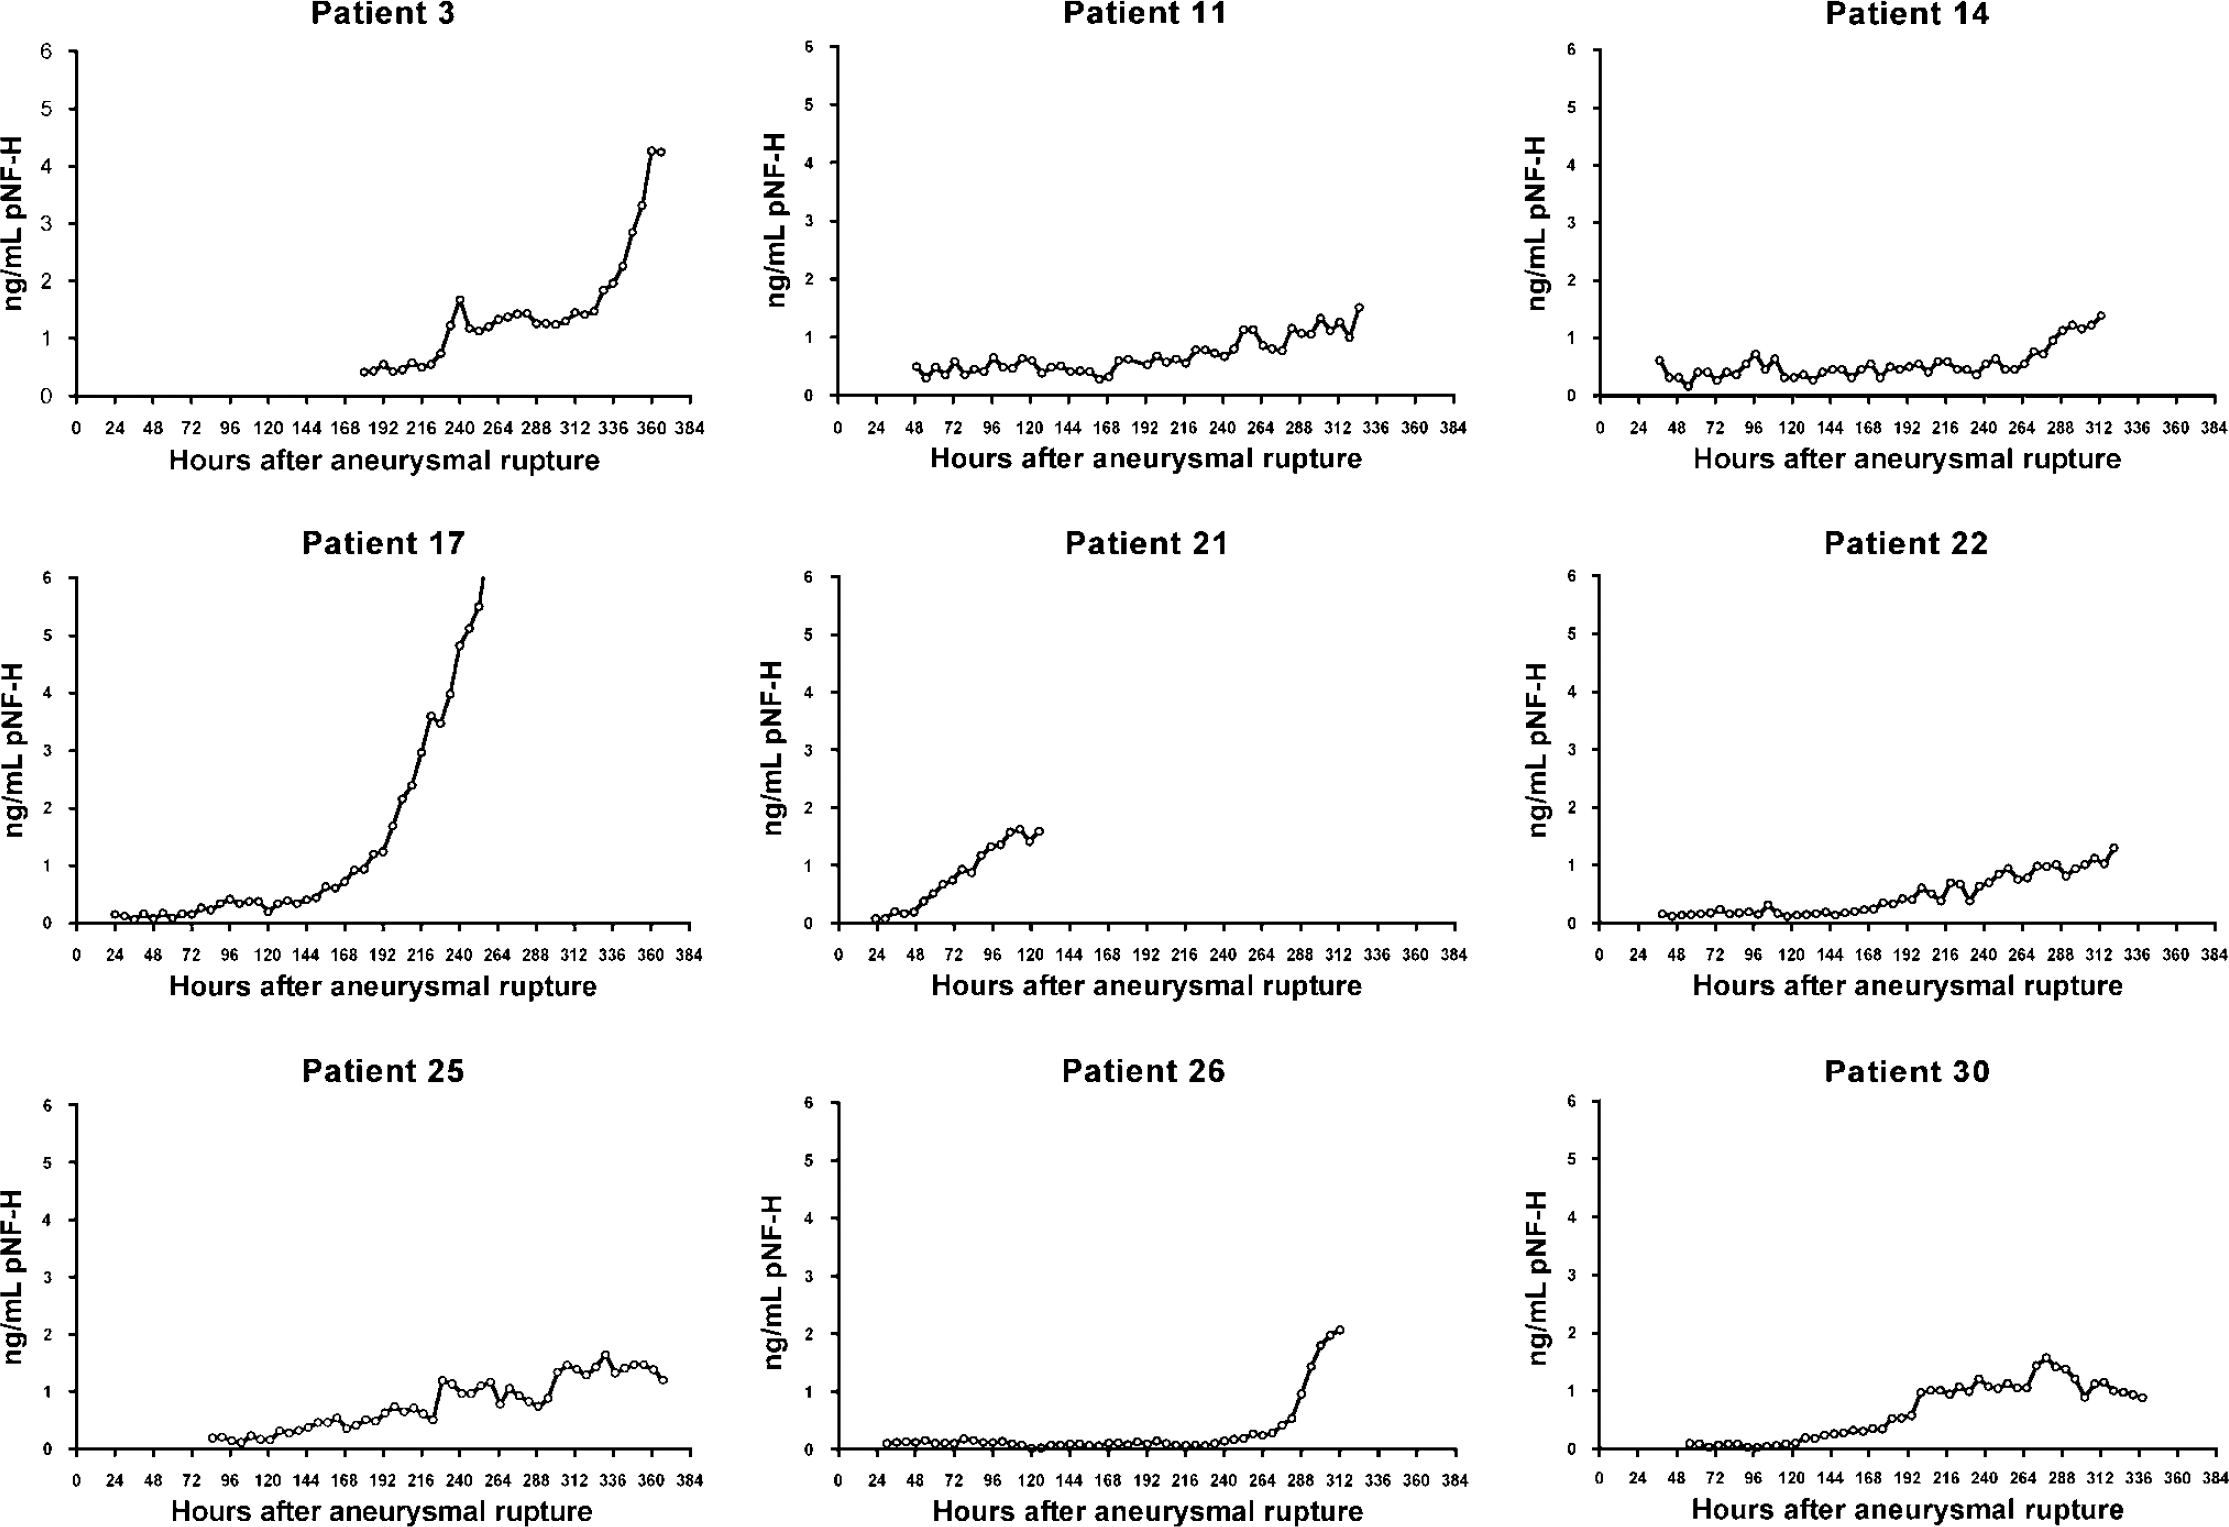
Blood pNF-H profiles for the nine patients who showed an increase in the level of blood pNF-H of more than 1 ng/mL over the assay period. Time 0 is the time of aneurysmal rupture.
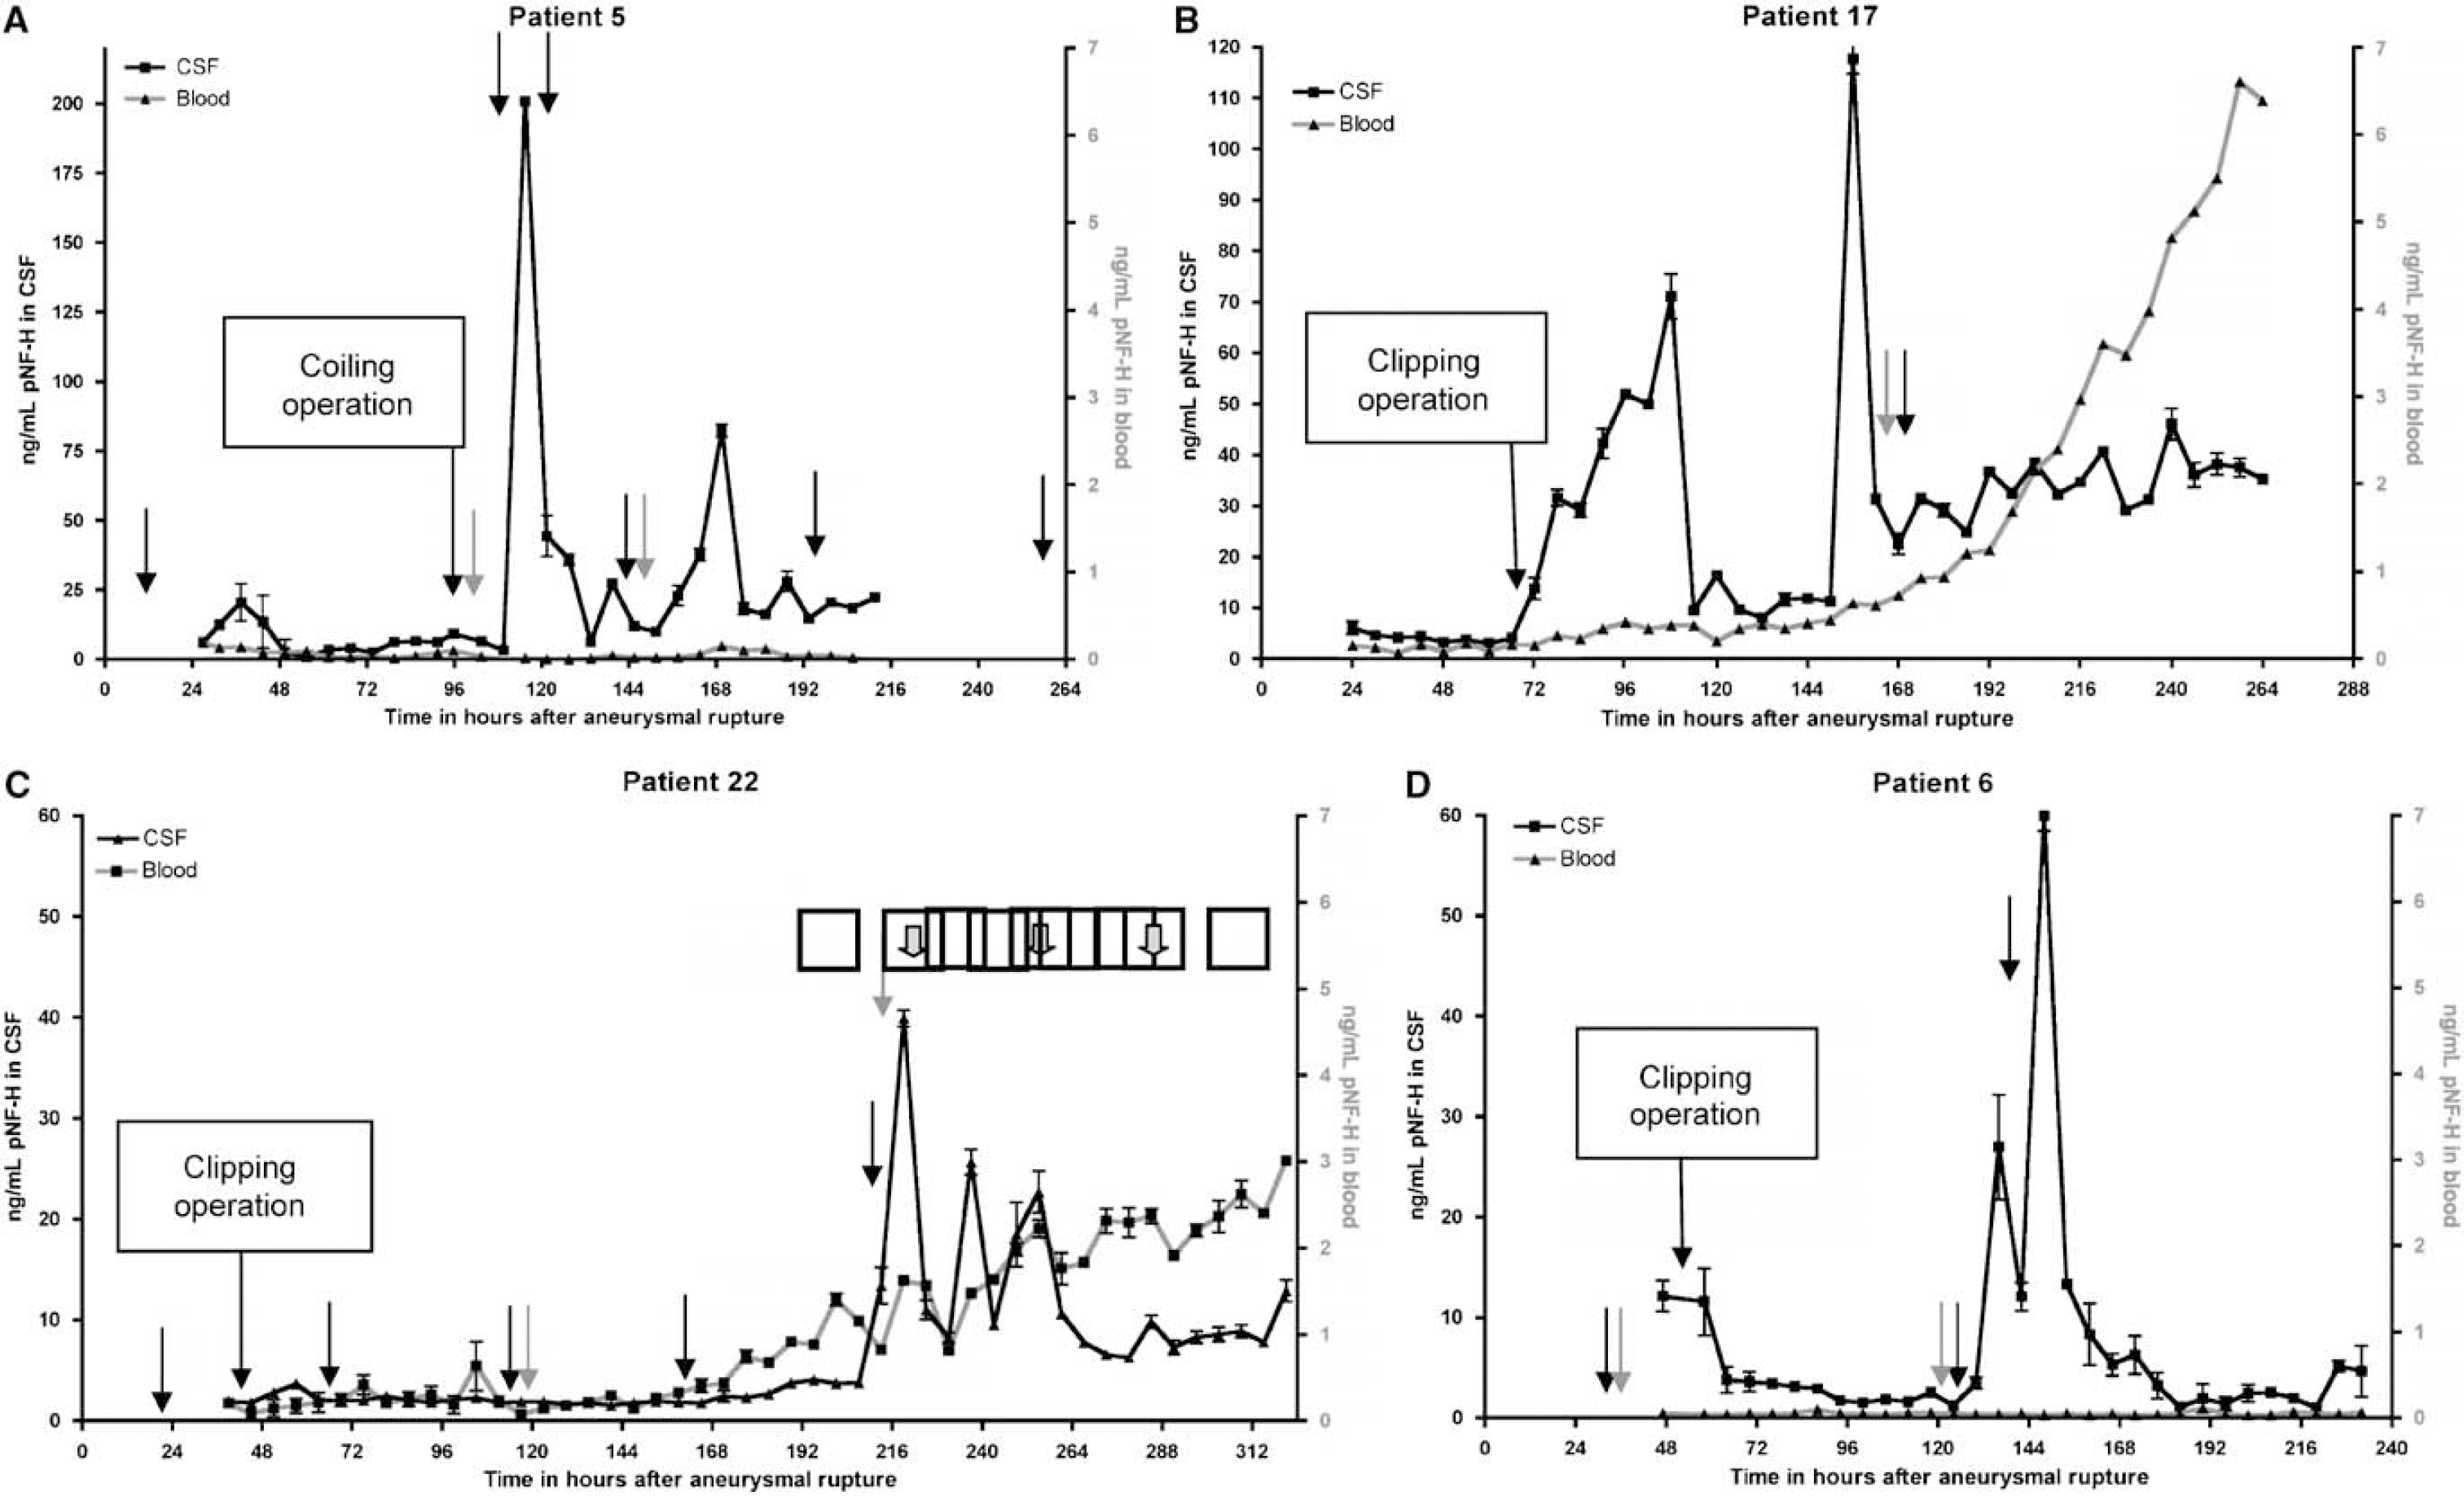
CSF and blood profiles of four selected ASAH patients. (A) Data from patient 5, (B) patient 17, (C) patient 22, and (D) patient 6. By 6 months post-AR, patient 5 recovered to GOS-E 8, patient 17 to GOS-E 7, patient 22 to GOS E 5, and patient 5 to GOS-E 7. CSF values are in black and the scale is on the left side of the plot, blood values are in red and on the right side of the plot. Note that the scales are not the same for each plot. CT and Fl-Ang analysis occurred as indicated by black and red arrows, respectively, and timing of clipping or coiling operations is indicated. Blocked out arrows in panel C show peaks in CSF which match similar smaller peaks in blood. Error bars indicate 1 s.d. Time 0 is the time of aneurysmal rupture.
Average blood and CSF levels of pNF-H±s.d. as a function of GOS-E at 6 months after AR
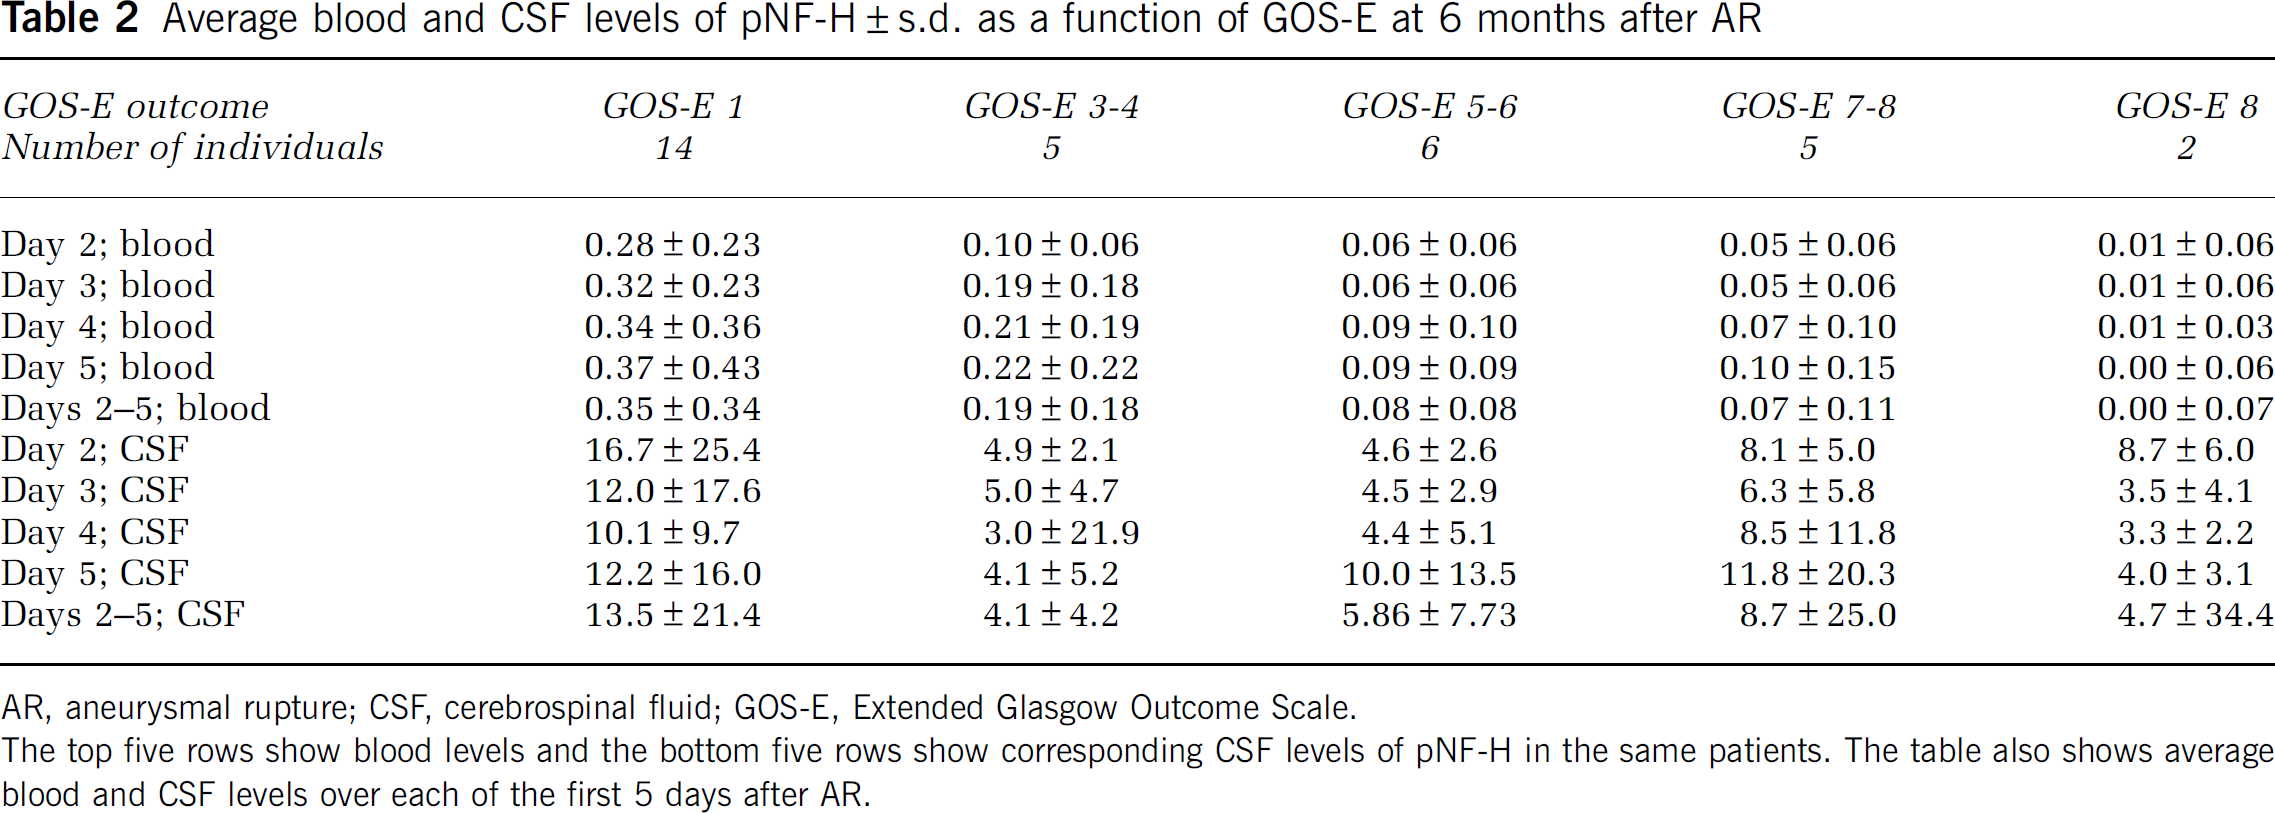
AR, aneurysmal rupture; CSF, cerebrospinal fluid; GOS-E, Extended Glasgow Outcome Scale.
The top five rows show blood levels and the bottom five rows show corresponding CSF levels of pNF-H in the same patients. The table also shows average blood and CSF levels over each of the first 5 days after AR.
A slow increase in blood pNF-H level was seen in 16 of the 30 patients and resulted in the highest blood pNF-H levels in this cohort being detected on the last days of sample collection and is also responsible for the progressive increase in blood pNF-H level seen in Figure 1. We examined all nine patients with blood pNF-H levels that increased by more than 1 ng/mL over this period (Figure 2). One of these patients died 5 days and the other 35 days after enrollment. The remainder recovered by 6 months to GOS-E 3 (one patient), GOS-E 4 (three patients), and one patient each to GOS-E 5, -6, and -7. Elevating levels of blood pNF-H amounting to more than 1 ng/mL over 8 to 12 days in the hospital appear to be a novel feature of the ASAH recovery process seen primarily in patients with poorer outcomes. In contrast, the two patients who recovered to GOS-E 8 by 6 months, the best outcome, showed undetectable levels of blood pNF-H not only in the first 5 days after AR but throughout the assay period (Table 2, Figure 3A).
Cerebrospinal Fluid pNF-H Levels
The levels of pNF-H in CSF were about 20-fold higher than in blood, with an overall average of 10.97±12.51 ng/mL (1,114 samples). As with the blood samples, average levels of pNF-H persistently increased over the assay period (Figure 1A). There was a significant difference in CSF pNF-H level between patients who either died or recovered poorly compared with those who recovered to GOS-E 5 or better, the average level for the former group being 17.34±20.12 ng/mL, whereas the latter was 9.23±14.88 ng/mL (P<0.0001 ANOVA; see Table 2). Patients with higher average levels of CSF pNF-H generally had worse outcomes, whereas those with good outcomes generally had lower levels. However, the predictive value was not as great as the blood level, one apparent reason being the sudden peaks of pNF-H release seen in many of the patients. For study purposes, we define these peaks as increases in the pNF-H concentration by 30 ng/mL or more occurring in a 6 h period. These sudden increases occurred 3 to 14 days after AR and peaks usually declined to 20% or less by 12 h (Figure 3). Of 30 patients, 13 showed at least 1 sudden peak of pNF-H release as defined above, and some patients showed multiple peaks, the total number detected being 21. Patients showing these peaks included four who died within 3 months of the aneurysm but also all five patients with 6-month GOS-E outcomes of 7 or 8. Good recovery is therefore apparently not compromised by these events.
Comparison of CSF and Blood pNF-H Profiles
Four examples documenting the novel feature of release of pNF-H into CSF and blood in the same patient are presented in Figures 3A to 3D. Patient 5 revealed generally low CSF levels of pNF-H over the first few study days followed by a very sharp and prominent peak of over 200 ng/mL pNF-H, 116 h after AR and about 18 h after endovascular coiling of the aneurysm (Figure 3A). This was the highest peak of pNF-H release detected in this cohort. This patient also developed a thrombus in the right posterior cerebral artery, interoperatively, which was treated with anticoagulants. Transient weakness in the arms and legs and the lack of a pain response coincided with the large peak of pNF-H release. However, several diagnostic CT (indicated by black arrows) and fluorescent angiography (Fl-Ang) imaging (indicated by red arrows) failed to provide definitive evidence of vasospasm. A spell of more severe unresponsiveness and weakness in the appendages followed the next day and precipitated a further analysis by CT and Fl-Ang, although again no evidence of vasospasm was seen. Eventually, vasospasm was detected by CT 2 days after the last sampling. The levels of blood pNF-H were very low throughout, declining from approximately 0.2 ng/mL to baseline over the first 2 days of sample collection. There was no obvious peak of pNF-H correlating with the major peak seen in CSF, but the second largest CSF peak at about 170 h after AR is matched by a similar, but much smaller, peak of pNF-H in blood. This patient recovered to GOS-E level 8 by 6 months, one of two patients with the best outcome.
Patient 17 underwent surgical clipping of the ruptured aneurysm on the second day in hospital, after which there was a marked increase in the level of CSF and blood pNF-H, which then returned to lower levels after about 48 h (Figure 3B). About 140 h after AR, weakness in the appendages and other neurologic changes were noted, and a few hours after the onset of these symptoms, CT showed arterial narrowing consistent with vasospasm. At approximately 160 h, Fl-Ang confirmed moderate-to-severe vasospasm. These two assessments were performed just after a sharp peak in pNF-H release into CSF. The level of blood pNF-H increased consistently from about the time the peak in CSF was seen to be more than 6 ng/mL, the highest level seen in this group of patients. This patient recovered to GOS-E 7 by 6 months.
Patient 22 recovered to GOS-E 5 by 6 months. Neurologic changes were observed 48 h after surgical clipping of the ruptured aneurysm. No evidence of vasospasm was detected by traditional diagnostic means until day 5 in the hospital or approximately 160 h after AR, when moderate vasospasm was detected by CT. Both the blood and CSF levels of pNF-H were trending upward earlier to this, but the most marked CSF release of >40 ng/mL pNF-H started at about 216 h. Just before this peak, a diagnosis of moderate-to-severe vasospasm was made by CT and Fl-Ang. Interestingly, the blood pNF-H profile also increased and revealed small peaks of pNF-H release apparently reflecting CSF peaks (small arrow at the top of Figure 3C). The correlation coefficient between the blood and CSF signals was 0.56, the fourth highest in this group of patients.
In patient 6, the levels of CSF pNF-H declined to almost 0 until approximately 5 days/124 h after the aneurysm (Figure 3D). Initially, CTs and Fl-Ang showed no evidence of vasospasm, but at about 120 h, the patient displayed a rapid onset of aphasia and Fl-Ang provided evidence for a mild vasospasm, and so the patient was treated with balloon angioplasty. Vasospasm was not confirmed by CT performed a few hours later, although evidence for a vasospasm was found from CT performed at 138 h. It is interesting that at about this time, we detected two dramatic increases in the levels of CSF pNF-H, peaking at 130 and 140 h. The levels of pNF-H in the blood of this patient were very low throughout, averaging 0.05±0.02 ng/mL over the study period, and there was no hint of a peak of pNF-H release in blood corresponding to those seen in CSF. This patient recovered well to GOS-E 7 by 6 months. Examination of these and other patient profiles suggest that vasospasm may result in the release of large amounts of pNF-H into the CSF (e.g., patients 22, 6, and 17). However, sudden peaks of pNF-H are seen in some cases where vasospasm was not detected (e.g., patient 5). Although in some cases the peaks of pNF-H release into CSF might be related to surgery (e.g., in patient 17 at ∼70 h), in most cases, the peaks appeared to be spontaneous (e.g., in patient 17 at ∼150 h, patient 5 at ∼168 h, and patient 6 at ∼140 and ∼150 h).
Levels of pNF-H as a Function of Vasospasm Detection
The average level of blood pNF-H was higher in the 17 patients in whom vasospasm was detected (0.44±0.68 ng/mL) compared with the 13 patients in whom no vasospasm was detected (0.37±0.58 ng/mL), although this difference was not statistically significant. However if the five patients who died in the first 5 days of sample collection are excluded from the group in which no vasospasm was detected, the average blood pNF-H level of the remainder is reduced to 0.29±0.44 ng/mL. Excluding these patients seems reasonable as they were most severely affected by the aneurysm, had very high levels of blood pNF-H and some, if not most or all of them, would likely have experienced vasospasm had they survived. The remaining patients in whom no vasospasm was detected have a significantly different average blood pNF-H level compared with the group in which vasospasm was detected (P<0005 ANOVA). The average CSF level of pNF-H in patients in whom vasospasm was detected was 16.7±19.9 ng/mL, whereas those in whom no vasospasm was detected was very significantly different at 7.92±13.9 ng/mL (P<10−14 ANOVA). Removal of patients who died during sample collection changed the average pNF-H CSF level to 8.3±15.3 ng/mL but did not affect the conclusion that detection of vasospasm and higher levels of CSF pNF-H are strongly related (P<10−11 ANOVA).
Western Blotting
A CSF sample that produced a signal of over 200 ng/mL pNF-H by ELISA was probed by western blotting with SMI31, SMI35, AP rabbit anti-pNF-H and AP chicken anti-pNF-H. All four antibodies revealed a band running at 220 kDa, the molecular weight expected for full-length, intact human pNF-H (Figure 4). All four antibodies also revealed faint bands running at about 140 and 100 kDa, presumably indicating proteolytic fragments of pNF-H.
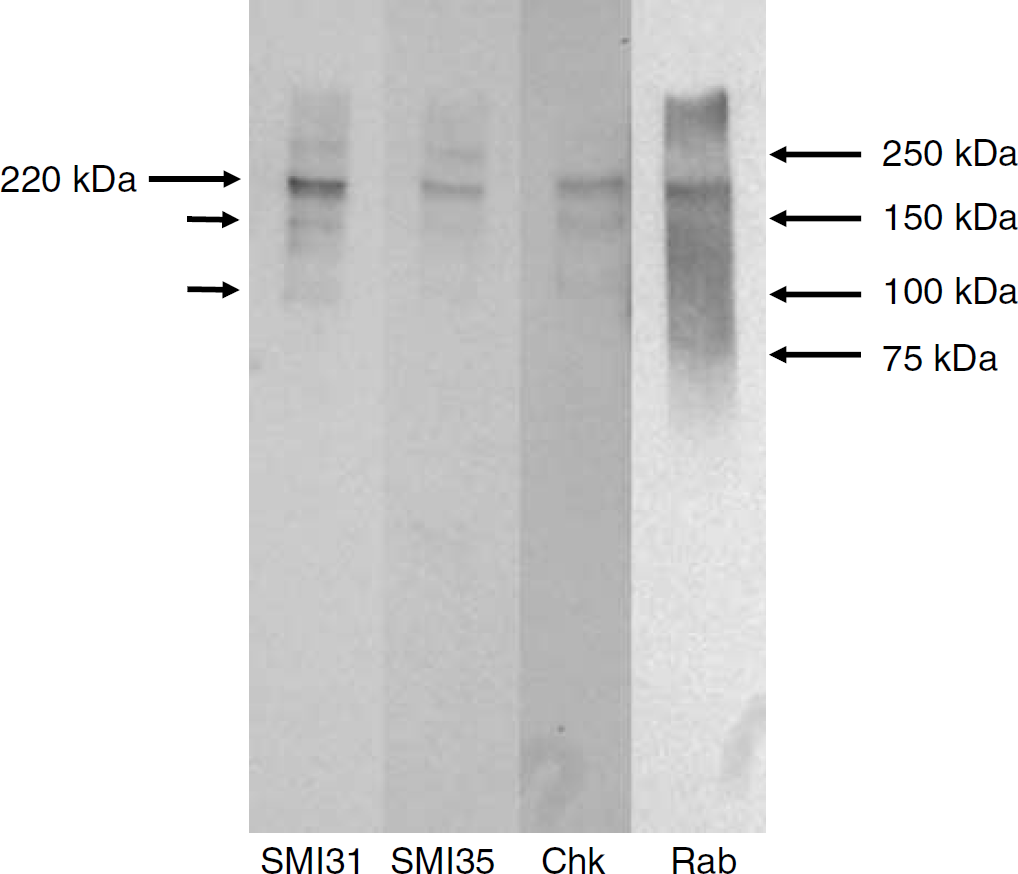
Western blotting of a CSF sample known by ELISA to contain over 200 ng/mL pNF-H. Blots were probed with SMI31 and SMI35 mouse monoclonal antibodies to phosphorylated isotypes of NF-H, and the affinity-purified chicken (Chk) and rabbit (Rab) polyclonal antibodies to pNF-H used in our ELISA. All antibodies stain a band running at approximately 210 kDa, the position expected for full-length pNF-H (arrow on the left). Smaller arrows indicate the position of what appear to be proteolytic fragments of pNF-H. Arrows and numbers on the right indicate the position of molecular weight standards.
Discussion
We show here that pNF-H can be detected in significant amounts in both blood and CSF of ASAH patients. We show that patients with blood levels of pNF-H above defined values over the first few days after AR invariably either died or had poor outcomes, whereas patients with the best outcomes had very low levels of blood pNF-H throughout. Blood levels above 0.7 ng/mL in any of the first 5 days after AR were only found in patients who died within 6 months. Blood pNF-H levels above 0.4 ng/mL in the same period were only found in individuals who either died or recovered to no better than GOS-E 4 by 6 months. The sensitivity and predictive value of the pNF-H assay with these cutoffs over this time period was 100%. These patients presumably have severe axonal injury and compromise of the blood—brain barrier (BBB) resulting from AR, and severe injury is reflected by high levels of blood pNF-H, which in turn predict a poor outcome. Importantly, levels of blood pNF-H generally change only slowly over this assay period, so that measurement at any time during the first 5 days after AR gives predictive information. In contrast, patients with the best outcomes had very low or no detectable blood pNF-H over the assay period.
A steady increase in blood pNF-H levels was seen in most patients who did not recover well and presumably reflects secondary axonal loss because of DIND. As far as we know, this delayed release of pNF-H into blood is a novel finding and provides a novel way to conveniently measure the effects of DIND. Since DIND occurs days after the initial insult, it is presumably amenable to therapeutic intervention. Measurement of blood pNF-H levels could therefore be used not only to detect DIND but also to determine the effectiveness of therapies targeting DIND in ASAH patients. Of course, the fact that we can detect pNF-H in blood is also a significant advantage, as blood is obtainable routinely and conveniently in clinical contexts.
Phosphorylated NF-H levels in CSF were on average lower in patients with more favorable outcomes, although the correlation was not as good as that seen with blood pNF-H levels. Possibly the lower correlation is related to ventriculostomy placement in relation to tissues affected by DIND, inevitably different in different patients. Another factor is the presence of transient peaks of pNF-H release seen even in patients with good outcomes. Further work will be needed to understand the significance of these sudden pNF-H release events. In some patients, they appeared to be correlated with a vasospasm event, although this was not invariably the case. However, the subtle clinical effects of moderate vasospasm are difficult to detect and may have been missed in some of these patients. The sudden peaks of pNF-H into CSF were seen from 3 to 14 days after AR, corresponding to the time window in which cerebral vasospasm and subsequent DIND most typically develop. An obvious hypothesis is therefore that sudden pNF-H release into CSF reflects axonal loss because of DIND as a result of vasospasm. Future studies will test this hypothesis by correlating these peaks of release more exactly with the physiologic state of the patient. It will be feasible and of interest to develop assays to continuously monitor the release of pNF-H and other potential biomarkers in CSF as a function of other measures, such as brain tissue oxygen pressure (Jaeger et al, 2007), transcranial Doppler imaging, (Sloan et al, 1994) and appropriate magnetic resonance and CT imaging.
There are several reasons why these sudden peaks of pNF-H release may be more common than suggested by the present findings. A total of 13 out 30 (43%) patients showed clear sharp peaks but several other patients showed increases in the level of pNF-H of 30 ng/mL or more over 12 h or more, or showed sudden increases of pNF-H release but below our arbitrary threshold of 30 ng/mL in a 6 h period. Some patients died in the first few days of study and may otherwise have experienced these peaks. Peaks of pNF-H release may have occurred after the study period in some individuals or may not have been resolved by our 6 h sampling period. In summary, these release events are likely to be a very common feature of the ASAH recovery process.
Most of the patients did not reveal an obvious relationship between the level of blood and CSF pNF-H, although a few showed a clearer relationship both by inspection and by a high correlation coefficient, in one case 0.849. Higher correlations suggest a profound breakdown of the BBB, likely to be associated with a poor outcome. In fact, the patient with the highest correlation coefficient died in the hospital, and the patients with the second and third highest coefficients recovered to only GOS-E 3 and GOS-E 6 by 6 months. In some patients, there was a clear correlation between peaks of pNF-H in CSF and smaller peaks in blood (e.g., patient 22 from ∼200 h onward Figure 3C). Such correlations always occurred later in the assay period, that is, 8 to 14 days after AR, and presumably reflected BBB breakdown as a result of DIND. In contrast, large peaks of CSF pNF-H release at earlier time points were not obviously correlated with any similar peaks in blood, suggesting that the BBB was intact. The BBB is expected to be somewhat compromised by the original aneurysm, by the subsequent operation, and perhaps more seriously as a result of DIND. The present data show that the leakage of a major axonal protein into blood is more prevalent several days after the aneurysm, presumably as a result of DIND, and is, as far as we are aware, a novel finding.
Western blotting of a CSF sample rich in pNF-H by ELISA with four different pNF-H antibodies revealed a band at 220 kDa, the size expected for intact human pNF-H. There were also weaker bands under the major band, presumably indicating proteolytic fragments of pNF-H. These findings suggest that some axonal pNF-H is stable or only partially degraded on release into CSF and support our initial rationale for examining this molecule as a potential biomarker. We note that a recent study of pediatric traumatic brain injury patients provided independent evidence that blood levels of NF-H were elevated in those with a poor outcome compared with those with better outcomes, in line with our findings (Haqqani et al, 2007). We are currently attempting the technically challenging task of characterizing the form of pNF-H released into the blood of these ASAH patients.
The current pNF-H ELISA produces a signal of 0.11±0.08 ng/mL on control human blood samples. It is possible that there is a small amount of pNF-H in the blood of healthy individuals, although it seems more likely that this represents nonspecific background in the current assay. To address this issue we are testing various modifications of our ELISA aiming to either remove this background or to show definitively that it represents a small amount of pNF-H. We have tested samples of human CSF obtained by lumbar puncture from a cohort of individuals with a variety of neurologic disorders, which showed that our assay agreed extremely well with a pNF-H assay developed independently by a collaborator (Petzold and Shaw, 2007). In this study, we concluded that the normal cutoff level for lumbar pNF-H with our assay was 0.94 ng/mL. For the present study, we could not obtain samples of ventricular CSF from healthy individuals for obvious ethical reasons. The ventricular content of neural proteins may be up to 3.5 times higher or lower than the lumbar content (Reiber, 2003). However, we noted that many CSF samples from hardly healthy individuals in the present study contained less than 0.94 ng/mL pNF-H, suggesting that normal pNF-H levels of both ventricular and lumbar CSF are likely to be less than this value, and far less than the levels detected in many of the samples tested here.
Recently, Petzold et al (2006) made use of their pNF-H ELISA to examine the CSF of a cohort of 17 ASAH patients. This study noted higher and increasing levels of pNF-H in the CSF of patients with poor outcome, whereas patients with better outcome showed lower and reducing levels, which our findings confirm. However, these authors did not comment on pNF-H in blood or on transient peaks of pNF-H release into CSF. We sampled every 6 h, as opposed to daily, and sampled over 1,100 CSF samples as opposed to 148, and so were perhaps more likely to detect such transient peaks of pNF-H release. Another recent study describes detection of the neurofilament subunit NF-L in the CSF of ASAH patients (Nylen et al, 2006). NF-L was measured 10 to 14 days after AR, and patients with higher levels were shown to have worse outcomes. Since NF-L and pNF-H are both major components of axonal neurofilaments, the level of NF-L would be expected to mirror that of pNF-H, although we have not examined this experimentally. Our present work therefore extends previous studies by providing several new details of the release of a neurofilament protein into CSF and blood in ASAH patients.
Other studies of biomarkers in patients with ASAH are limited. Lin et al (2006) studied the levels of F2-isoprostane in the CSF of a small group of ASAH patients and found somewhat elevated levels in three patients who suffered from DIND. However, the results were not as striking as those presented here, with the maximum amount of isoprostane expression being only roughly twice of that seen in individuals who did not have delayed ischemia. The pNF-H assay produces much sharper and well-defined signals and may therefore be more discriminatory of the onset of ischemia. Another blood marker of stroke, neuron-specific enolase, an abundant protein expressed heavily in neurons and in earlier publications appeared to be a promising biomarker (Schaarschmidt et al, 1994). However, most later studies suggest that it is unreliable in general use (Anand and Stead, 2005). Oertel et al (2006) compared S-100β and neuron-specific enolase as biomarkers of subarachnoid hemorrhage and vasospasm in the blood of ASAH patients over the first 3 days after admission. They found, paradoxically, that S-100β levels were significantly lower in patients who experienced vasospasm, whereas overall S-100β levels were higher in patients who died. Neuron-specific enolase levels proved to be less predictive of outcome. Work that is now in progress will compare the release profiles of S100β, neuron-specific enolase, and pNF-H in the present cohort of patients.
The present work raises many new questions. The relationship of the sudden peaks of pNF-H release into CSF and slow increases in the level of pNF-H in blood needs to be firmly tied to the underlying cause such as cerebral arterial vasospasm and/or other specific events in the progression of ASAH. The exact forms of pNF-H being detected must be characterized, as different forms may be present in CSF and blood at different times after AR or after different types of axonal degeneration. Based on this work, it may be possible to develop even more specific, selective, and informative pNF-H assays. Clearly, much more investigation will be required to resolve these interesting issues.