
Abstract
The molecular mechanisms underlying the systemic response to subarachnoid hemorrhage (SAH) from ruptured intracranial aneurysms (RAs) are not fully understood. We investigated whether the analysis of gene expression in peripheral blood could provide clinically relevant information regarding the biologic consequences of SAH. Transcriptomics were performed using Illumina HumanHT-12v4 microarrays for 43 RA patients and 18 controls (C). Differentially expressed transcripts were analyzed for overrepresented functional groups and blood cell type-specific gene expression. The set of differentially expressed transcripts was validated using quantitative polymerase chain reaction in an independent group of subjects (15 RA patients and 14 C). There were 135 differentially expressed genes (false discovery rate ≤1%, absolute fold change ≤1.7): the abundant levels of 78 mRNAs increased and 57 mRNAs decreased. Among RA patients, transcripts specific to T lymphocyte subpopulations were downregulated, whereas those related to monocytes and neutrophils were upregulated. Expression profiles of a set of 16 genes and lymphocyte-to-monocyte-and-neutrophil gene expression ratios distinguished RA patients from C. These results indicate that SAH from RAs strongly influences the transcription profiles of blood cells. A specific pattern of these changes suggests suppression in lymphocyte response and enhancements in monocyte and neutrophil activities. This is probably related to the immunodepression observed in SAH.
INTRODUCTION
Subarachnoid hemorrhage (SAH) is a devastating condition with high mortality and high disability rates.
1
Molecular mechanisms underlying systemic responses to the rupture of an intracranial aneurysm are poorly recognized. Circulating blood cells are notably sensitive to pathologic processes affecting the body. Changes in gene expression in peripheral blood cells in response to different pathologies have been demonstrated in a variety of disorders including stroke.2-4 Recently, Weinsheimer
The recognition of genes that are regulated in response to rupture of an aneurysm should provide deeper insight into molecular mechanisms of SAH. In particular, this could allow the identification of the pathophysiological pathways involved in the systemic consequences of SAH from RAs, as well as potential disease-related biomarkers, which would be useful for developing new strategies for optimal patient management.
In this study, we investigated the systemic response to rupture of intracranial aneurysms through an analysis of global gene expression profiles in peripheral blood cells. We also sought to determine whether this approach could provide clinically relevant biomarkers.
SUBJECTS AND METHODS
Patients
Patients with SAH from RAs were prospectively recruited from patients consecutively admitted to the Departments of Neurology or Neurosurgery and Neurotraumatology, University Hospital, Krakow, in 2010 and 2011. Patients with head trauma, vasculitis, arteriovenous malformations, hematological disorders, and known malignancies were excluded. Subarachnoid hemorrhage was diagnosed by cranial computed tomography and/or lumbar puncture. The presence and location of intracranial aneurysms were established using digital subtractive angiography and/or angio-computed tomography. Controls (C) were recruited from patients of the Department of Neurology who were suffering from headaches.
Two independent sets of subjects consisting of both RA patients and C were investigated. The first set of subjects recruited in 2010 (Set 1) was used for the microarray analysis and a subsequent quantitative real-time polymerase chain reaction (qPCR) validation. Set 2 (recruited in 2011) was used for validation purposes only.
Demographics and risk factor data were collected using a questionnaire. All subjects were Caucasian. Differences between groups were analyzed using χ2 or Mann-Whitney tests where appropriate. P<0.05 was considered statistically significant.
Informed consent was given by all subjects or family members before inclusion in the study. The Jagiellonian University Ethics Committee approved the study.
Blood Collection and RNA Extraction
Venous whole blood was collected before neurosurgical interventions in PAXgene Blood RNA Tubes (PreAnalytiX, Hombrechtikon, Switzerland) and was mixed and kept at room temperature for at least 2 hours. The tubes were subsequently frozen and stored at −70°C until further processing. Total RNA was purified from blood samples using PAXgene Blood RNA Kit (PreAnalytiX) according to the manufacturer's protocol and was treated with DNase. RNA concentrations were measured using a NanoDrop ND-1000 Spectrophotometer (NanoDrop Technologies, Montchanin, DE, USA), and RNA quality was determined by chip-based capillary electrophoresis utilizing an RNA 6000 Nano LabChip Kit and an Agilent Bioanalyzer 2100 (Agilent, Palo Alto, CA, USA) according to the manufacturer's protocols.
Quantitative Real-Time Polymerase Chain Reaction Reverse transcription (RT) was performed using an Omniscript RT Kit (Qiagen, Valencia, CA, USA) at 37°C for 60 minutes. RT reactions were performed in the presence of an RNase inhibitor (rRNasin; Promega, Madison, WI, USA) and an oligo(dT12-18) primer (Invitrogen, Life Technologies, Carlsbad, CA, USA). Next, cDNA was diluted 1:15 with H2O, and approximately 40 ng of cDNA synthesized from the total RNA template extracted from blood from individual patients was used for each reaction. The qPCR reactions were performed utilizing TaqMan probes in accordance with the manufacturer's protocol (Applied Biosystems, Foster, CA, USA) and were run on a CFX96 Real-Time System with a C1000 Touch Thermal Cycler (BioRad, Hercules, CA, USA) using Bio-Rad CFX Manager 2.1 software. Expression of hypoxanthine guanine phosphoribosyl transferase 1 (HPRT1) transcript with stable level between the groups was quantified to control for variation in cDNA amounts. The cycle threshold values were calculated automatically with default parameters. RNA abundance was calculated as 2 −(threshold cycle) by Bio-Rad CFX Manager 2.1 software.
Microarray Analysis
A starting amount of 200 ng of high-quality total RNA was used to generate cDNA and cRNA with the Illumina TotalPrep RNA Amplification Kit (Illumina, San Diego, CA, USA). The procedure consisted of RT with an oligo(dT) primer bearing a T7 promoter using Array-Script. The obtained cDNA became a template for
Microarray data have been submitted to the Gene Expression Omnibus (GEO, http://www.ncbi.nlm.nih.gov/geo/) under accession number GSE36791.
Bioinformatic Analysis of Gene Expression Patterns
The functional annotation for each gene was based on the Gene Ontology Consortium and Kyoto Encyclopedia of Genes and Genomes (KEGG) pathways. Information was retrieved using WebGestalt (WEB-based GEne Set AnaLysis Toolkit, http://bioinfo.vanderbilt.edu/webgestalt/) with default software parameters.
Identification of Cell Type-Specific Gene Expression
Blood cell type-specific transcriptional markers were identified using the microarray data set from the GEO database (GSE28491) containing gene expression profiles of human blood cells. 11 T-tests were performed on transcript abundance values between each cell type and all other cell types combined. Calculated t-test values were used to create lists of cell-type enriched transcripts. Mapping between Illumina HumanHT-12 and Affymetrix U133 2.0 gene annotations was performed automatically using DAVID gene ID conversion tool. 12 For each blood cell type, the top 20 transcriptional markers that were mapped to the human data set were selected. Mean log2-fold differences between the RA and C groups were calculated for each marker. Significance of enrichment was established based on the theoretical distribution of folds, which was computed using random sampling.
Principal Component Analysis (PCA) and Receiver Operating Characteristic
PCA was performed on qPCR results from Set 1 of samples (training) for the 16 genes selected from microarray analysis. The first and the second PCA components were further used to build the linear discriminant analysis classifier. PCA positions for Set 2 (testing) were predicted on the basis of the results of PCA analysis performed on Set 1. The PCA positions obtained for Set 1 and Set 2 were used to predict posterior probability using the linear discriminant analysis classifier. Receiver operating characteristic curves for lymphocyte-to-monocyte-and-neutrophil (L/MN) gene expression ratio were directly based on ratio values, and for the linear discriminant analysis classifier on posterior probability.
Comparison of Gene Expression Changes in Blood Cells with Other Acute Cerebrovascular Events
To compare the gene expression changes noted in this study with other acute cerebrovascular events, we extracted gene lists from the available literature. We analyzed data on ischemic stroke (transcription determined 5 hours after stroke onset) 13 and on ruptured BAVM. 5 Lists of genes reported as significantly altered in each of the data sets were compared. The statistical significance for the analysis of transcript enrichment was determined using the Spearman correlation and Fisher's exact test.
RESULTS
Set 1 (microarray and qPCR) consisted of 43 RA patients and 18 C. Set 2 (qPCR) consisted of 15 RA patients and 14 C. Their clinical characteristics are summarized in Table 1. Among the Set 1 RA patients, blood was collected on days 0–1 after SAH onset in 21 cases, on days 2-3 in 6 cases, and on day 4 or later in 16 cases. The corresponding numbers of cases for Set 2 collection days are 9, 3, and 3. Fourteen RA patients died during hospitalization.
Clinical characteristics of the patients
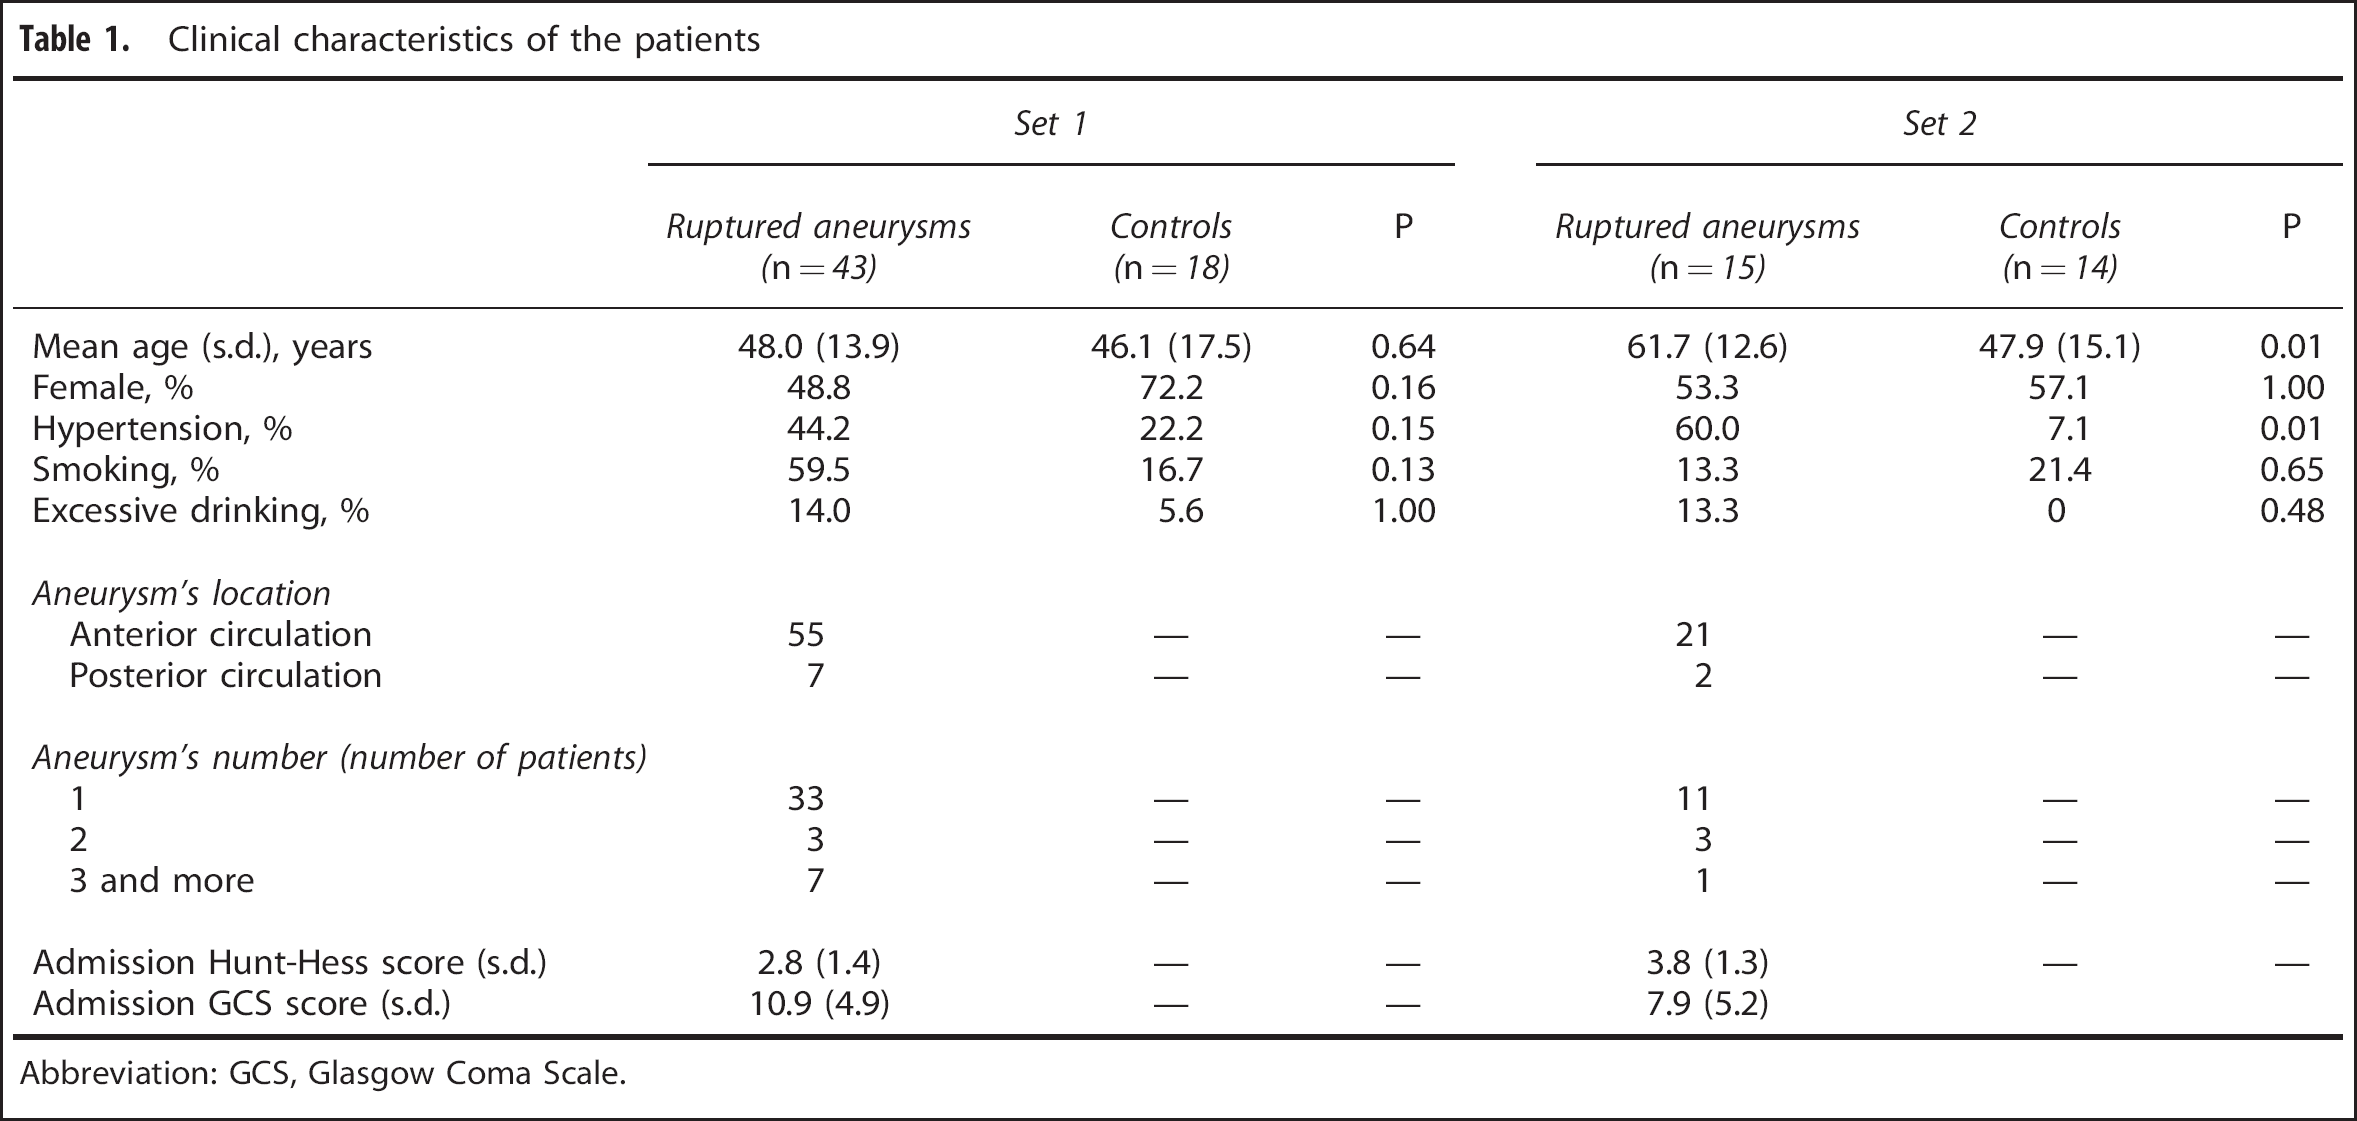
Abbreviation: GCS, Glasgow Coma Scale.
Comparison of profiles among the studied groups (
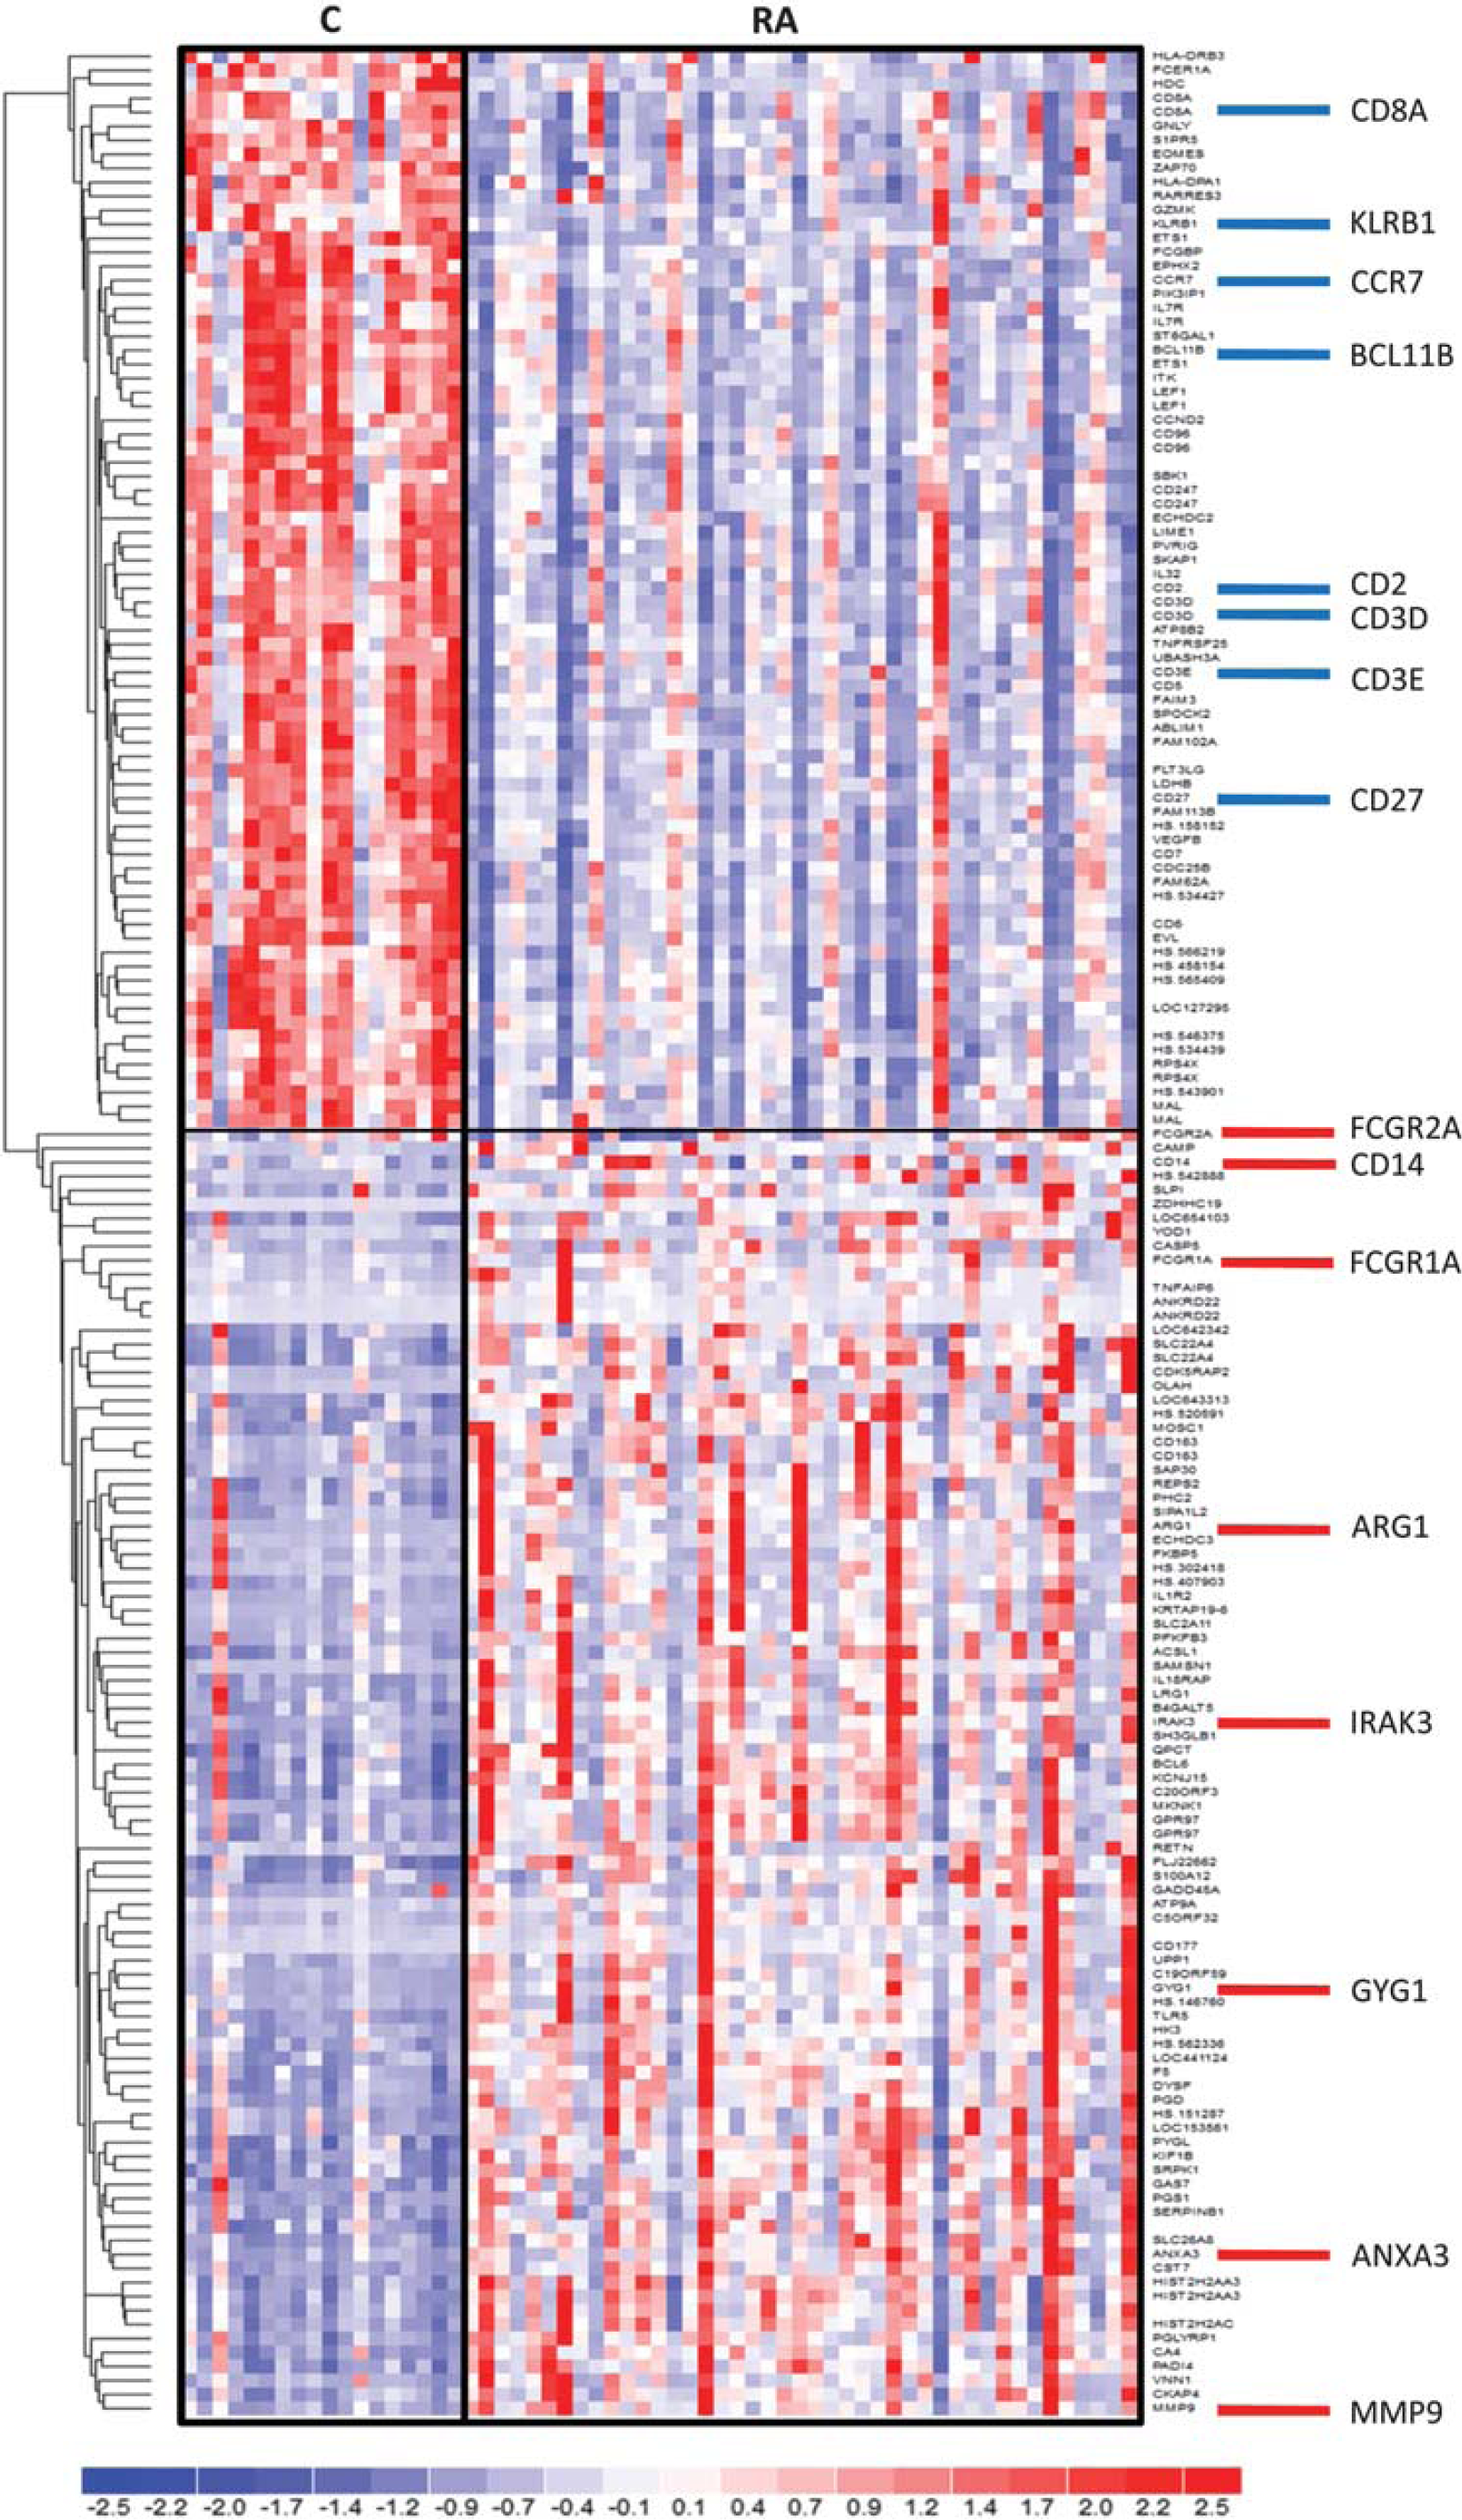
Hierarchical clustering of transcriptional alterations in peripheral blood in response to an aneurysm rupture. Microarray results are shown as a heat map and include genes with genome-wide significance. Colored rectangles represent transcript abundances indicated above the genes labeled on the right. The intensity of the color is proportional to the standardized values (between −2 and 2) from each microarray, as indicated on the bar below the heat map image. Clustering was performed using Euclidean distance according to the scale on the left. Genes selected for qPCR validation are indicated on the right. C, controls; RA, ruptured intracranial aneurysm.
As blood samples from the RA patients were obtained at different timepoints after SAH onset, we investigated the potential effects of the time lapse on gene expression profiles. We did not find any significant relationships between the time after SAH onset and the transcription patterns in the analyzed samples. In particular, a comparison between samples obtained within the first 72 hours after SAH onset and those drawn later did not reveal any prominent differences (Supplementary Figure). This suggests that blood cell-derived molecular markers of SAH are detectable at least for a few days and can be validated in a time-independent manner.
Functional Annotation of Differentially Expressed Transcripts Functional analysis of the differentially expressed genes revealed that the most overrepresented GO biologic processes are those related to immune response, leukocyte activation, and hemopoiesis. Among KEGG pathways, those related to the immune system predominate, too. Detailed lists of overrepresented GO categories and KEGG pathways are presented in Supplementary Table S2.
Expression of Blood Cell-Specific Markers
Next, to get a deeper insight into the response of blood cells to an aneurysm rupture, i.e., to identify which genes related to which cells are up- or downregulated, blood cell type-specific transcriptional markers were identified using an available microarray data set with data on human blood cells. Results of the analysis presented in Figure 2 pointed to an upregulation of transcripts related to monocytes and neutrophils, with a downregulation of T cell-specific transcripts. This might suggest activation and/or an increased count of monocytes and neutrophils, with an accompanying downregulation and/or a decreased count of T lymphocytes.
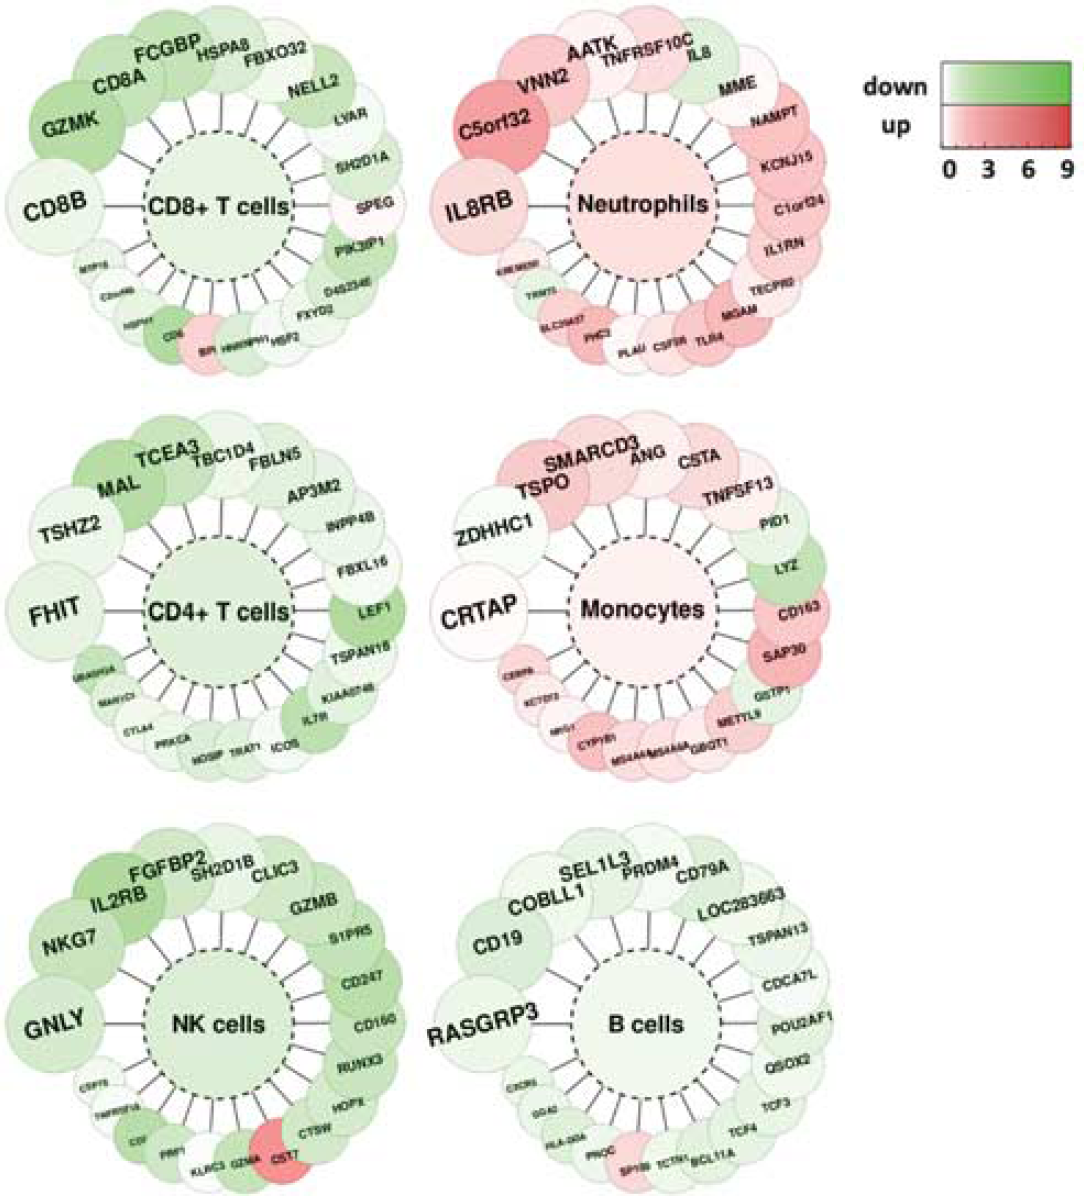
Blood cell type-specific gene expression alterations in response to an aneurysm rupture. We selected the top 20 genes specifically expressed in CD19 + B lymphocytes, CD4 + T lymphocytes, CD8 + T lymphocytes, CD14 + monocytes/macrophages, NK cells and neutrophils. Fold changes of transcriptional alterations to an aneurysm rupture are color coded according to the scale on the right. The color inside the graph indicates mean fold of change for each cell type.
Validation of the Selected Transcriptional Markers
Based on the results of microarray analysis and functional classification, 16 genes were chosen for the validation study. The selected genes include cell membrane proteins that are used in flow cytometry analyses, and their cell specificity has been verified in immunologic studies. The expression levels of these genes were determined separately in both sets of subjects. Analyzed genes and fold changes are listed in Table 2. These results are consistent with microarray analyses. Moreover, the differences between RA patients and C were almost identical in these two independent sets.
List of selected genes and results of qPCR
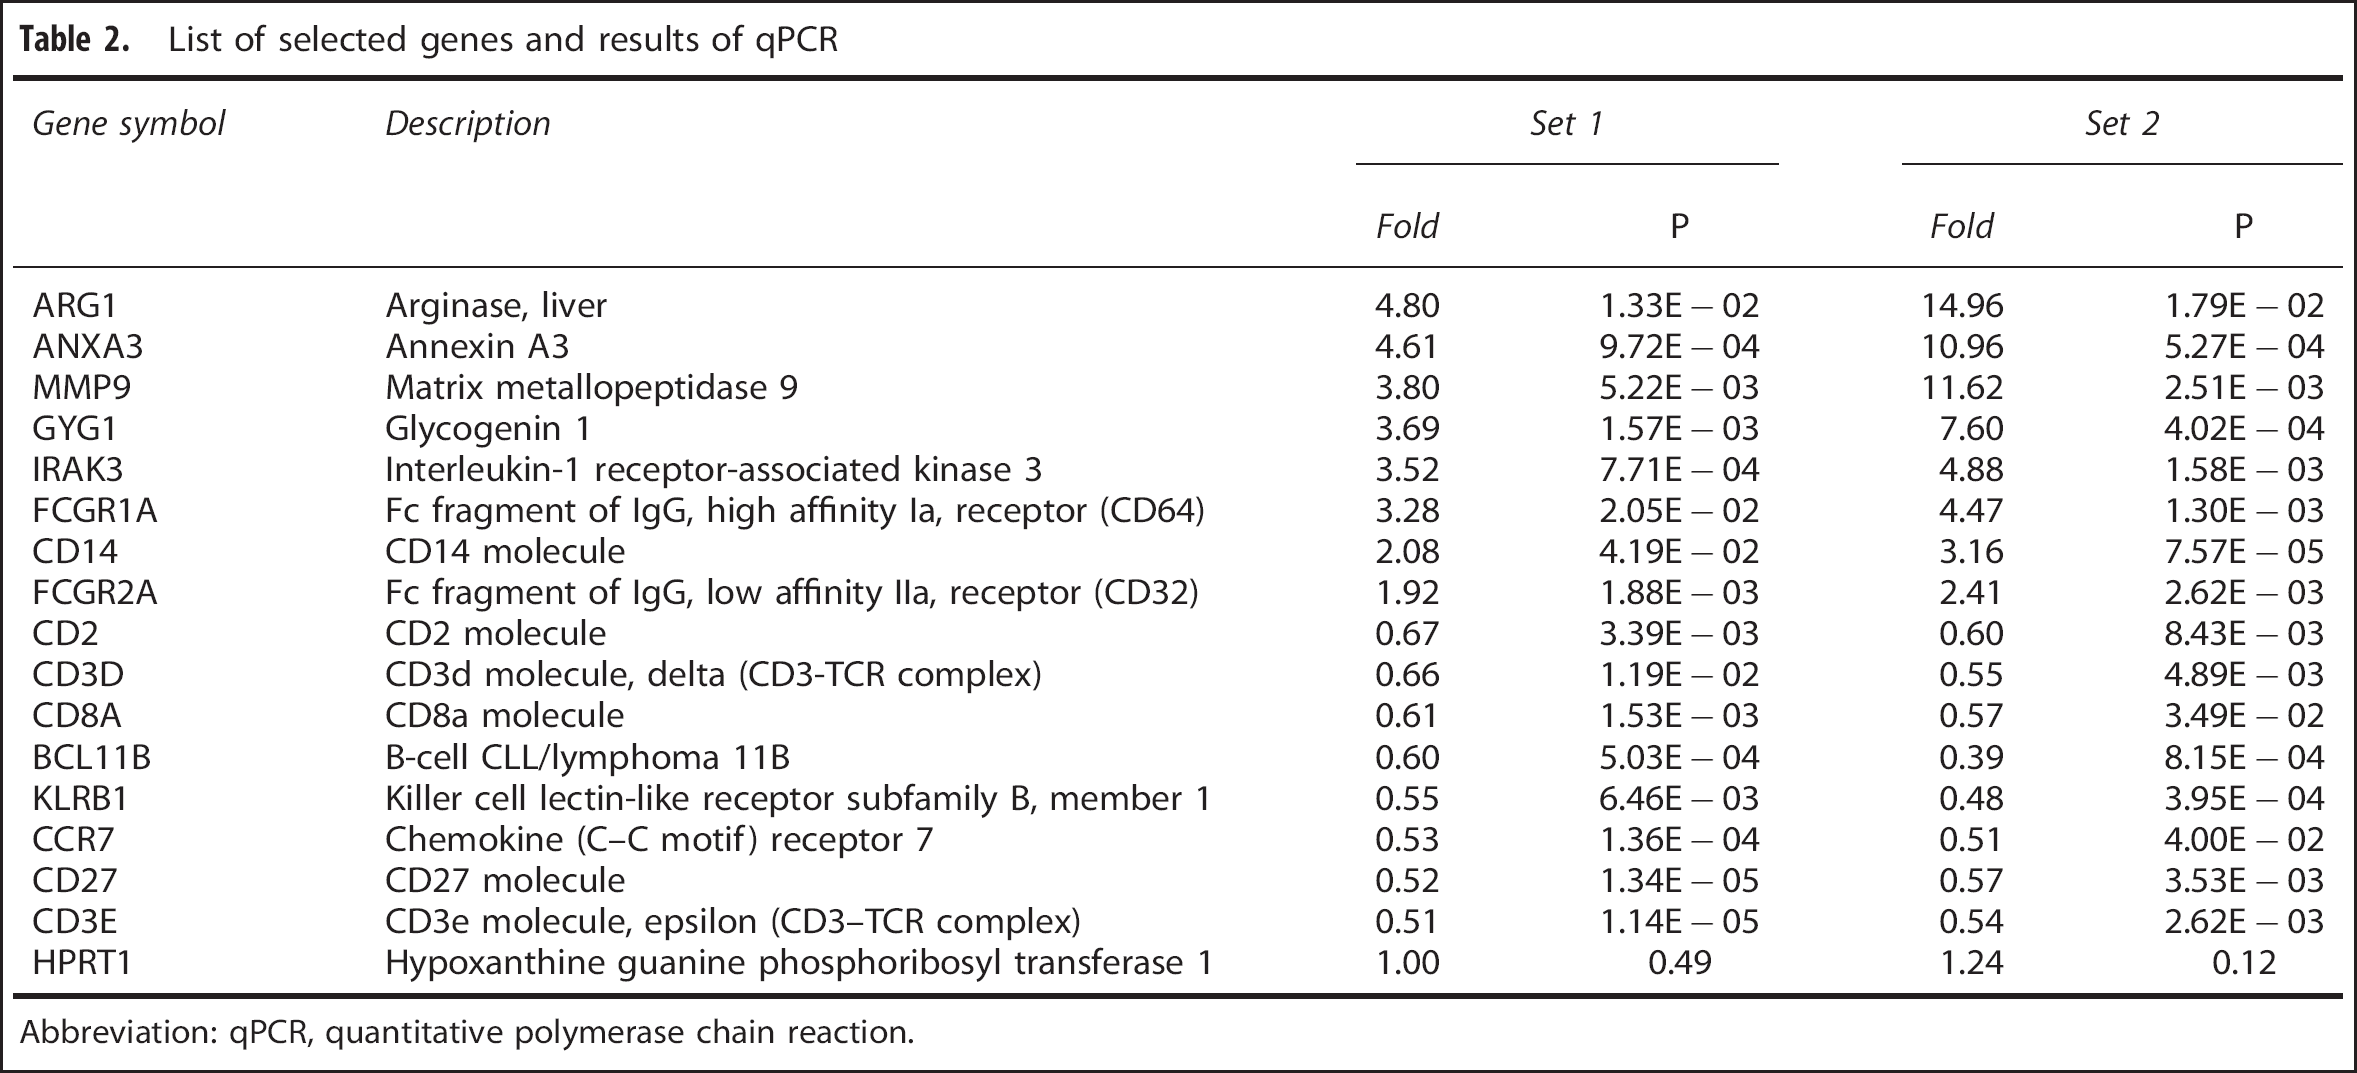
Abbreviation: qPCR, quantitative polymerase chain reaction.
Classification of the Samples and the L/MN Index
Principal component analysis of these 16 genes demonstrated their capacity to segregate RA and C groups with few exceptions (Figure 3). Despite a thorough analysis of clinical data, reasons for the observed overlaps remain unclear. One of the possible explanations is the good neurologic status for overlapping RA patients—they scored 15 points on the Glasgow Coma Scale. However, other RA patients with similar scores segregated from C.
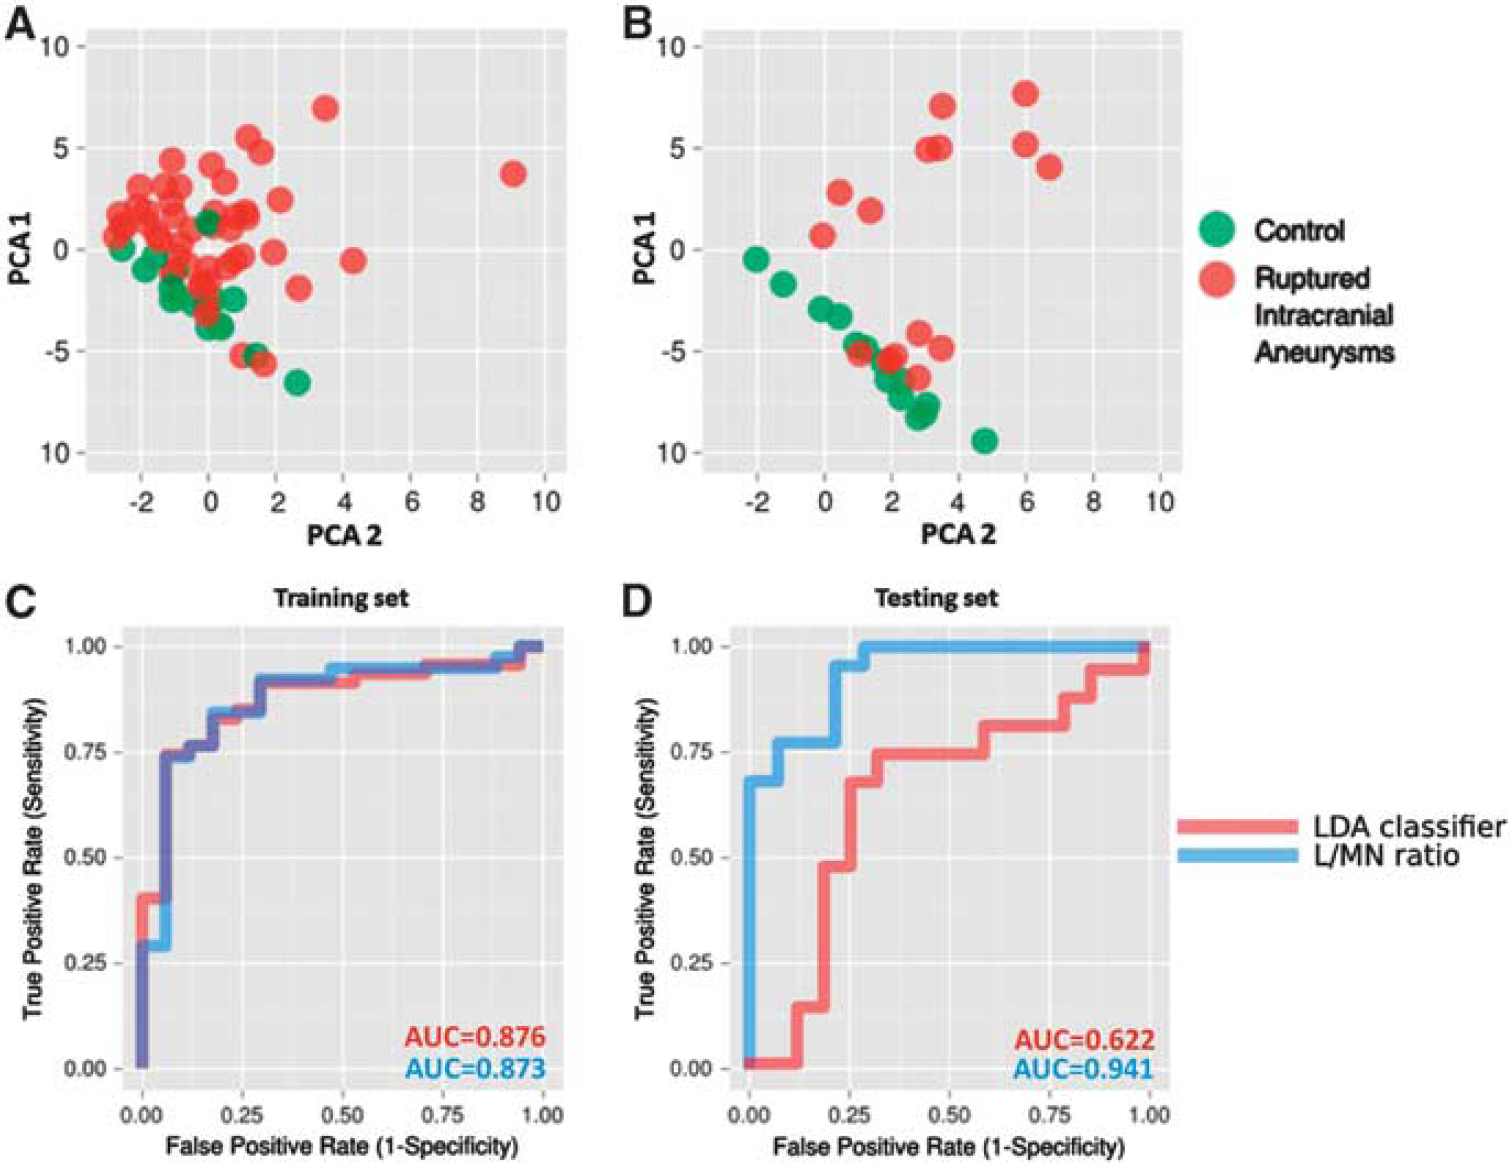
Classification of the samples based on alterations in expression of the selected set of genes. (
To establish an easy method to evaluate prognosis in RA patients, we introduced a lymphocyte-to-monocyte-and-neutrophil index (L/MN index). Based on qPCR analyses, the L/MN index was calculated as the ratio of the mean folds of standardized expression levels of lymphocyte-related genes
Comparison of Gene Expression Changes in Blood Cells with Other Acute Cerebrovascular Events
Inclusion criteria for comparisons were met by 706 genes from an ischemic stroke study
12
and 1,936 genes from a BAVM study.
5
There were 71 genes common for the RA and ischemic stroke patients (significant enrichment,
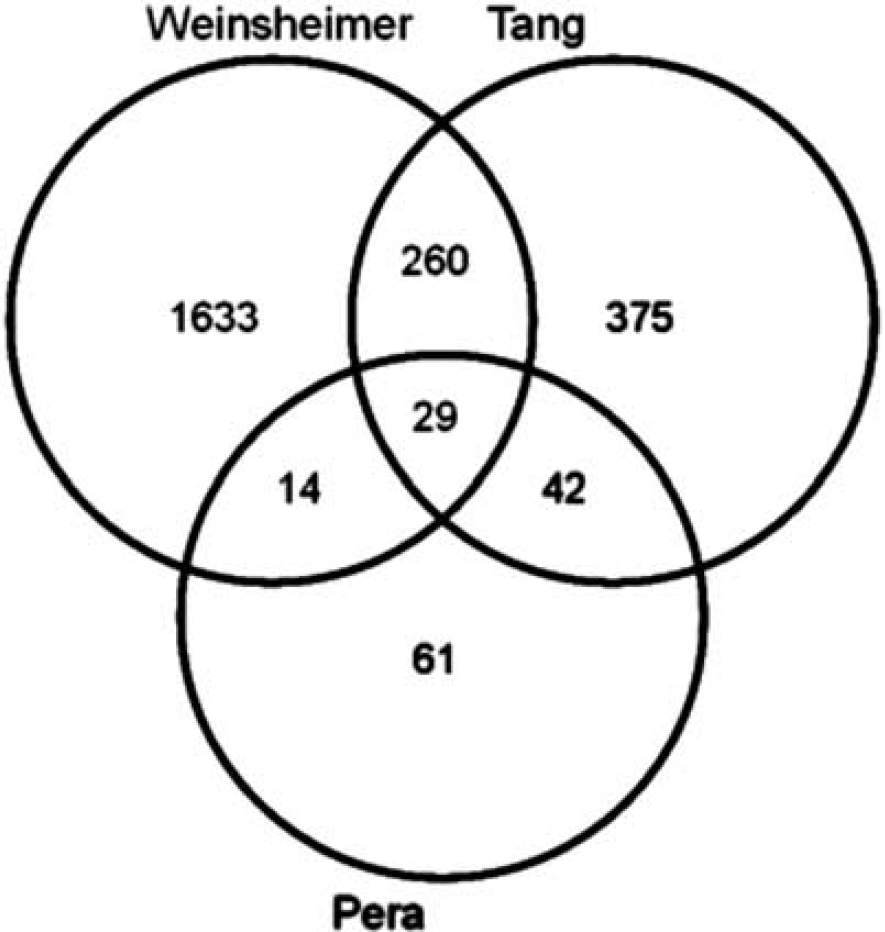
Venn diagram comparing three lists of genes differentially expressed in the blood cells of patients with acute cerebrovascular events (see text for details).
DISCUSSION
This study demonstrated that rupture of an intracranial aneurysm strongly affects gene expression profiles in peripheral blood cells.
The most striking finding was an abundance of transcripts related to monocytes and neutrophils with a simultaneous decrease of transcripts related to T lymphocytes. Whether this reflects a change in blood cell counts or in cell activation levels or both remains unresolved. Immunodepression subsequent to ischemic stroke and brain injury is a recognized phenomenon.14,15 Data on systemic immune responses to SAH are scant. Sarrafzadeh
The L/MN index proposed in this study integrates information regarding the expression levels of genes specific to three leukocyte subpopulations (i.e., lymphocytes, monocytes, and neutrophils) into a single value. These cells are important players in immunodepression related to stroke. The significance of the L/MN index resembles the neutrophil-to-lymphocyte ratio (NLR) used in acute coronary syndromes as a prognostic marker: a higher NLR is associated with worse prognosis.19,20 In this study, a significantly lower L/MN characterized RA subjects compared with C;among SAH victims, the lowest L/MN values were found in patients who died.
When comparing transcriptomics data from acute ischemic stroke 13 and ruptured BAVM, 5 we identified some similarities between all three conditions, despite differences in the ethnicities of the examined populations (i.e., mixed white and non-white in American studies vs. homogeneous Polish), in the time lapse between the onset of cerebral events, and blood sampling, and in the platform used (Affymetrix vs. Illumina). This suggests that an acute vascular brain injury influences gene expression in peripheral blood cells, and to a certain extent the observed changes are similar. The common genes were related to cell signaling and programmed cell death. Thus, one can speculate that apoptosis of leukocyte subpopulations is one of the mechanisms responsible for cerebral injury-induced immunodepression. It is known that activation of the sympathetic nervous system (i.e., release of catecholamines) and of the hypothalamic-pituitary-adrenal axis (i.e., release of glucocorticosteroids) can induce apoptosis of T lymphocytes. 14 Stimulation of both systems by SAH is well-documented.21,22
Compared with studies on gene expression in intracranial aneurysms, the common denominator of changes found in blood and aneurysmal tissue is an altered expression of genes related to immune/inflammatory response. However, only few genes from this group are common for blood and tissue analyses.
23
Inflammatory/immune reaction is a well-known phenomenon in the pathophysiology of RAs, which seems to be involved both in the rupture of aneurysmal wall and in response to bleeding. Changes in transcription profiles found in blood cells in the present study reflect rather a systemic response to the acute phase of bleeding from Ras. This can explain why we noted a
Our study has several potential limitations. One is its relatively small sample size. Our results should be confirmed in larger cohorts. Next, the blood samples were drawn at different times after SAH onset. However, we were able to identify genes in which differential expression was time-independent. This suggests that these genes could serve as biomarkers for the acute phase of SAH from RAs. Another drawback is the lack of data concerning the activities and counts of blood cell subpopulations (i.e., monocytes, neutrophils, and lymphocytes). This deficiency impedes a more detailed assessment of the roles played by these cells in the systemic response to aneurysm rupture. Moreover, from a design standpoint, we cannot assert that the observed changes in genes transcription are specific for RAs. Comparisons with other acute conditions (with or without bleedings) or unruptured aneurysms would allow to determine the specificity of our findings.
In summary, the results of this study indicate that rupture of intracranial aneurysms strongly influences the transcriptional profiles of peripheral blood cells. A specific pattern of observed expression changes suggests a depression in lymphocyte response with enhancements in monocyte and neutrophil activities. This is probably related to the immunodepression reported in SAH patients. The expression profiles of a set of 16 transcriptional markers and L/MN index values distinguished subjects from the RA and control groups. Moreover, significantly lower L/MN values were noted in patients with poor outcomes. These observations provide novel molecular biomarkers, which could be clinically useful for the management of SAH patients.
DISCLOSURE/CONFLICT OF INTEREST
The authors declare no conflict of interest.
Footnotes
References
Supplementary Material
Please find the following supplemental material available below.
For Open Access articles published under a Creative Commons License, all supplemental material carries the same license as the article it is associated with.
For non-Open Access articles published, all supplemental material carries a non-exclusive license, and permission requests for re-use of supplemental material or any part of supplemental material shall be sent directly to the copyright owner as specified in the copyright notice associated with the article.