
Abstract
Silver colloid based nanostructures are a very common means of achieving strong SERS signals. This is due to the hot spots that are formed in between the nanoparticles, as well as their ease of synthesis. They are frequently dismissed, however, as irreproducible when compared to other metal nanostructures, due to the random nature of their formation in a solution. Silver nanoparticle substrates or carefully constructed arrays can be made to be uniform, but they often require a large amount of time to produce, as well as expensive equipment. We will show that by making some adjustments to the experimental setup, silver colloids that have been aggregated to form large flakes can offer both the enhancement factor and reproducibility of many other more expensive and complicated SERS techniques.
Silver colloids aggregated into large flake-like structures have been investigated for their surface-enhanced Raman spectroscopy (SERS) properties. These flakes have been imaged using scanning electron microscopy (SEM) and have also been characterized using UV/Vis spectroscopy. They have been highlighted as a cheap and simple means or achieving large Raman enhancement with strong reproducibility, especially when compared to many common methods of substrate fabrication that are more difficult to fabricate. Detection of Rhodamine 6G at a concentration of 5×10⁻¹³M has been achieved, as well as xanthopterin at a concentration of 5×10⁻⁹M.
1. Introduction
Surface-enhanced Raman Spectroscopy (SERS) is a versatile analysis technique based on the enhancement of Raman scattered light due to the electric field generated by metal nanostructures. Signals obtained from SERS are many orders of magnitude stronger than those in conventional Raman spectroscopy and this technique has even been used for single molecule analysis [1, 2].
Aggregated silver colloids have in particular proved to be popular substrates for SERS, due to their facile preparation procedures and ability to be used immediately after synthesis, but they have traditionally struggled with measuring irreproducibility [3, 4]. These inconsistencies can occur for a variety of reasons, such as variations in the size or separation of the nanoparticles [5] or in the type of aggregating agent used [6]. Silver colloids produced by silver nitrate reduction can have large variation in terms of particle size. It is possible to control particle size somewhat with certain synthesis processes, but there is typically still a far greater range in sizes when compared to what is possible with gold colloids [7-10]. Prediction of the behaviour of nanoparticles has been attempted based on the size and morphology of the aggregates [11]. This study found that there are certain size thresholds that significantly alter the effectiveness of aggregates as SERS substrates. Using the methods outlined below, it will be shown that by surpassing any relevant thresholds that might lead to inconsistencies, aggregates can have acceptable levels of reproducibility.
Previous papers have analysed gold nanoparticle aggregates with monodispersed particle sizes, as well as single aggregates of silver nanoparticles. There has been very little study, however, of the behaviour of silver nanoparticle aggregate assemblies that have been produced chaotically due to their large variation in particle size and unpredictable reproducibility. We will show that by making some simple adjustments to the experimental method, these easily produced aggregates can provide relative standard deviations of less than 15%. This is well within the commonly accepted ranges for SERS techniques considered to have “strong reproducibility”.
An important factor in the preparation of colloids for SERS analysis is the aggregation step [12, 13]. SERS signals from aggregated colloids are larger than for those of individual colloids due to ‘hot-spots’ that are located in the junctions between the colloids [14]. This is usually accomplished through the addition of a salt, such as NaCl or MgSO4. While NaCl has been used more extensively, MgSO4 binds more weakly to the nanoparticles, which means that it does not compete with the analyte molecules for adsorption sites [15].
Xanthopterin belongs to a family of biological compounds known as pterins, the first species of which was discovered as a pigment in the wings of the Brimstone butterfly in 1889 [16]. They have since been identified in other creatures, as well as in many metabolic processes within the body and the concentrations present in certain species have been linked to cancer diagnosis [17]. SERS is an attractive medium for the detection and analysis of these compounds due to its high selectivity and sensitivity [18, 19].
2. Experimental
The silver colloids were prepared according to the method detailed by Leopold and Lendl [20]. Hydroxylamine hydrochloride was mixed with sodium hydroxide before silver nitrate was added, which are reduced to form silver nanoparticles. This process occurs rapidly and can be conducted at room temperature, giving it advantages over other common nanoparticle synthesis processes [21]. The resulting colloids have also been shown to have better stability than other popular synthesis methods, as well as having no Raman spectrum of its own [22].
Two different salts were used as aggregating agents: magnesium sulphate and sodium chloride. Both salts cause the silver nanoparticles to cluster together over time and form large flakes. Magnesium sulphate has been reported to contest weakly for adsorption sites on the nanoparticles, which should allow for more target molecules to adsorb onto areas with large field enhancement [15]. Sodium chloride, on the other hand, should cause more aggregation due to the strong charge once the molecule dissociates to form ions. In all experiments, the salts used were at a concentration of 0.1M. For all aggregate measurements, a 0.7mL colloid solution was added to a 0.7mL analyte solution, before a 0.2mL salt solution was added to trigger aggregation. The collection of the aggregates is a simple matter, as the large flakes fall out of suspension and gather at the bottom of the container. A pipette was used to extract samples for SERS measurements.
It is important that in making aggregates for SERS measurements, the analyte is added to the silver colloids prior to the salts. This allows the analyte molecules to adsorb onto the silver nanoparticles, creating the much greater likelihood that when the particles aggregate, the analyte molecules will be situated in hot spots between two particles.
After the salt solutions were added to the colloid-analyte mixtures, the samples used for the measurements in this paper were left for at least five hours, by which time the colloids reached a fully aggregated state where no more changes occurred. In other works, optical measurements were made minutes after aggregation had been triggered. This would have led to many inconsistencies, as the solution would still be undergoing significant changes while measurements were being taken.
For all the Raman measurements, a Horiba LabRam HR was used with a 10x objective lens and a 633nm laser. The SEM used was a Zeiss Ultra Plus. A Cary 50 UV-vis spectrophotometer was used for all absorption measurements.
When taking measurements, a 6μL droplet was taken from a flake sample and deposited onto a glass microslide. An individual flake was then focused upon, using a white light source before being excited with a laser. A 10x objective lens was used to take all Raman measurements. The laser spot size for this objective was 20μm.
3. Results and Discussion
Figures 1a, 1b and 1c show the effect salt has on silver colloid solutions. Prior to aggregation, the nanoparticles are isolated; the clusters seen in Figure 1a are formed when the solution is allowed to dry. After the salt has been added, the nanoparticles form large flakes in a variety of shapes and sizes and made up of thousands of particles, some of which are big enough that they can be viewed with the naked eye. There was no discernible difference between aggregates formed by MgSO4 or NaCl.
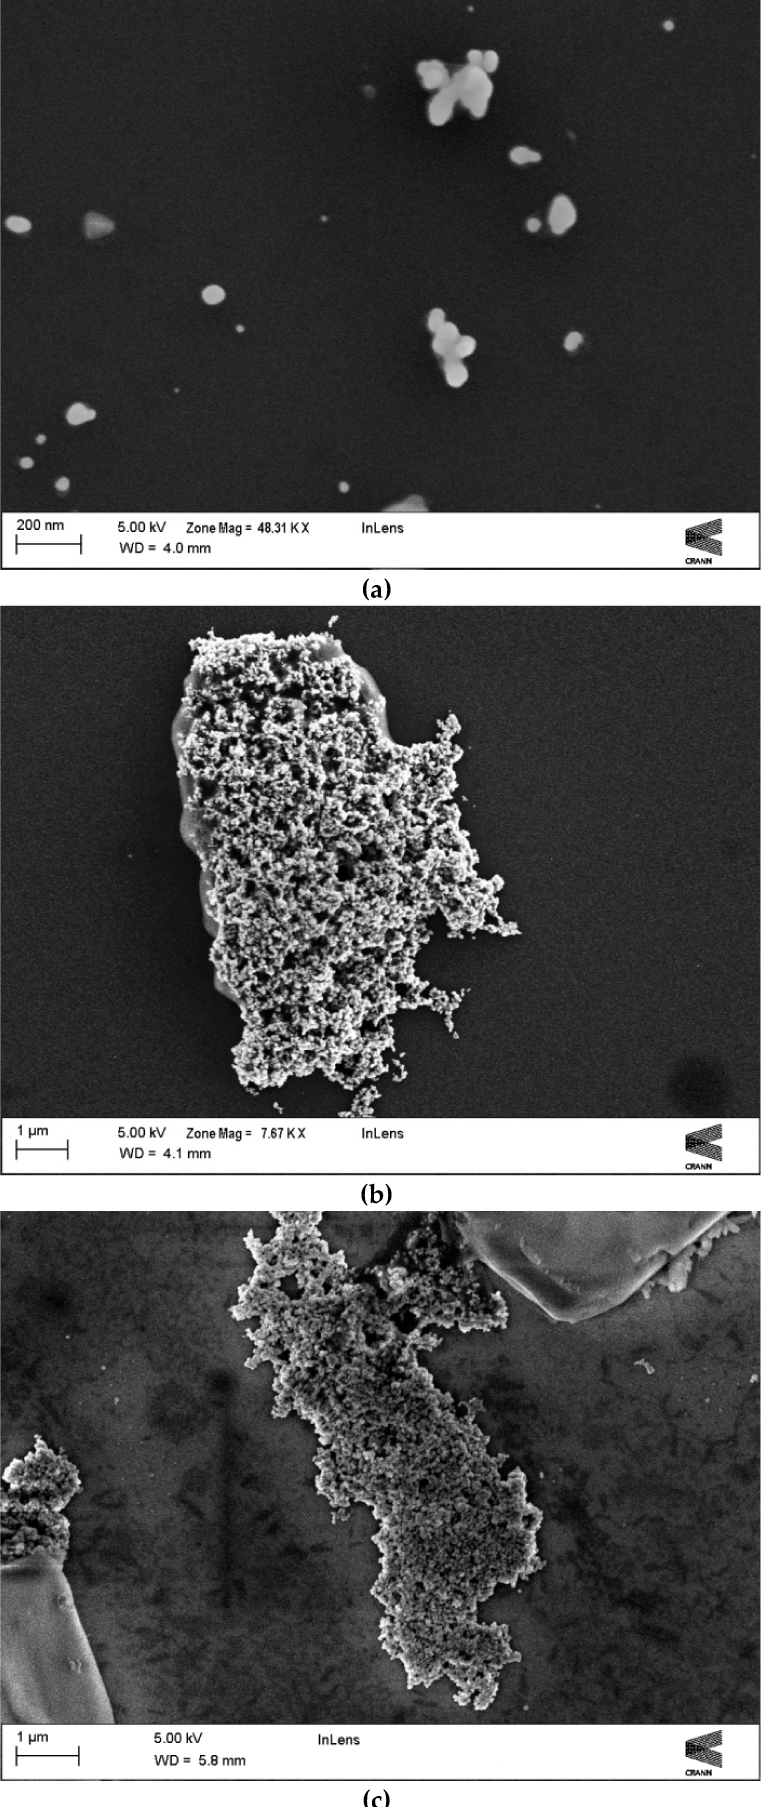
SEM image of silver colloids prior to aggregation. SEM image of silver colloids after aggregation using MgSO4 SEM image of silver colloids after aggregation using NaCl.
3.1 UV/Vis Characterization
Figure 2 shows the UV-vis spectra of the silver nanoparticles and the silver nanoparticles mixed with two different types of salt solutions. The spectra were taken immediately after the salts were added to the nanoparticles, but it can clearly be seen that they had already effected a significant effect on the spectra. In the case of MgSO4, the peak was reduced by over a factor of 2, which was due to the nanoparticles aggregating and falling out of suspension. The other important aspect to notice is the broadening of the peak, suggesting that the aggregated nanoparticles will interact more heavily with light of a longer wavelength than non-aggregated nanoparticles would.
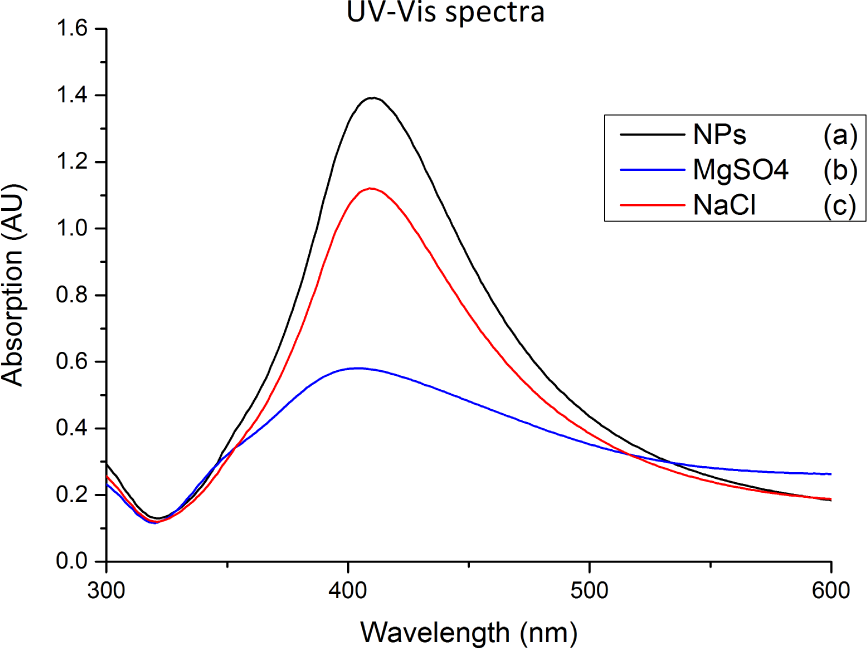
UV-vis spectra of: (a) silver nanoparticles; (b) silver nanoparticles mixed with MgSO4; (c) silver nanoparticles mixed with NaCl. For (b) and (c) the spectra were taken immediately after the salts were added to the silver nanoparticles.
In Figure 3, the effect of MgSO4 on silver nanoparticles over time is shown. The intensity of the absorption peak gradually decreased as a function of time down to 0.08AU, which was only 2% of the intensity of the unaltered nanoparticles. This implies that after only five hours, the MgSO4 caused approximately 98% of the silver in the solution to aggregate and form large particles that fell out of suspension to the bottom of the container. From there, the aggregates were easily collected for use in SERS measurements. By allowing time for all of the silver to fall out of suspension before taking Raman measurements, the variations caused by colloids still aggregating can be avoided. This enables SERS measurements to be far more consistent and reproducible.

UV-vis spectra of silver nanoparticles mixed with MgSO4; spectra were taken every hour after the salt and colloids were mixed together
Figure 4 shows the same progression using NaCl instead of MgSO4 In this case, however, the process of nanoparticles falling out of suspension happens much slower. This implies that more time is needed before gathering the aggregates for SERS measurements, or that more care must be taken when collecting them, as fewer will have formed.

UV-vis spectra of silver nanoparticles mixed with NaCl; spectra were taken every hour after the salt and colloids were mixed together
3.2 Flake Reproducibility
In the majority of the literature, Raman measurements are made using a very high magnification lens; this is done in order to maximize the signal intensity. Having used a 100x objective lens, a higher signal was found when compared to a 10x lens; the difference in peak height was approximately 2.3 times larger using the 100x lens. The 100x lens also presented far less predictable results and with large fluctuations in intensity from sample to sample. By using a 10x lens with a 20 μm laser spot, an averaging effect takes place due to the large array of particles being irradiated at once. This is not the case with high magnification setups and we view this as a contributing factor in the poor reproducibility that randomly aggregated particles often show. The laser spot is still much smaller than the majority of flakes being used for measurements, which negates the effect of flake size or shape.
The data in Table 1 show the average Raman spectral intensity and standard deviation of 14 different samples of R6G on MgSO4 flakes. All of the samples were prepared in the same way. The figures for intensity were calculated by integrating over the entire spectra and averaging across five measurements taken from each sample. The overall relative standard deviation of 70 SERS measurements taken from 14 different flakes was 14.9%. This is very low, especially considering the strong enhancement factor provided by the flakes. This figure of 14.9% is only 5% higher than the unaltered nanoparticle colloids; however, these unaltered colloids give a significantly weaker signal strength – the peak intensities are approximately 18%, as high as those taken using flake samples, as can be seen in Figure 5. Figures of 9% [14] for standard deviation of SERS spectra have been quoted elsewhere, where commercial nanoparticles were used as a substrate. However, SERS substrates offering relative standard deviations of up to 25% have been considered good in terms of reproducibility [23, 24].
Relative standard deviation of SERS spectra that have been integrated to measure the overall intensity for 14 different samples of R6G on MgSO4 flakes

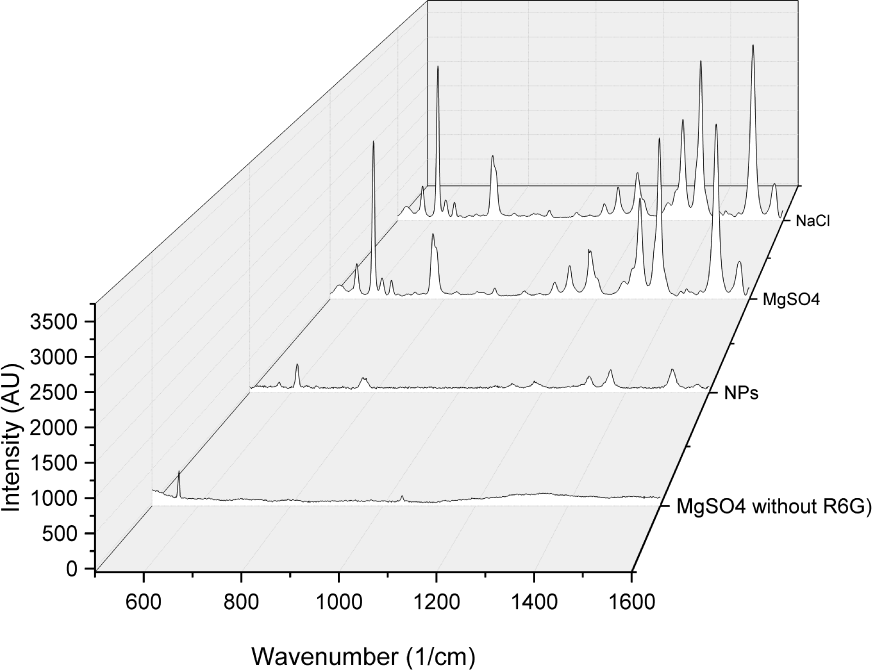
SERS spectra using 10−6M Rhodamine 6G mixed with MgSO4, NaCl, unaltered silver colloids, as well as aggregated flakes without any R6G, measured using a 633nm laser
It is also important to note that there are no peaks in the spectra that have been contributed by the flakes themselves. In Figure 5, the spectrum from a flake sample containing no R6G can be seen. The small peaks at approximately 550cm−1 and 1050cm−1 are not found in spectra containing R6G. We can attribute their presence to background radiation entering the spectrometer. In the case of R6G, there was minimal difference in the SERS signal between the NaCl aggregated flakes and the MgSO4 flakes.
Within the individual samples, the signal intensity deviation was very low; apart from a few outliers, the majority of samples had a relative standard deviation of well under 5%. This is a very promising result, given the ease of synthesis when compared to many SERS substrates, which often require specialist equipment and specific temperatures or pressure conditions to produce.
3.3 Detection Limits
Figure 6 shows SERS spectra taken with a 633nm laser and using MgSO4 flakes as an enhancer. Despite NaCl aggregated flakes providing very similar strength signals for higher concentrations of analytes, MgSO4 aggregated flakes offered better spectra for low concentrations. A minimum detection of 5×10⁻⁹M for xanthopterin was reached, which matched the lowest detection found within the literature [25]. When compared to the 5×10⁻⁶M sample, the peaks were clearly much weaker. However, the 1330cm−1 and 1380cm−1 peaks were still clearly visible. Less visible but still distinct were the peaks at 1210cm−1 and 1480cm−1. When taking these spectra, an exposure time of five seconds was used and three accumulations were taken. The same method was used in order to measure the lowest possible detectable concentration of R6G, the results of which can be seen in Figure 7. It was possible to observe several distinct R6G peaks in a solution who's concentration was 5×10⁻¹³M. Though single molecule SERS detection was achieved for R6G in this paper, no plasmon resonance tuning was required, which rendered these flakes a very useful means for achieving sub-nanomolar R6G detection without significant time or money costs. For the lower concentrations, however, it was necessary to use longer excitation times and a greater number of accumulations to record significant peaks. Additionally, a 532nm laser was used to measure the Rhodamine samples, as it offered better peak clarity than the 633mn laser.

SERS spectra of xanthopterin on MgSO4 aggregated silver flakes; the concentration of xanthopterin ranges from 5×10⁻⁶M to 5×10⁻⁹M measured using a 633nm laser

SERS spectra of R6G on MgSO4 aggregated silver flakes; the concentration of R6G ranged from 5×10⁻⁹M to 5×10⁻¹³M, measured using a 532nm laser
Due to the weak signal offered by the lowest concentrations, exposure times of 30 seconds were used with three accumulations taken per spectra. For all listed concentrations there was an associated error of ± 2%.
4. Conclusions
It has been shown that the addition of salt solutions to silver nanoparticle colloids causes the particles to aggregate and form large flakes that contain an abundance of SERS hot spots. This process occurs over the course of approximately five hours, while the silver falls out of solution. These flakes provide significantly more Raman enhancement than standard colloid solutions but more importantly, offer good reproducibility data without the need for costly equipment or the large time commitments required for substrate fabrication. The detection limit reached for xanthopterin was very low at 5×10⁻⁹M, which matches the lowest recorded value found within the literature. The minimum detection found for R6G was 5×10⁻¹³M, which is naturally lower than what has been observed for xanthopterin, given the large Raman cross-section of R6G compared to xanthopterin.