
Abstract
Pollen identification and quantification are employed in various applications, and studies have been conducted to achieve precise automated pollen recognition to minimize the manual labor and subjectivity associated with human identification. The objective of the study was to evaluate the potential of surface-enhanced Raman spectroscopy (SERS) properties of pollen grain spectra, specifically within the spectral range of 582–1563 cm–1, using the convective assembly combined principal component–canonical discriminant analysis (PC-CDA) classification model. This research aimed to explore the feasibility of using this approach for the automated identification of pollen in the future. This approach facilitates the optimal arrangement of pollen grains and colloidal silver nanoprobes, thereby enhancing SERS spectra reproducibility using the convective assembly sampling method. Pollen grains can be characterized at a microscopic level without the need for purification-based analysis procedures. The findings demonstrate the possibility of rapid and accurate classification of pollen grains with the PC-CDA detection model with a 99.3% sensitivity, 97.6% specificity, and 98.5% accuracy. Research study indicates that the SERS properties of pollen spectra could serve as a promising method for automated pollen identification using the PC–CDA classification model.
This is a visual representation of the abstract.
Keywords
Introduction
Pollen is an organic substance containing pollen grains, which are male microgametophytes of plants. Pollens have a crucial function in the fertilization process for the plant world. The rigidity of the pollen grain is related to the outer layer called exine, which is composed of a stable biopolymer known as sporopollenin. 1 The external part of the pollen grain also contains lipid, carotenoid, and flavonoid contents. 2 The internal part of the pollen grain has characteristic cellular components such as nucleic acids, lipids, carbohydrates, and proteins. Rapid and accurate pollen identification is essential to several scientific disciplines, such as allergology, climate research, and paleobiology. 3 In addition, a comprehensive understanding of the chemical composition of pollen is of great significance in the field of plant-related phenotyping, which holds immense importance in several disciplines such as agriculture, plant physiology, and ecology. This knowledge becomes particularly relevant when examining the adaptability of plants to modified environmental conditions. 4 The conventional method for pollen analysis involves the use of light or electron microscopy to examine the morphology of pollen grains. Usually, it is not feasible to achieve species-level identification, and certain forms of pollen can only be identified at a broader taxonomic level. 5 The investigation of pollen holds significance not only for plant evolution but also for clinical research, particularly in relation to allergenic pollen species. Respiratory disorders are frequently attributed to pollen, as scientific evidence has demonstrated that over 150 pollen proteins are responsible for inducing allergic sensitization. 5 The majority of plants that elicit allergic reactions are wind-pollinated species, which necessitate the release of substantial quantities of pollen into the atmosphere to achieve effective reproduction. This phenomenon results in the exposure of individuals to pollen allergens for an extended duration, spanning many months within a given year. Consequently, this prolonged exposure heightens the likelihood of individuals developing sensitivity to one or more species of pollen. 6
The pollen grain identification methods based on morphological information involve a time-consuming collection process to obtain pollen grains at the detection limit and laboratory analysis by highly skilled operators. 4 There are studies in the literature to improve the pollen grain detection methods using scanning electron microscopy (SEM),5,7 fluorescence microscopy, 8 and optical microscopy. 9 Fourier transform infrared spectroscopy (FT-IR) 10 and Raman spectroscopy11–13 were also studied as alternative non-destructive approaches to improve the recognition accuracy and reduce the time and cost. However, the weak Raman signal and the time-consuming steps to obtain high-dimensional data are the limitations of using Raman and FT-IR as pollen detection approaches. Noble metal nanoparticles as surface-enhanced Raman spectroscopy (SERS) substrates were studied to obtain high signal enhancement and to improve the high fluorescence background coming from pollen species.14,15 SERS has reduced the detection limit for pollen grains, but spectral reproducibility remains a challenge. For these reasons, there is a need for an approach that has higher reproducibility, sensitivity, and specificity, as well as a lower detection limit. In several SERS-based research studies, the substance of interest is examined by drop-casting (DC) the mixture of analyte and SERS-active substrate suspension onto a glass or calcium flouride (CaF2) slide.16–22 Colloidal nanoparticle clusters tend to accumulate more at the edges due to the “coffee-ring effect” that occurs during evaporation. Producing consistent and reproducible particle deposition is extremely challenging with the DC sampling method. However, our recent studies used the convective assembly (CA) technique to overcome spot-to-spot variations and generate reproducible and higher-quality SERS spectra.23,24 The CA technique is processed by a balanced volumetric flux of solvent evaporation and particle assembly, and it was improved for a controlled assembly of micro- and nanoparticle coatings.25,26
The study utilized a CA-based SERS identification approach to prevent the overlapping arrangement of nanoparticles and pollen grains, resulting in highly reproducible spectra. Principal component analysis (PCA) is a commonly used technique to simplify high-dimensional SERS data. The PCA method was utilized as a widely deployed linear methodology for reducing dimensionality. Recent research has indicated that utilizing PCA in conjunction with canonical discriminant analysis (CDA) as a multivariate discrimination algorithm holds significant promise for accurately classifying high-dimensional sets of spectra. These algorithms demonstrate high sensitivity, specificity, and accuracy.27,28 PCA is a potent method for investigating the fundamental structure of SERS data, as it has the ability to condense extensive data sets with multiple variables into simplified representations and extract significant insights from these representations. 29 This study examines the new method of using the CA-based SERS technology with a principal component–CDA (PC-CDA) classification model to identify pollen grains in different plant species.
Experimental
Materials and Methods
All chemicals, silver nitrate (AgNO3), and trisodium citrate were purchased from Merck and used as received. Aqueous solutions were prepared using double distilled, deionized water from the Millipore DirectQ ultraviolet (UV) system.
Preparation of Silver Nanoparticle (AgNP) Colloidal Suspension
Lee and Meisel's trisodium citrate reduction technique was used to synthesize colloidal AgNPs. The final concentration of synthesized colloidal AgNP suspension was calculated at 5.2 × 10¹⁰ particles∕mL. The colloidal AgNP suspension was centrifuged for 30 min at 5500 rpm to increase the concentration of colloids in the suspension. Then, 1.5 mL of the liquid portion of the colloidal AgNP suspension in a 2 mL Eppendorf tube was extracted to get a fourfold concentrated suspension. The 0.2 mL of colloidal AgNP suspension (2.08 × 10¹¹ particles∕mL) was mixed with the pollen grains. 30
Sample Preparation
Pollen samples were gathered from several plant species throughout their flowering season in Türkiye. The identification of these samples was determined by comparing them to specimens described in Flora of Türkiye and the East Aegean. 31 A total of 0.5 mg of each variety of pollen grain was combined with 0.5 mL of 70% ethanol and subjected to sonication for 15 min to eliminate any potential bacterial contamination present on the pollen grains. Subsequently, the pollen grains were isolated from any impurities by low-speed centrifugation at around 2000 rpm. The liquid portion of the suspension was discarded. Following three rounds of ethanol washing, a volume of 0.5 mL of deionized water was introduced into the tube, and the suspension was subjected to low-speed centrifugation. After three washes, the liquid above the sediment was discarded, and 0.2 mL of a concentrated suspension of colloidal AgNPs (four times) was added to each sample of pollen grains. The mixture was vigorously homogenized using a vortex mixer. The pollen grains used in the study are displayed in Table I.
Pollen type and family.
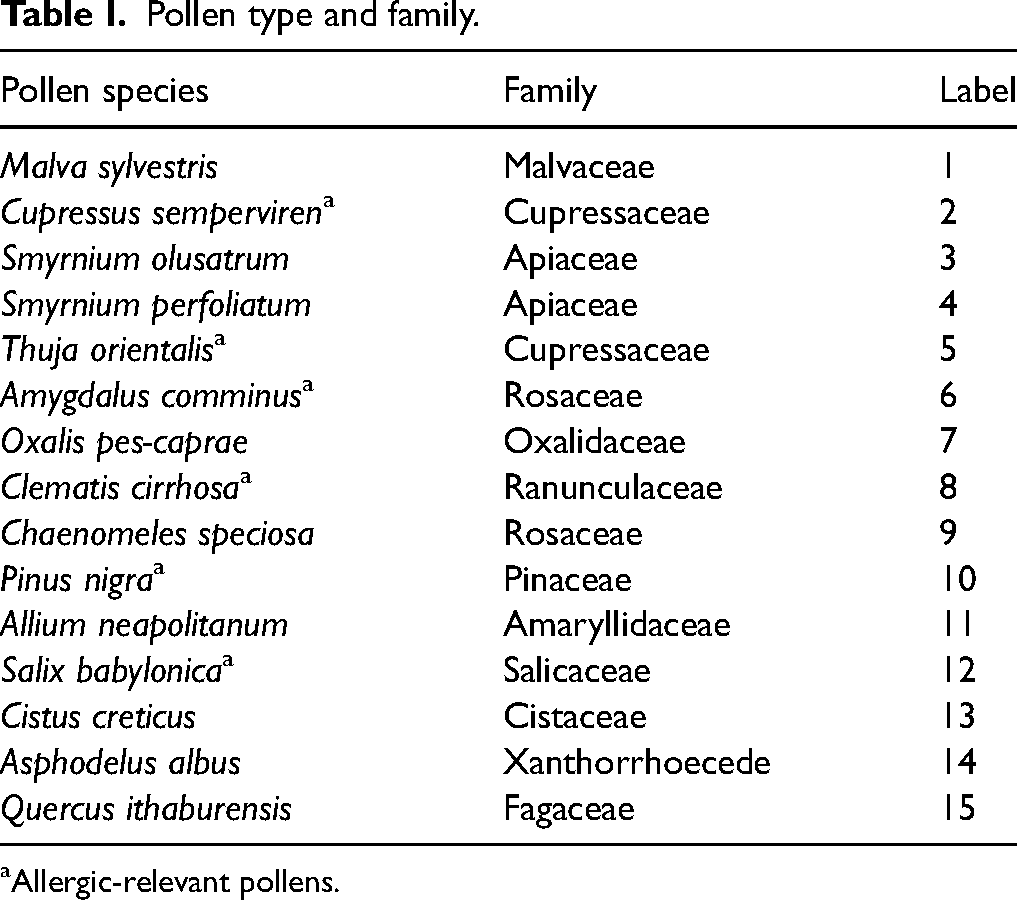
aAllergic-relevant pollens.
Convective Assembly (CA) of Pollen Grains and DC Method
The mixture of colloidal AgNP suspension and pollen grains was placed at the intersection of two glass slides. The angle between the slides was brought in the proximity of the substrate at an angle of ∼24°, and the velocity of the motorized translation stage controlled by a computer interface during the deposition was 1.0 µm/s. An area of 1.0 × 2.5 cm was coated with pollen and colloidal nanostructures. During the coating, the room temperature and relative humidity were measured to be 22–25 °C and 40

Schematic representation of the CA technique.
In the DC method, a mixture of four times concentrated colloidal AgNP suspension and pollen sample was mixed and dropped onto a CaF2 substrate with a volume of 200 µL. Ten spectra measurements were collected from three different spots on the droplet, each containing three pollen samples. This procedure was repeated three times.
Raman Instrumentation and SERS Measurements
The SERS spectra of pollen grains were collected using a Renishaw (UK) InVia Reflex instrument outfitted with a diode laser at 830 nm, a charge-coupled device detector, an edge filter, and a holographic grating (1200 grooves/mm) with ultra-fast imaging StreamLine Plus technology. StreamLine technology uses a fast and gentle mapping technique to prevent damage to the sample caused by lasers. The method involves illuminating with a line of laser light instead of an intense spot, and the spectra can be acquired faster from multiple points instead of using the point mapping acquisition method. For each spectral acquisition, a white light camera was placed on the microscope, and SERS spectra collection from the region of 582
Data Preprocessing
A total of 100 SERS spectra for each pollen sample were collected using the StreamLine mapping method of Renishaw inVia spectroscopy and post-processed using WiRE 4.1 software for cosmic ray removal, and spectra normalization.
Principal Component–Canonical Discriminant Analysis (PC-CDA) Classification Model
The following chemometric methodology, which involved performing a PCA was used to decrease the dimensionality of SERS spectra. PCA is an unsupervised statistical method used in chemometrics. The principal component (PC) transformation based on eigenvector decomposition implies a high degree of correlation in the data. It considers the statistical significance of the mean and the variance–covariance. It emphasizes valuable discrimination features by focusing on big variances by transforming a data set of n dimensions into a lower-dimensional space where the variance of the data is maximized and sorted in descending order. 32 The eigenvectors resulting from the analysis were acquired and the full region of the SERS spectra was then projected onto the new coordinate system defined by the primary directions of variance, known as the PCs. The PCs are linear combinations of the original data variables. The one-way analysis of variance is used to identify the most significant PCs with a significance level of p < 0.05, and first, the eight loading vectors were determined. 33 These PCs are then utilized in CDA to create diagnostic algorithms for classifying different pollen species.
Canonical discriminant analysis (CDA) identifies a set of linear combinations of quantitative variables that effectively highlight the distinctions between the groups. The CDA algorithm derives linear combinations of the quantitative variables, known as canonical variables, which reflect the between-class variation.34,35 Canonical variables have the highest number of multiple correlations with the groupings obtained in CDA. The coefficients calculated from the canonical variables in a non-standardized manner are referred to as the canonical coefficients or canonical weights. The standardized discriminant function coefficients indicate the specific impact of each variable on the discriminant function while considering the presence of other qualities included in the equation. The leave-one-out cross-validation (LOOCV) approach was used to estimate the performance of machine learning algorithms in an unbiased manner. 36 LOOCV is a method that, like the validation set approach, divides the data into a training set and a validation set. Nevertheless, the validation set consists of a single observation, while the training set comprises n − 1 observations. This method is iterated for each observation, resulting in the estimation of n models. Utilizing a substantial training set mitigates the issues arising from underutilizing a significant portion (or nearly all) of the data when estimating the model. The mean spectra of 100 SERS spectra obtained from a 10 × 10 matrix region from a population of 20 pollen samples per pollen species were utilized for the PC–CDA classification model regarding their spectral differences. It is important to work with data sets that have equal sizes within each group to increase the performance of multivariate analysis. 35 Table S3 (Supplemental Material) displays a classification matrix that was generated by the PC–CDA classification model and the LOOCV method on the SERS spectra from 15 different pollen samples. The matrix consists of two sections: the original count and the cross-validated count. The matrix displays the percentage of accurately categorized samples in both groups. The LOOCV technique employed 299 samples for training and one sample for testing, repeated 300 times for each pollen species. The PC–CDA classification model with the method of LOOCV was performed using OriginPro 2019b software (OriginLab Corporation).
Results and Discussion
Characterization of Nanoparticles
Citrate-reduced colloidal AgNPs were used in the investigation of the CA-SERS-based pollen grain sampling procedure and DC method. Before the suspension containing AgNPs and pollen grains was spread using the CA technique, the suspended solution containing AgNPs was characterized using UV spectroscopy (Perkin Elmer Lambda 25-UV) and transmission electron microscopy (TEM; Jeol). Figure 2a shows the ultraviolet visible (UV–Vis) spectrum of the solution containing AgNPs, and Figure 2b is the TEM image of AgNPs. The absorption spectrum in the UV–Vis range and the TEM image of the colloidal AgNP suspension at 420 nm indicate that the size of the AgNPs is around 60 nm, which is in line with the literature.37,38

(a) UV–Vis absorption spectrum of AgNPs suspension and (b) the TEM image of AgNPs.
Inter-Method Reproducibility of CA-SERS and Drop-Casting Method
The quality and reproducibility of the SERS signal are greatly influenced by the methods used to bring nanoparticles and the sample into contact. The choice of substrate for a SERS measurement is critical because it significantly affects the quality of the spectra. AgNPs or gold nanoparticles (AuNPs) are frequently employed in SERS investigations due to their simple synthesis, low cost, and strong boosting effect. 39 AgNPs are commonly employed as substrates for SERS. However, the analysis of biological analytes is hindered due to abnormal signals in the obtained spectra, which are caused by residual molecules from the manufacturing process or the layer covering the surface of the nanoparticles. 40 An inherent problem associated with the SERS technology is the dispersion of nanoparticles. Diverse alternative synthesis methods can be employed to uniformly fabricate SERS substrates. The electrodeposition approach allows for the dependable fabrication of SERS substrates by electrochemically depositing a metal sheet onto a substrate. 41 Colloidal nanoparticles are favored over evenly produced nanoparticles in this study as SERS substrates due to several compelling factors. The vast surface area of colloidal nanoparticles enhances the quantity of Raman scattering active sites. This leads to a more pronounced SERS signal when compared to nanoparticles that have been created identically but have a smaller surface area. They possess advantages due to their ability to be rapidly and inexpensively produced. Biological samples were introduced into a cuvette containing colloidal silver particles to identify pollen using SERS. 42 Within the literature, numerous applications exist that combine SERS-active substrates with pollen samples. The AuNPs solution was combined with pollen samples and dropped over CaF2. 22 Zhang et al. 43 achieved SERS scattering from a liquid combination including AgNPs and pollen samples. In this study, it is the first time a CA-based pollen-sampling method was used for the detection of different pollen species according to their spectral characteristic bands placed on the SERS spectra. The CA-based pollen-sampling method using colloidal AgNPs enhanced the reproducibility of SERS spectra by generating more consistent localized surface plasmon resonance foci around closely packed and evenly distributed AgNPs on the glass slide. The hydrophobic nature of the CaF2 surface was utilized in the dropwise sampling method, as it hinders the dispersion of the analyte and AgNPs during the drying phase. Moreover, it is favored in SERS-based studies because of its higher SERS signal quality when compared to glass.27,28,44 It was expected that the suspension containing pollen–AgNPs would be more disseminated if a glass surface with higher hydrophilic characteristics compared to CaF2 was used during sampling.
Initially, the intra-method reproducibility of the CA-SERS approach was assessed by analyzing SERS data from three distinct experimental sets. Then, the inter-method reproducibility of the CA-SERS and DC techniques was assessed by analyzing the coefficient of variation (CV) values of the SERS spectra obtained from pollen grains of Malva sylvestris. CV values were calculated by dividing the standard deviation by the mean and multiplying the result by 100. Table II shows the calculated CV results for intra-method reproducibility of the CA-SERS technique and inter-method method reproducibility of the CA-SERS technique and DC method.
The CV values for intra-method reproducibility of CA-SERS technique and inter-method method reproducibility of CA-SERS technique and DC method.

The CV values were determined using the spectra acquired from 10 pollen grains of M. sylvestris, Table II displays the calculated values of CV to compare the reproducibility of DC and CA-based SERS detection methods in terms of spectral repeatability. The mean SERS spectra obtained from three distinct locations in each experimental repetition at various time intervals were employed to evaluate the reproducibility of the methods between different regions where the spectra were collected and different time points for the observations conducted using both the CA and DC techniques. Higher CV values mean lower reproducibility of the method. The CV results demonstrated that the reproducibility of CA-based SERS detection is higher than that of the DC-based method. Figure 3a displays the SEM images of more organized pollen grains and colloidal AgNP aggregates than Figure 3b illustrating that the application of a dropwise sampling technique, involving a combination of colloidal AgNP solution and pollen samples resulted in the packaging of pollen grains and AgNPs clusters on the edges of the droplet, called the “coffee-ring” effect. 45
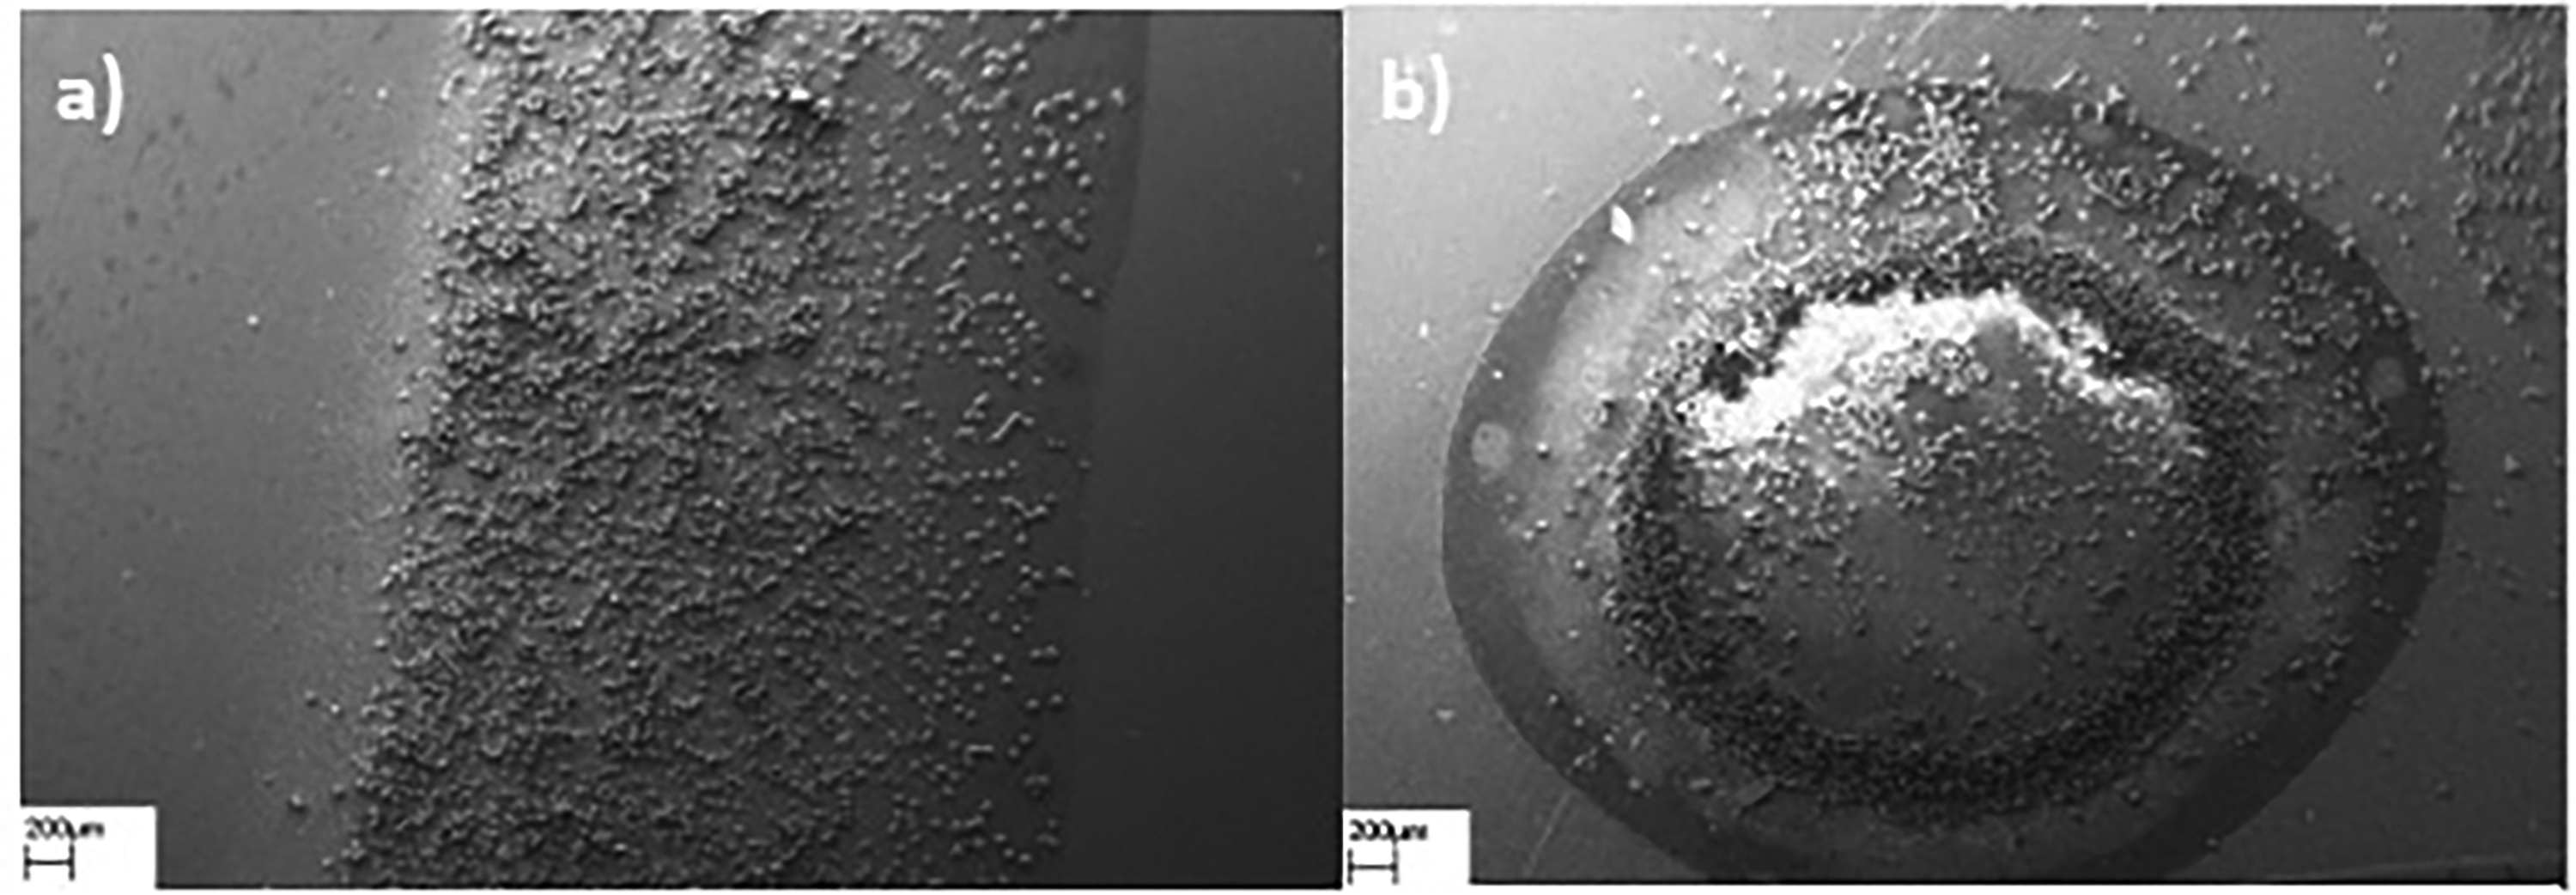
Scanning electron microscopy (SEM) images of M. sylvestris pollen grains and AgNP aggregates were prepared by using CA (a) and DC (b) methodologies.
Characteristics of SERS Spectra
Within the scope of the study, the pollen species investigated belong to a variety of taxonomic categories (Table I). For analysis, a total of 100 SERS spectra were acquired from a population of 20 pollen grains per sample. StreamHR point mapping was conducted on a square grid consisting of 10 × 10 scanned points, covering a total area of 22.5 μm × 22.5 μm (506.25 μm2) for each sample. A total of 100 spectra were collected for each sample, with 10 pollens analyzed for each type of pollen. The SERS spectra were obtained following the CA-based pollen-sampling method, utilizing colloidal AgNPs as the SERS substrate. Figures S1–S3 (Supplemental Material) display the mean of SERS spectra obtained from each type of pollen species and Figure S4 (Supplemental Material) illustrates the bar graph variations in spectral intensity of SERS bands for each pollen species.
The most prominent peak, observed at 730 cm–1, is highly distinctive to DNA and frequently functions as a distinguishing feature. 43 The spectral characteristics observed within the wavenumber range of 620–680 cm–1 are attributed to ring breathing modes in the DNA bases, C–S stretching mode of cystine, C–C twisting mode of tyrosine, aromatic ring def sporopollenin, and phenylalanine. Additionally, the bands observed around 715 cm–1 are attributed to the C–S stretching of methionine. 46 The spectral peak observed at 780 cm–1 can be attributed to the vibrational modes associated with the out-of-plane deformation of cytosine, thymine, and uracil, while the band ∼752 cm–1 corresponds to tryptophan. 47 The vibrational frequencies observed at 793 cm–1 are attributed to cytosine and uracil, while those at 815 cm–1, 820 cm–1, and 830 cm–1 are associated with the ring breathing modes of thymine, valine, and tyrosine.47,48 The SERS band is observed in the spectral area ranging from 860 to 915 cm–1, which can be attributed to the symmetric stretching mode of the amino group. 49 The contribution of carotenoid may be assumed to be at 960 cm–1, whereas the bands of phenylalanine can be observed at 1005 and 1030 cm–1. 38 Additionally, the vibrational frequencies observed at 1045 cm–1 are attributed to valine, while the band at 1050 cm–1 is associated with fatty acids. 47
The C–O–C stretch of the glycosidic link is the source of the 1090 cm–1 band, while glycerol, cellulose, and fatty acids are responsible for 1110, 1120, and 1130 cm–1 bands, respectively. 47 The spectral characteristics observed at 1150, 1180, 1190, 1210, and 1285 cm–1 are assigned to carotenoids, whereas 1170 cm–1 can be attributed to fatty acids.15,47 The band at 1215 cm–1 can be associated with tyrosine and phenylalanine, while β-sheet structure and amide III bands appear from 1230 to 1250 cm–1. 50 The vibrational frequencies observed at 1270 cm–1 are attributed to lipids, while those at 1285, 1305, and 1321 cm–1 are associated with thymine and adenine. 51 The bands at ∼1420–1470 cm–1 are assigned to the deformation mode of methylene (CH2) groups. 52 Additionally, the peak at 1370 cm–1 can be assigned to the C–H bending of protein, while the peak at 1046 cm–1 can be attributed to carboxylate ion (COO–) symmetric stretching.53,54 The tentative band assignment is given in Table S1 (Supplemental Material).
Principal Component–Canonical Discriminant Analysis (PC-CDA) Classification of Pollen Grains
The PC-CDA discrimination model using the SERS spectra data set was utilized to examine the spectral differentiation of pollen grains. To get their SERS spectra, 15 different pollen grain samples went through preprocessing steps such as getting rid of cosmic rays and normalizing the SERS intensity. Statistical analysis was subsequently performed on the preprocessed spectral information using PC-CDA techniques. PCA was utilized before CDA to decrease the dimensionality of the data set and produce the PC loading vector, which captures the main variances in the data. Figure 4 displays the PCA decomposition as PC loading plots of training SERS spectral data. The PC data were then employed to convert them into canonical discriminant functions for classifying the pollen samples based on SERS data due to its superior ability to maximize the separation between predefined groups and handle multiple dependent variables effectively. CDA was selected because it provides clearer interpretation and better discrimination in the context of multivariate data, which is crucial for accurate classification in complex data sets such as SERS spectra. 55 Then, the LOOCV approach was employed to estimate the prediction using the PC-CDA diagnostic algorithm for pollen species. The LOOCV method, a form of cross-validation, is a crucial step in evaluating the dependability and applicability of the classification model. During LOOCV each individual case is systematically removed from the data set, and the classification functions are then constructed from the remaining examples. The case that has been excluded is thereafter categorized according to these functions. Each case in the data set is iteratively subjected to this technique, verifying that every case is utilized as both a training set and a test case precisely once. The prediction possibility of the PC-CDA classification model using LOOCV was achieved at 99.3% sensitivity, 97.6% specificity, and 98.5% accuracy. In addition, the confusion matrix to assess the effectiveness of the PC-CDA model both for original and predicted classification was demonstrated in Figure 5. A confusion matrix is an essential performance evaluation tool in machine learning that aids in the assessment of the accuracy and efficacy of a classification model. The results of the confusion matrix indicate that the integration of PCs into the CDA classification model offers a strong framework for the precise classification of pollen samples using SERS spectra.

The PC loading plots of SERS spectra obtained for pollen grains.

The confusion matrix for the performance evaluation of the PC-CDA model for original and cross-validated classification. True positives (TP), true negatives (TN), false positives (FP), and false negatives (FN).
The results depicted in Figure 6 demonstrate the discrimination of pollen samples from 15 different groups in the PC-CDA three-dimensional (3D) scattering plot. In Figure 6, the discrepancies between specific groups have decreased because of the PC-CDA 3D scattering plot, which was facilitated by the three discriminant functions from the PCs of each pollen group. However, the first eight canonical discriminant functions (Table S2, Supplemental Material) were employed in the CDA analysis. While the pollen types of Oxalis pes-caprae, Asphodelus albus, Pinus nigra, and Allium neapolitanum were significantly separated from other pollen types, other groups were clustered closer together in the PC-CDA 3D scatter plot in Figure 6.
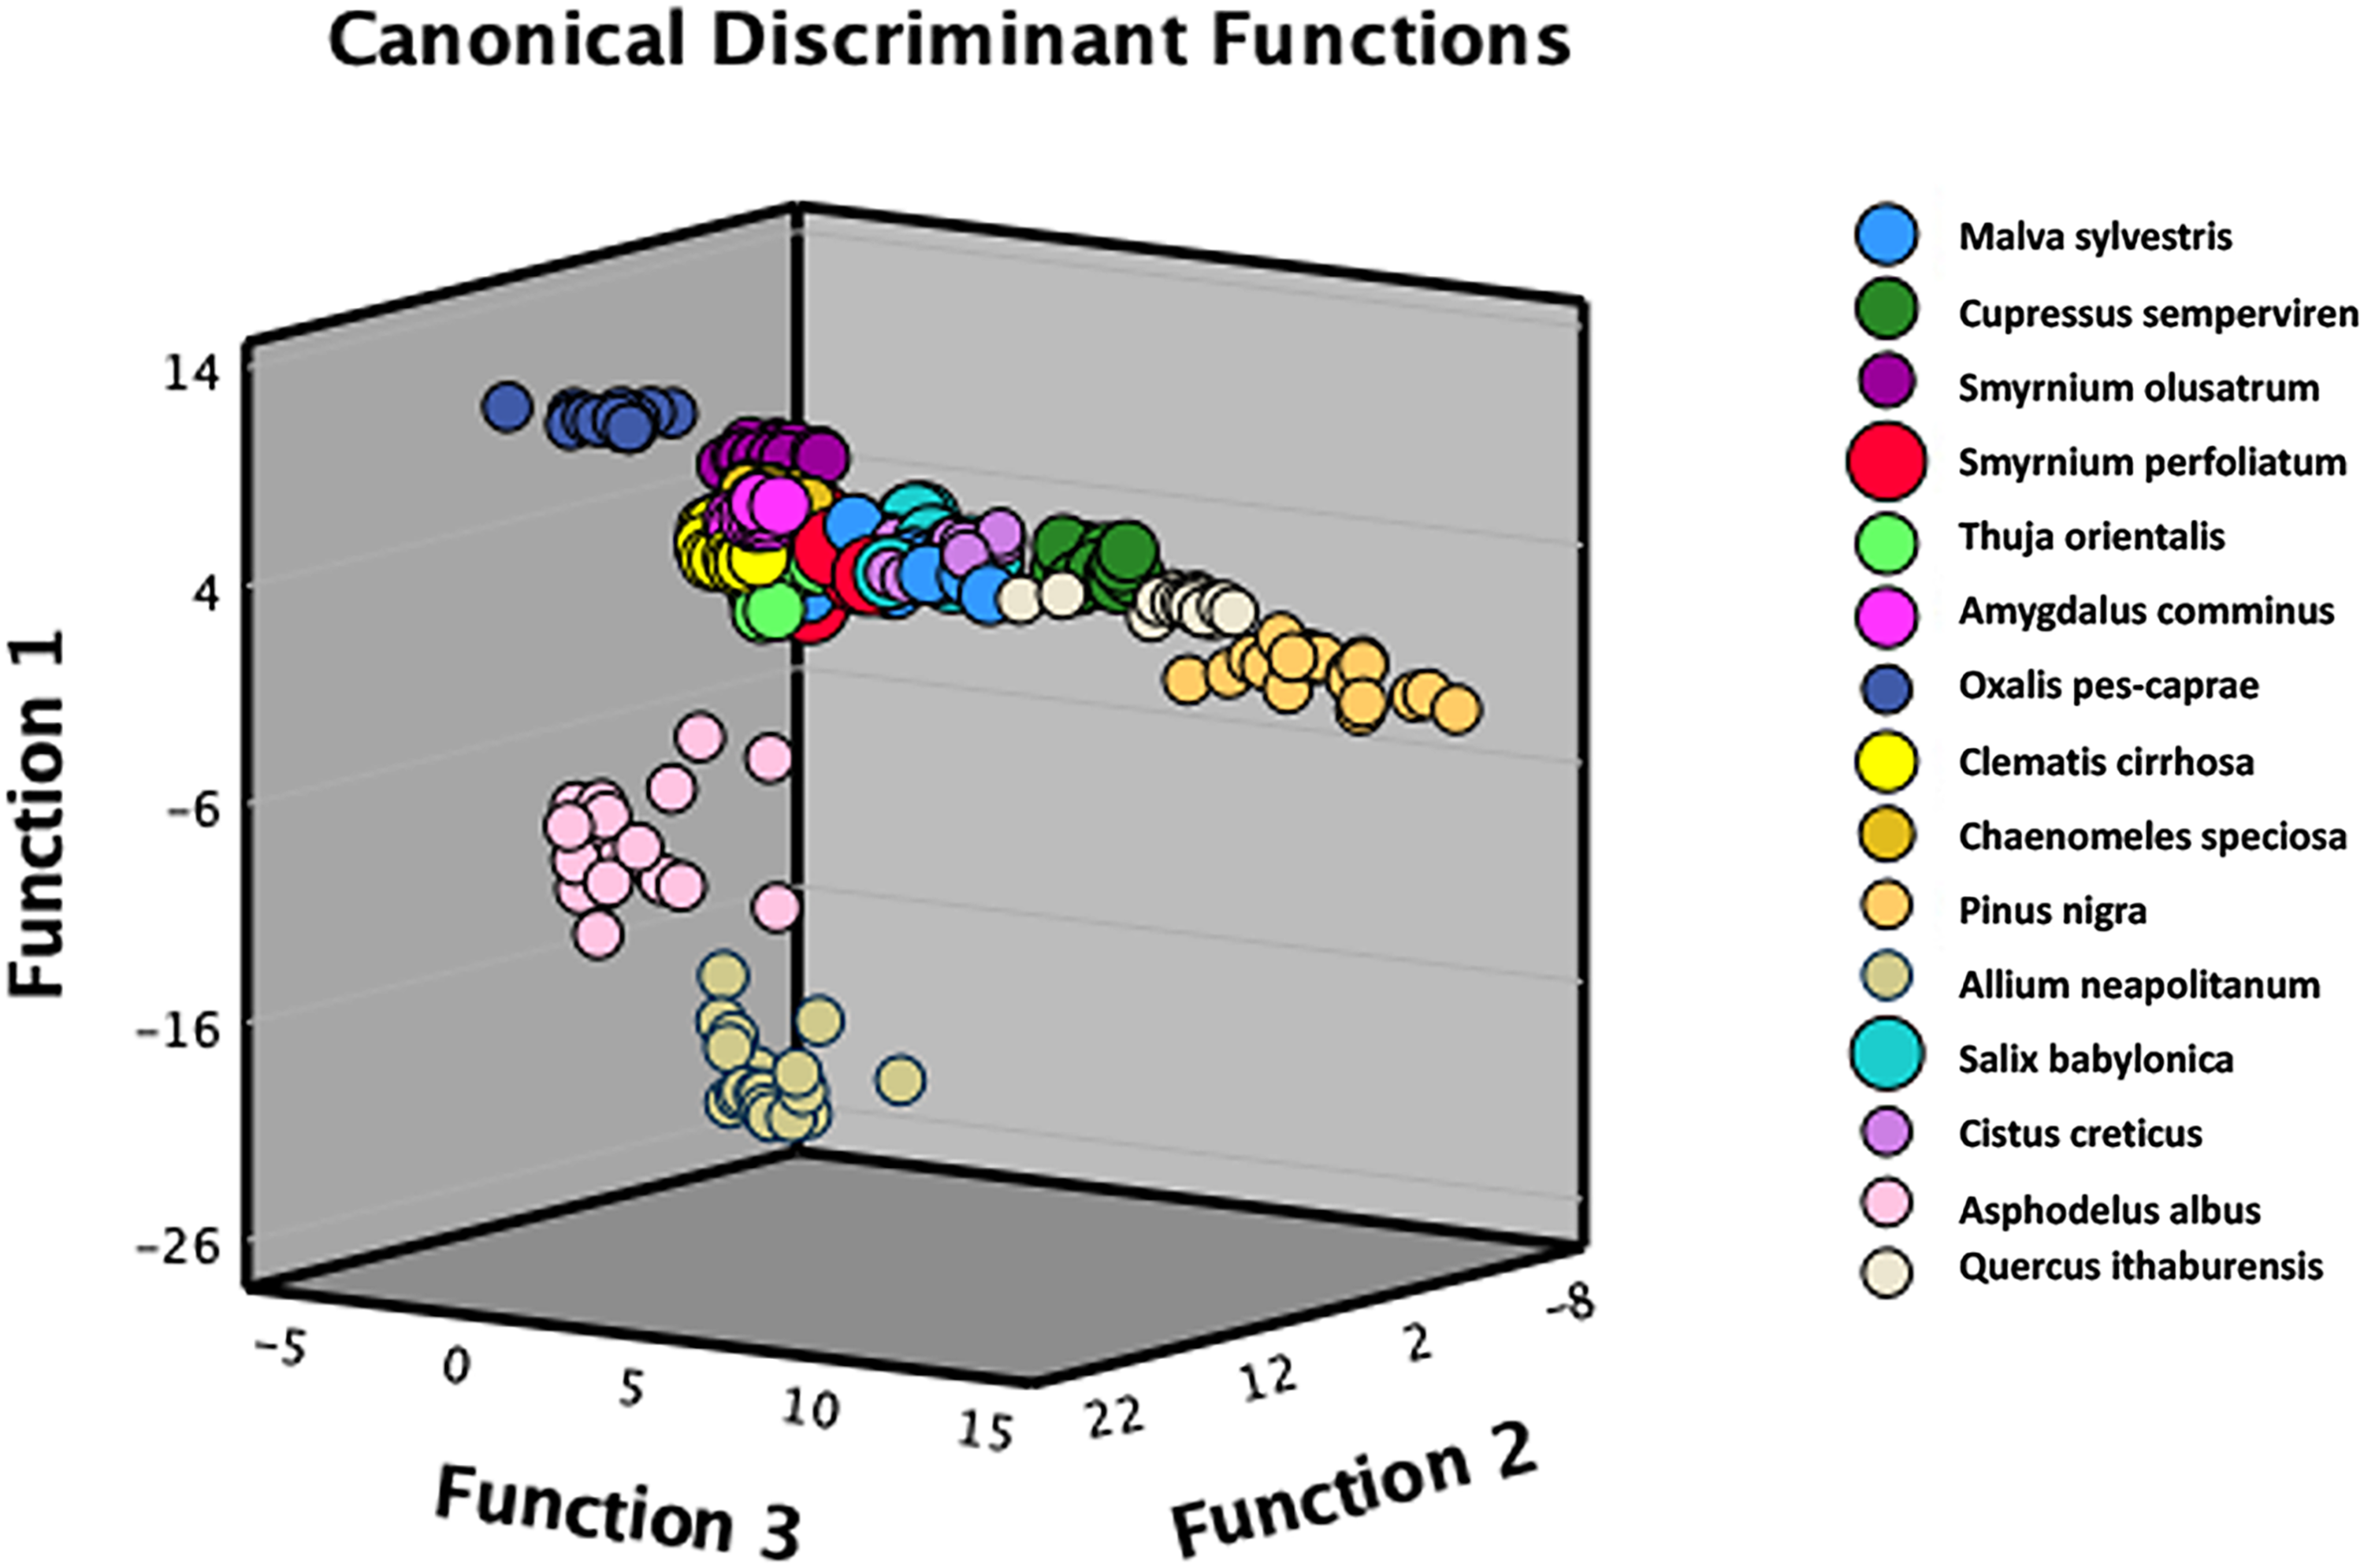
The PC–CDA 3D scattering plot of SERS spectra obtained from 15 pollen grains.
Pollen species O. pes-caprae and A. neapolitanum were distinctly differentiated, which were probably from other pollens in the two-dimensional-CDA scattering plot due to their significantly different biochemical structural properties compared to other pollens. 56 Variations in SERS spectral pattern and band intensities enhance the possibilities of precisely identifying pollen through the PC-CDA discriminant analysis. The SERS bands that contribute to the differentiation could be 1050, 1090, 1120, 1150, and 1270 cm–1 for O. pes-caprae pollen grain while 820, 1130, 1185, 1215, and 1450 cm–1 are for A. neapolitanum pollen grain. The spectral pattern of each pollen species by their mean spectra is demonstrated in Figure 4, and the bar graph representing SERS band intensities for each pollen is shown in Figure S1 (Supplemental Material). The spectral bands at 1050, 1090, 1120, 1150, and 1270 cm–1 differentiated for O. pes-caprae providing information about the biochemical structure of O. pes-caprae. The spectral bands observed at 1050 and 1090 cm–1 could be attributed to the stretching vibrations of C–C and C–O bonds in oxalic acid.57,58 The bands observed at 1120 and 1150 cm–1 are associated with the stretching vibrations of the C–N bonds, indicating the presence of amino acids and proteins. 58 The band observed at 1270 cm–1 corresponds to C–H bending, which typically indicates the presence of unsaturated fatty acids. This band is particularly influenced by α-linolenic acid, which is abundant in O. pes-caprae.56–58 The characteristic SERS bands for A. neapolitanum pollen observed at 820 cm–1 are commonly linked to the vibrational modes of glycosidic bonds in polysaccharides, which suggests the presence of cellulose structure in the pollen. 59 The band at 1130 cm–1 may correspond to the stretching of the C–O bond, indicating the existence of phenolic chemicals.56,60 The band observed at 1185 cm–1 probably corresponds to the stretching vibrations of C–N bonds in proteins, while the band at 1215 cm–1 is linked to the symmetric CH2 bending vibrations in lipids.60–62 On the other hand, the band at 1450 cm–1 may be caused by the C–H stretching vibrations in both proteins and lipids in the pollen structure.60–62
Conclusion
Gaining knowledge about the properties of nanoparticles and how they interact with biological samples is essential for the advancement of sophisticated sensing methods. The purpose of this study was to characterize and use colloidal AgNP in a CA-SERS-based pollen grain sampling method. The comparison between the reproducibility of the DC method and the CA-SERS approach reveals that the CA-SERS method offers higher quality and consistency in SERS spectra. The CA-based SERS sampling and detection technique provides a less chaotic configuration of AgNPs, resulting in higher reproducible SERS spectra. The analysis of SERS spectra derived from different types of pollen demonstrated unique bands corresponding to DNA bases, amino acids, lipids, sporopollenin, carotenoids, and other macromolecules. PCA and CDA methods, which rely on the presence of characteristic bands specific to each pollen type, can identify pollen. The PC-CDA classification study also showed that it was possible to tell the difference between different pollen grains by looking at their SERS spectra, which was 97.7% accurate. This method demonstrates the potential for accurate pollen identification and categorization in environmental monitoring and allergy detection applications. Moreover, this progress opens opportunities for utilizing pollen grains in several disciplines, including environmental science, agriculture, and medicine.
Supplemental Material
sj-docx-1-app-10.1177_27551857241285026 - Supplemental material for Computerized Principal Component–Canonical Discriminant Analysis Classification Model for Pollen Grain Identification Using Surface-Enhanced Raman Spectroscopy
Supplemental material, sj-docx-1-app-10.1177_27551857241285026 for Computerized Principal Component–Canonical Discriminant Analysis Classification Model for Pollen Grain Identification Using Surface-Enhanced Raman Spectroscopy by Sevda Mert in Applied Spectroscopy Practica
Footnotes
Acknowledgments
The author acknowledges Fikrettin Şahin, the chair of the Genetics and Bioengineering department at Yeditepe University, for granting access to the scanning electron microscope and Raman spectroscopy, and to Kemal Yıldız for the pollen grain samples.
Declaration of Conflicting Interests
The author declared no potential conflicts of interest with respect to the research, authorship, and/or publication of this article.
Funding
The author received no financial support for the research, authorship, and/or publication of this article.
Supplemental Material
Supplemental material for this article is available online.
References
Supplementary Material
Please find the following supplemental material available below.
For Open Access articles published under a Creative Commons License, all supplemental material carries the same license as the article it is associated with.
For non-Open Access articles published, all supplemental material carries a non-exclusive license, and permission requests for re-use of supplemental material or any part of supplemental material shall be sent directly to the copyright owner as specified in the copyright notice associated with the article.