
Abstract
Surface-enhanced Raman spectroscopy (SERS) has exceptional analytical sensitivity and selectivity. However, SERS irreproducibility presents an obstacle when using it for precise quantitative measurements. In this study, colloidal nanoparticles evaporated to dryness are used as a SERS active surface for the detection of the HIV drug emtricitabine (FTC; trade name Emtriva). Despite the irreproducibility of the SERS resulting from the stochastic process of evaporation, using a SERS scanning instrument, the SERS enhancement factors of spatially resolved spectra have a well-defined distribution of signals for a given analyte concentration. This distribution follows a power law function ranging from weak (very abundant signals) to very strong (sparse signals). By definition, a power law distribution cannot have a true mean. Hence a cumulative distribution function was used to model the concentration of emtricitabine, and calibration curves were constructed. For stochastically generated quantitative data sets, the precision of this approach is superior to methods utilizing signal averaging and improves analytical sensitivity.
Keywords
Introduction
Raman spectroscopy excels at selectivity due to unique vibrational fingerprints even for small molecules. Despite its weak signal, Raman is also useful as a quantitative method. An ability to acquire spectra from aqueous samples makes Raman spectroscopy a valuable tool for analysis in the biological field, unlike infrared spectroscopy.1–5 The lack of sensitivity of Raman spectroscopy can be overcome by the utilization of surface-enhanced Raman spectroscopy (SERS), which enables the detection of molecules with concentration orders of magnitude lower than Raman spectroscopy (even single molecule detection).6–9 Despite outstanding sensitivity, the reproducibility of SERS enhancement is still challenging, causing a significant degree of irreproducibility in quantitative measurements.10–13 The irreproducibility is a result of the large number of factors required for extreme SERS enhancement (“hotspot” enhancement). These factors involve the nature of the molecule, the nature of the nanoparticle (NP) used for SERS enhancement, the molecule's orientation at the NP surface, and the location of adjacent NPs.
Generally, there have been two approaches used to solve the problem of irreproducibility for SERS quantitative experiments. One common approach is the modification of the SERS NP surface to bind/release Raman reporter molecules.14–16
Although this approach is effective, the time and experimental requirements together with the cost for the realization are great in comparison to standard procedures where the analyte is adsorbed onto the NP surface. The second approach includes advanced synthetic techniques of SERS surfaces where unique characteristics are sought for enhancing “hot spot” formation in a reproducible manner (e.g., beam surface milling or surface etching to generate active surface arrays, generation of unique NP geometries, generation of specific NP size distributions).17–28
In comparison, the simplest approach involves the use of colloidal NPs (CNPs) prepared via the reduction of metal salts, e.g., silver nitrate (AgNO3), silver perchlorate (AgClO4), chlorauric acid (AuHCl4), etc., using common and stable reducing agents, e.g., sodium borohydride (NaBH4), sodium citrate (Na3C6H5O7), hydroxylamine hydrochloride (NH2OH·HCl), etc., where minimal care is required to maintain a monomodal size distribution of NPs. This method has been used in many studies.29–34 When an analyte/analyte solution is added to the colloid, the equilibrium of adsorbed and non-adsorbed analyte (i.e., SERS-active/inactive) typically results in a limit of quantitation in the micromolar range. 35 To enhance the sensitivity of these easily fabricated SERS colloids, various salts (e.g., NaCl, MgSO4, etc.) are employed to aggregate NPs. This significantly increases the SERS enhancement and improves the detection limit.36–38 However, the difficulty of controlling the aggregation process results in significant irreproducibility and represents the main disadvantage of this strategy. The evaporation-to-dryness (ETD) of analyte/NP colloids is another very effective strategy to force aggregation of NPs and adsorption of the analyte. Although ETD also suffers from significant irreproducibility, it has the advantage of yielding a solid state where the equilibrium between adsorbed and non-adsorbed analyte is removed. The net effect of sampling a much smaller volume in the solid state and the absence of a non-adsorbed analyte is a higher analytical sensitivity with respect to salt-aggregated SERS colloids.
In the case of colloidal SERS (with or without aggregation), convection and Brownian motion results in an averaging of the different SERS enhancement factors present in the colloid due to the timescale of the Raman measurement compared to particle motion. In the case of spatially resolved Raman of ETD SERS, the heterogeneity of the SERS enhancement is spatially resolved.39–42 Thus, instead of relying on the averaging of a stochastic event that has no true mean, the experimental spectra can be used to generate a distribution representing SERS enhancement. This distribution, expressed by a histogram, is described by a power law function where weak signals rather than extremely high signals are more abundant due to the many conditions that must be met, and the variables involved upon evaporation (NP proximity, packing density, molecular adsorption geometry, etc.).43,44
Many processes and properties in nature can be described by a power law distribution. 45 A cumulative distribution function (CDF) and a probability density function (PDF) are employed for data analysis of processes that follow a power law distribution. In terms of data analysis, the functions characterize the distribution of the data differently. The CDF is used for discrete and continuous random variables, as it aggregates probabilities for all potential values of the random variable. As a cumulative function, it sums up the probability of the specific value from 0 to 1. On the other hand, the PDF is applicable only to continuous random variables, where the probability is spread across an infinite range of values. PDF expresses the probability of a random variable gaining a value exactly equal to that variable, while the CDF represents the probability of a random variable taking a value less than or equal to the variable. Utilizing a CDF offers easier calculation and visualization of output distribution variations. As an example of using a CDF in data analysis, a CDF was used for characterizing mass spectra of intact proteins, global sensitivity analysis of environmental models, quantification of antiviral drug Tenofovir, or as a method for normalizing variable-angle microwave observations.46–49
In this investigation, aqueous solutions of the HIV drug emtricitabine (FTC; trade name Emtriva) are quantified at sub-micromolar levels using spatially resolved SERS of surfaces prepared by ETD. Emtricitabine is very similar to a nucleic base cytosine (Figure S1, Supplemental Material). Therefore, it is hypothesized that it interacts with the NP surface in the same way, which means that the heteroatoms represent the main binding sites. 50 The SERS detection and quantification of emtricitabine in aqueous samples are crucial for the future detection and quantification of emtricitabine directly from biological samples such as blood, blood plasma, or urine.
The resulting spatially resolved spectra are analyzed using a CDF to generate a quantitative calibration curve and the results are compared to traditional signal-averaging methods of quantitative analysis.
Materials and Methods
Instrumentation
A Wasatch Photonics 785 nm Raman spectrometer with a single-stage thermoelectric cooler-cooled charge-coupled device detector was used to collect SERS spectra. Spatially resolved spectra were collected by interfacing the Raman spectrometer to a programmable x,y stage. In-house developed software synchronously controlled both data acquisition and sample scanning. For all spectra, a 785 nm laser at 15 mW was used to generate SERS spectra. Each sample was pipetted into an individual well on an aluminum well plate with eight columns and five wells in each column (the diameter of each well is 6000 µm with 20 µl volume and 1.778 mm depth). Scanning parameters were set to provide 30 μm spatial resolution for each spectrum. Using these parameters, a symmetric raster pattern was used to collect 1800 SERS spectra from each well and the spectra were collected along each x-axis scan at a constant scan velocity (124 µm/s) with a fixed spectral integration time. Hence, the acquired data set contains spectra from a large area of each well including the walls of the wells.
The total time for well acquisition was 25 min. Details about the Raman scanner, well plate, scanning parameters, and software operation have been previously published. 51
A Scientific Evolution 201 ultraviolet-visible (UV–Vis) spectrophotometer was used to characterize Ag CNPs. Spectra were acquired from 700 to 250 nm using a quartz cuvette with an optical path length of 10 mm. A NanoBrook particle analyzer (Brookhaven Instruments) was utilized for a dynamic light scattering (DLS) analysis with the 90° detection angle of Ag CNPs at 25 °C.
Materials
Sodium hydroxide (NaOH), NH2OH·HCl, AgNO3, and emtricitabine (FTC) certified secondary pharmaceutical standards were purchased from Sigma-Aldrich. Perchloric acid 69–72% (HClO4) was purchased from J.T. Baker. Ultrapure water (>18.0 MΩ·cm) was purified using a Millipore Milli-Q gradient system; 1100-certified aluminum was used for the fabrication of the aluminum well plate.
Synthesis of Ag NPs
The glassware used for the synthesis was cleaned with aqua regia (nitric acid hydrochloride), rinsed with deionized (DI) water, and then rinsed with Milli-Q water prior to use. Ag CNPs were prepared based on the Leopold and Lendl procedure, where 0.3 mL of 1 M NaOH was mixed with 90 mL of 1.6×10⁻³ M NH2·HCl. 31 This mixture was stirred on a magnetic stirrer whose rotation speed was set to 360 rpm, while 10 mL of 0.01 M AgNO3 was added dropwise. The final mixture was stirred for 45 min. The synthesis was characterized using a UV–Vis spectrophotometer (Figure S2, Supplemental Material) and DLS, where the mean value of the average effective particle diameter was 55.31 nm with a standard deviation (SD) of 0.73 nm and the polydispersity index was 0.316 with a SD of 0.012 (Figure S3, Supplemental Material). The concentration of Ag CNPs in the total volume of synthesis was 3.84 × 10⁻⁹ M.
Cleaning Procedure of the Aluminum Well Plate
For the deposition of SERS samples, an aluminum well plate with eight columns and five spots in each column was used. Each well, measuring 6000 µm diameter and 1.778 mm deep, was separated from each other by 12 700 µm in each column. The plates were reused for the experiments; therefore, they were cleaned between experiments based on the previously published cleaning procedure. 51 Briefly, the plate was soaked in 50 mL of 1 M NaOH for 2 min, rinsed with DI water, and soaked in fresh 50 mL of 1 M NaOH solution for 2 min, then rinsed with DI water and placed in a fume hood until dried. After the plate was dry, two drops of 4 M HClO4 from a Pasteur pipet were deposited in each well for 6 min. Finally, the plate was rinsed with DI water and placed in a fume hood until dried.
Preparation and Deposition of the Samples for the Experiments on the Aluminum Well Plates
This process was published previously. 51 Briefly, 55 µL of an aqueous emtricitabine sample was added to 55 µL of Ag CNP solution and vortexed for 3 s in a small centrifuge tube. This process was performed for all seven concentrations and a blank (emtricitabine concentrations: 500, 400, 300, 200, 100, 50, 40, and 0 ng/mL). After a 1 h incubation time, 20 µL of each sample was deposited in five wells (one column of replicates) and allowed to dry at room temperature in a chemical hood. The mixing of Ag CNPs and sample diluted the NPs, but the reaction mixture was ETD before the data was acquired. Therefore, the reproducibility of the spectral data was not influenced.
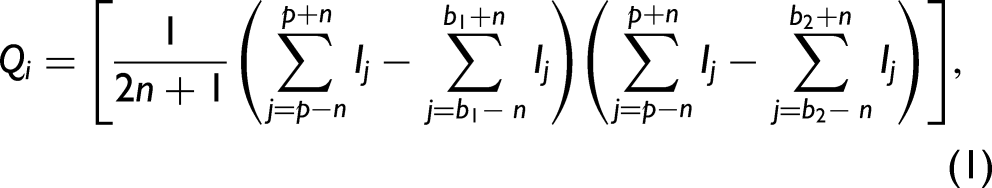
Data Analysis Process
During a typical experiment, 1800 spectra were collected from each well. Due to a high irreproducibility of SERS enhancement from scanned areas with evaporated CNPs, the SERS intensities fluctuate greatly even for one concentration of the sample. Therefore, for every data set, the Qi values are calculated for each spectrum, the Qi values for every single concentration from all replicates (typically five wells) are sorted in ascending order and an index rank is assigned to each Qi beginning at one (for spectra with a small value of Qi) and gradually increasing. The Qi definition is given in Eq. 1. In essence, the Qi is simply the peak height minus a baseline set at a lower frequency times the peak height minus a baseline at a higher frequency with the condition that both must be positive or else Qi is zero (i.e., no defined peak exists if both are not positive). Sorting the spectra in ascending order of Qi represents a very easy and fast way to filter the spectra with no or low intensity. Then only spectra with a high intensity (an arbitrary number of the top spectra from every single well can be employed) of the selected peak or peaks can be used for further analysis. The top selected spectra from each well can be averaged for every concentration and the calibration curve is built as the height of the selected peak with respect to the baseline. The detection of the antiviral drug tenofovir using the Qi analysis was previously published. 51
To calculate the CDF, Qi values for a given well were sorted in ascending order of the Qi. Next, an integer index was given to each unique spectral Qi (e.g., 0 for the lowest Qi value and increasing by one for every unique following Qi). The CDF was then calculated by dividing each index by the total number of indices. This process is repeated for each assigned index. This CDF value is then plotted against the corresponding logarithm of the Qi value. For all concentrations, the result is a CDF with y values ranging from 0 to 1 and x values ranging from minimum Qi to maximum Qi.


Results and Discussion
In Figure 1, an average spectrum is shown for each emtricitabine concentration. Each average corresponds to the top 10% of all collected spectra from five wells sorted by Qi value. The Qi analysis was done based on the SERS peak of emtricitabine at 794 cm–1 , the most intense SERS peak in the emtricitabine spectrum. The data set was scaled down from 9000 spectra acquired from five wells (all data included) to 900 (10% of data from five wells), which means 180 spectra from one well were included during the post-data collection data analysis. In Butler et al., 51 where a different HIV drug tenofovir was analyzed, the top 10% spectral selection based on the Qi showed the best signal-to-noise ratio compared to employing 100% and 50% data. To demonstrate the advantage of the selection of the spectra based on the Qi, Figure 2 shows representative offset spectra from one well for three different concentrations: 500, 100, and 40 ng/mL. Despite the same concentration of emtricitabine and the same well, the intensities of the SERS peak at 794 cm–1, which represents a ring breathing mode (see band assignment in Table S2, Supplemental Material), are very different. The peak at 1100 cm–1 was also presented in some of the spectra, especially for lower concentrations of emtricitabine and blank. It is assumed that some impurity from a synthetic process of Ag NPs is responsible for this peak, as was previously published. 52 This peak is not visible in spectra with higher concentrations, because the emtricitabine is preferentially attached to the surface of Ag NPs. Nevertheless, with decreasing concentration of emtricitabine, the impurities have more free places on the Ag surface for their binding. This peak was not used for any analysis in this paper and the region of the peak at 794 cm–1, which was used for the data analysis, does not have any background peaks from Ag CNPs in this spectral region. Indeed, all concentrations exhibit some spectra where the Qi is zero and some spectra where their Qi values overlap with those at other concentrations. This is a result of the evaporation process yielding extreme heterogeneity of SERS enhancement as a function of spatial position. This is also reflected in the histograms shown in Figure 3. As shown, there are just a few spectra with extraordinarily high Qi values at each concentration. The most intense SERS signals are not coming from the coffee ring and are randomly distributed across the well (an example of the mapping of Qi values across the well is shown in Figure S4, Supplemental Material). The rapid decrease in the number of spectra as a function of the Qi follows a power law with a negative fractional exponent. Since the numbers and Qi values of spectra at the high end greatly influence the calculated mean spectrum, and these are highly irreproducible, there is no true mean. This is true for most processes governed by power laws. Alternatively, there is a unique distribution of Qi values for each concentration, i.e., the power law governing the process is a function of concentration.
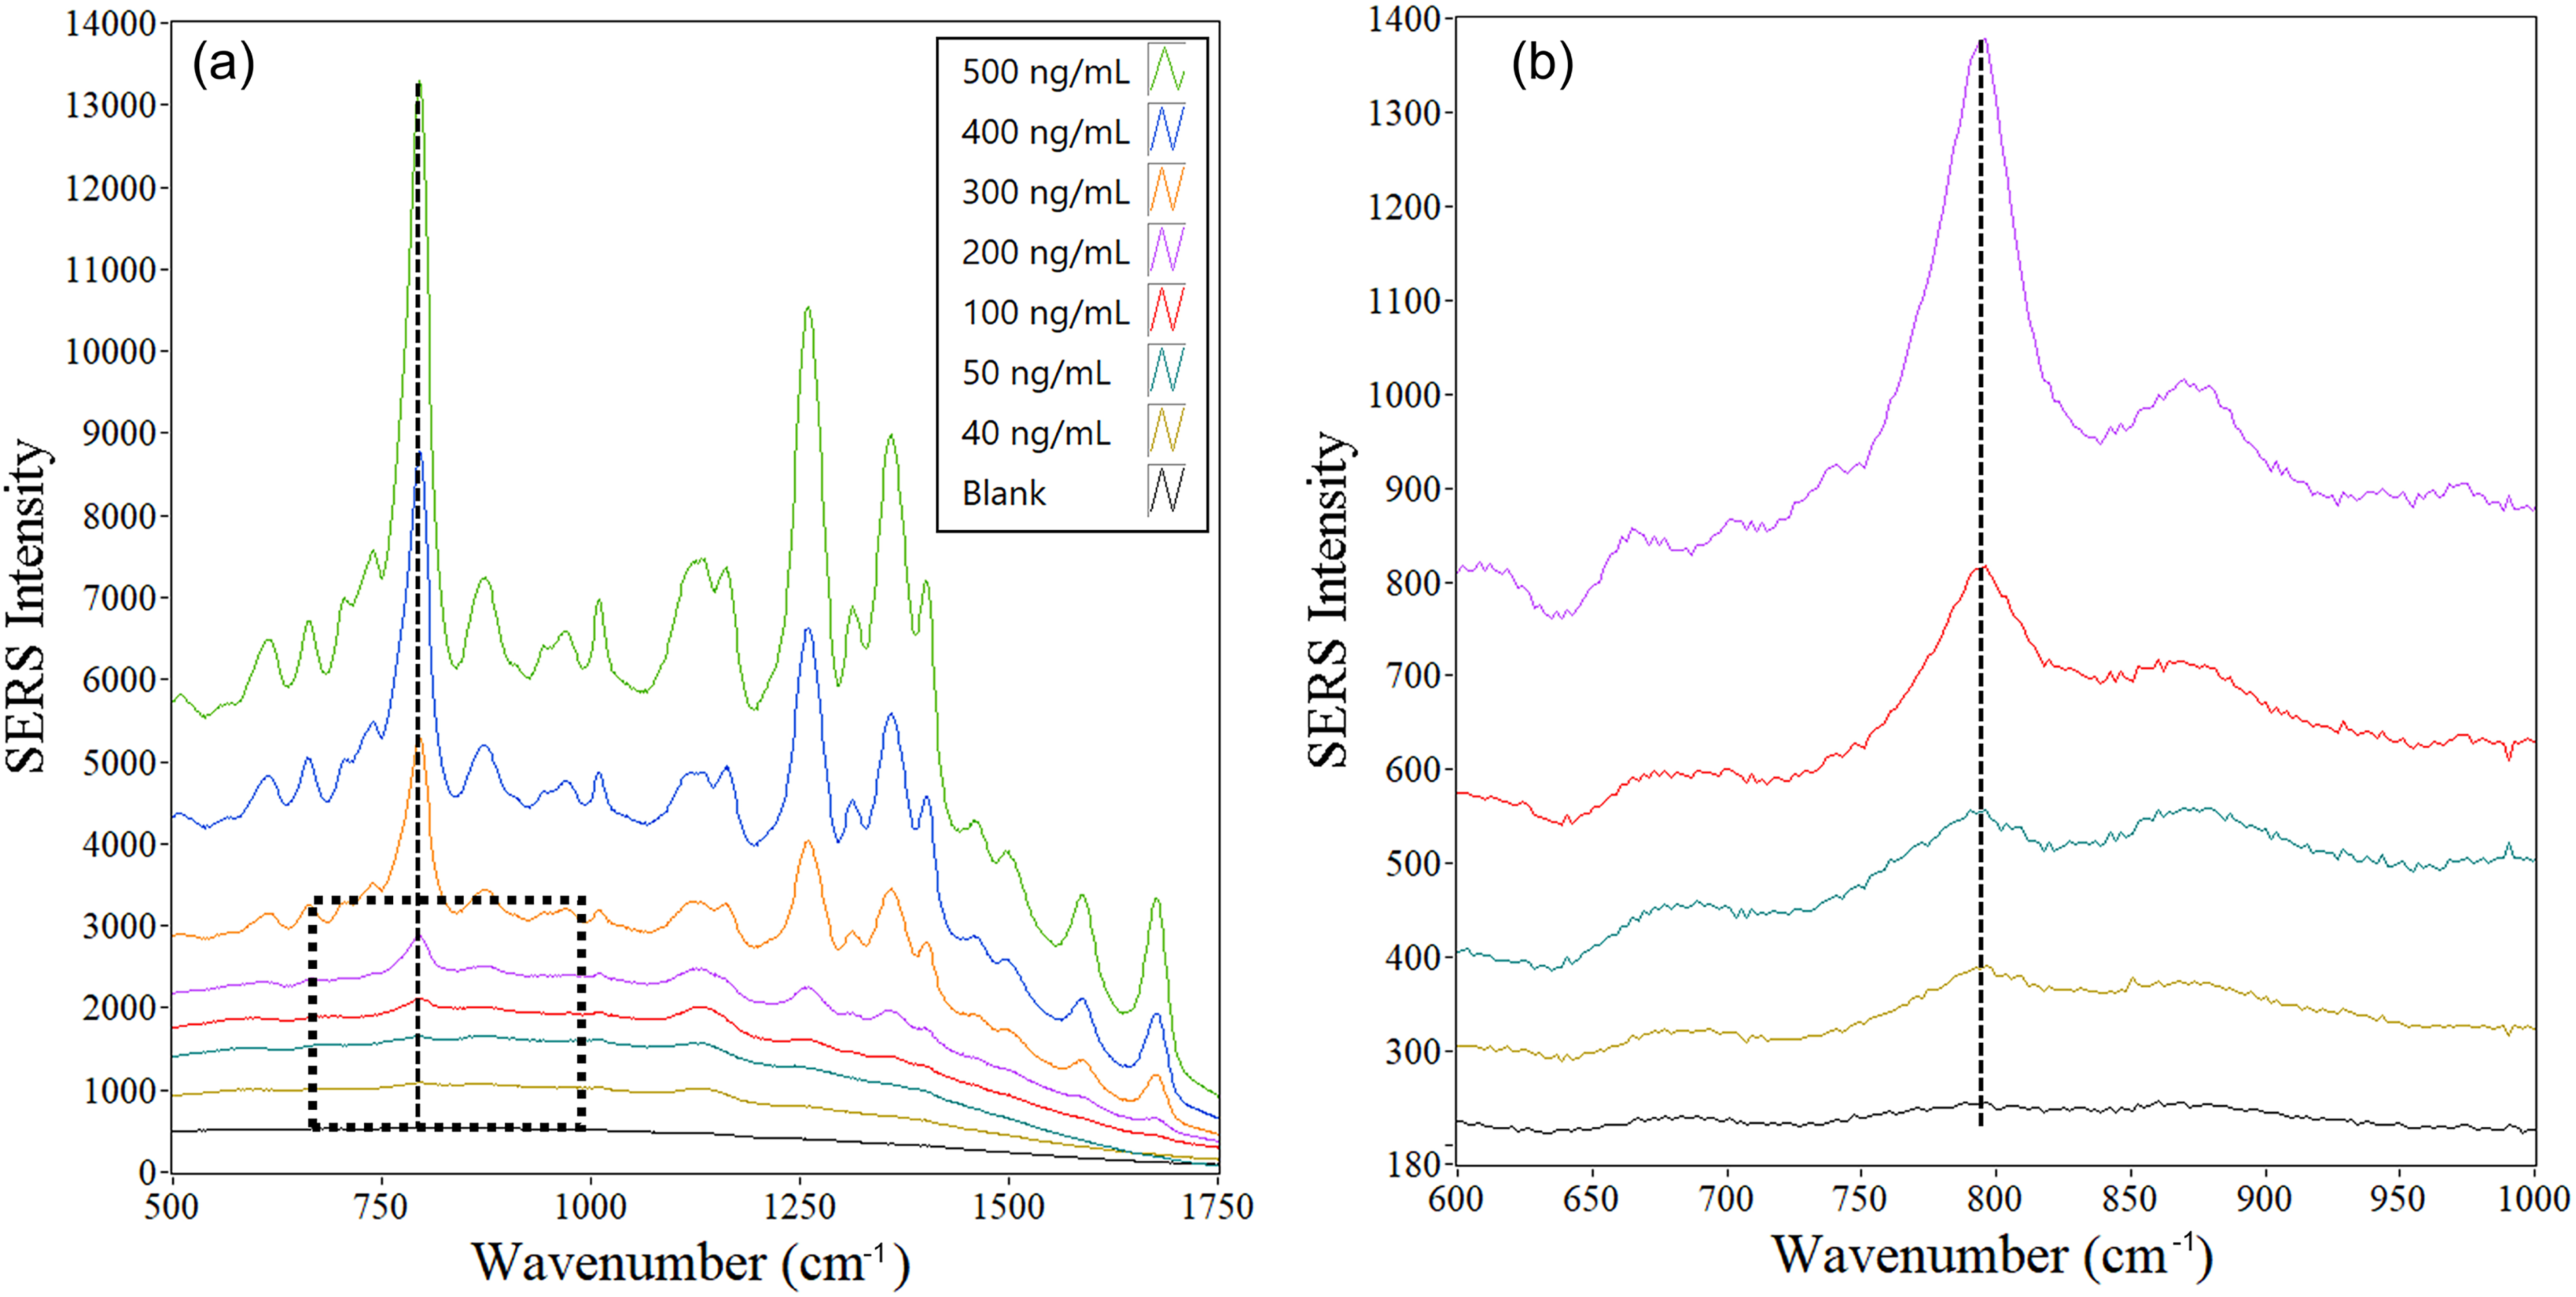
Average spectrum of the top 10% of the Qi ranked spectra as a function of emtricitabine concentration. Five wells were used for each average (i.e., the top 900 spectra out of 9000 spectra for each average). (a) All concentrations, (b) enlarged spectral area for lower concentrations (from the top: 200, 100, 50, and 40 ng/mL, and a blank from (a). Spectra are offset for clarity.
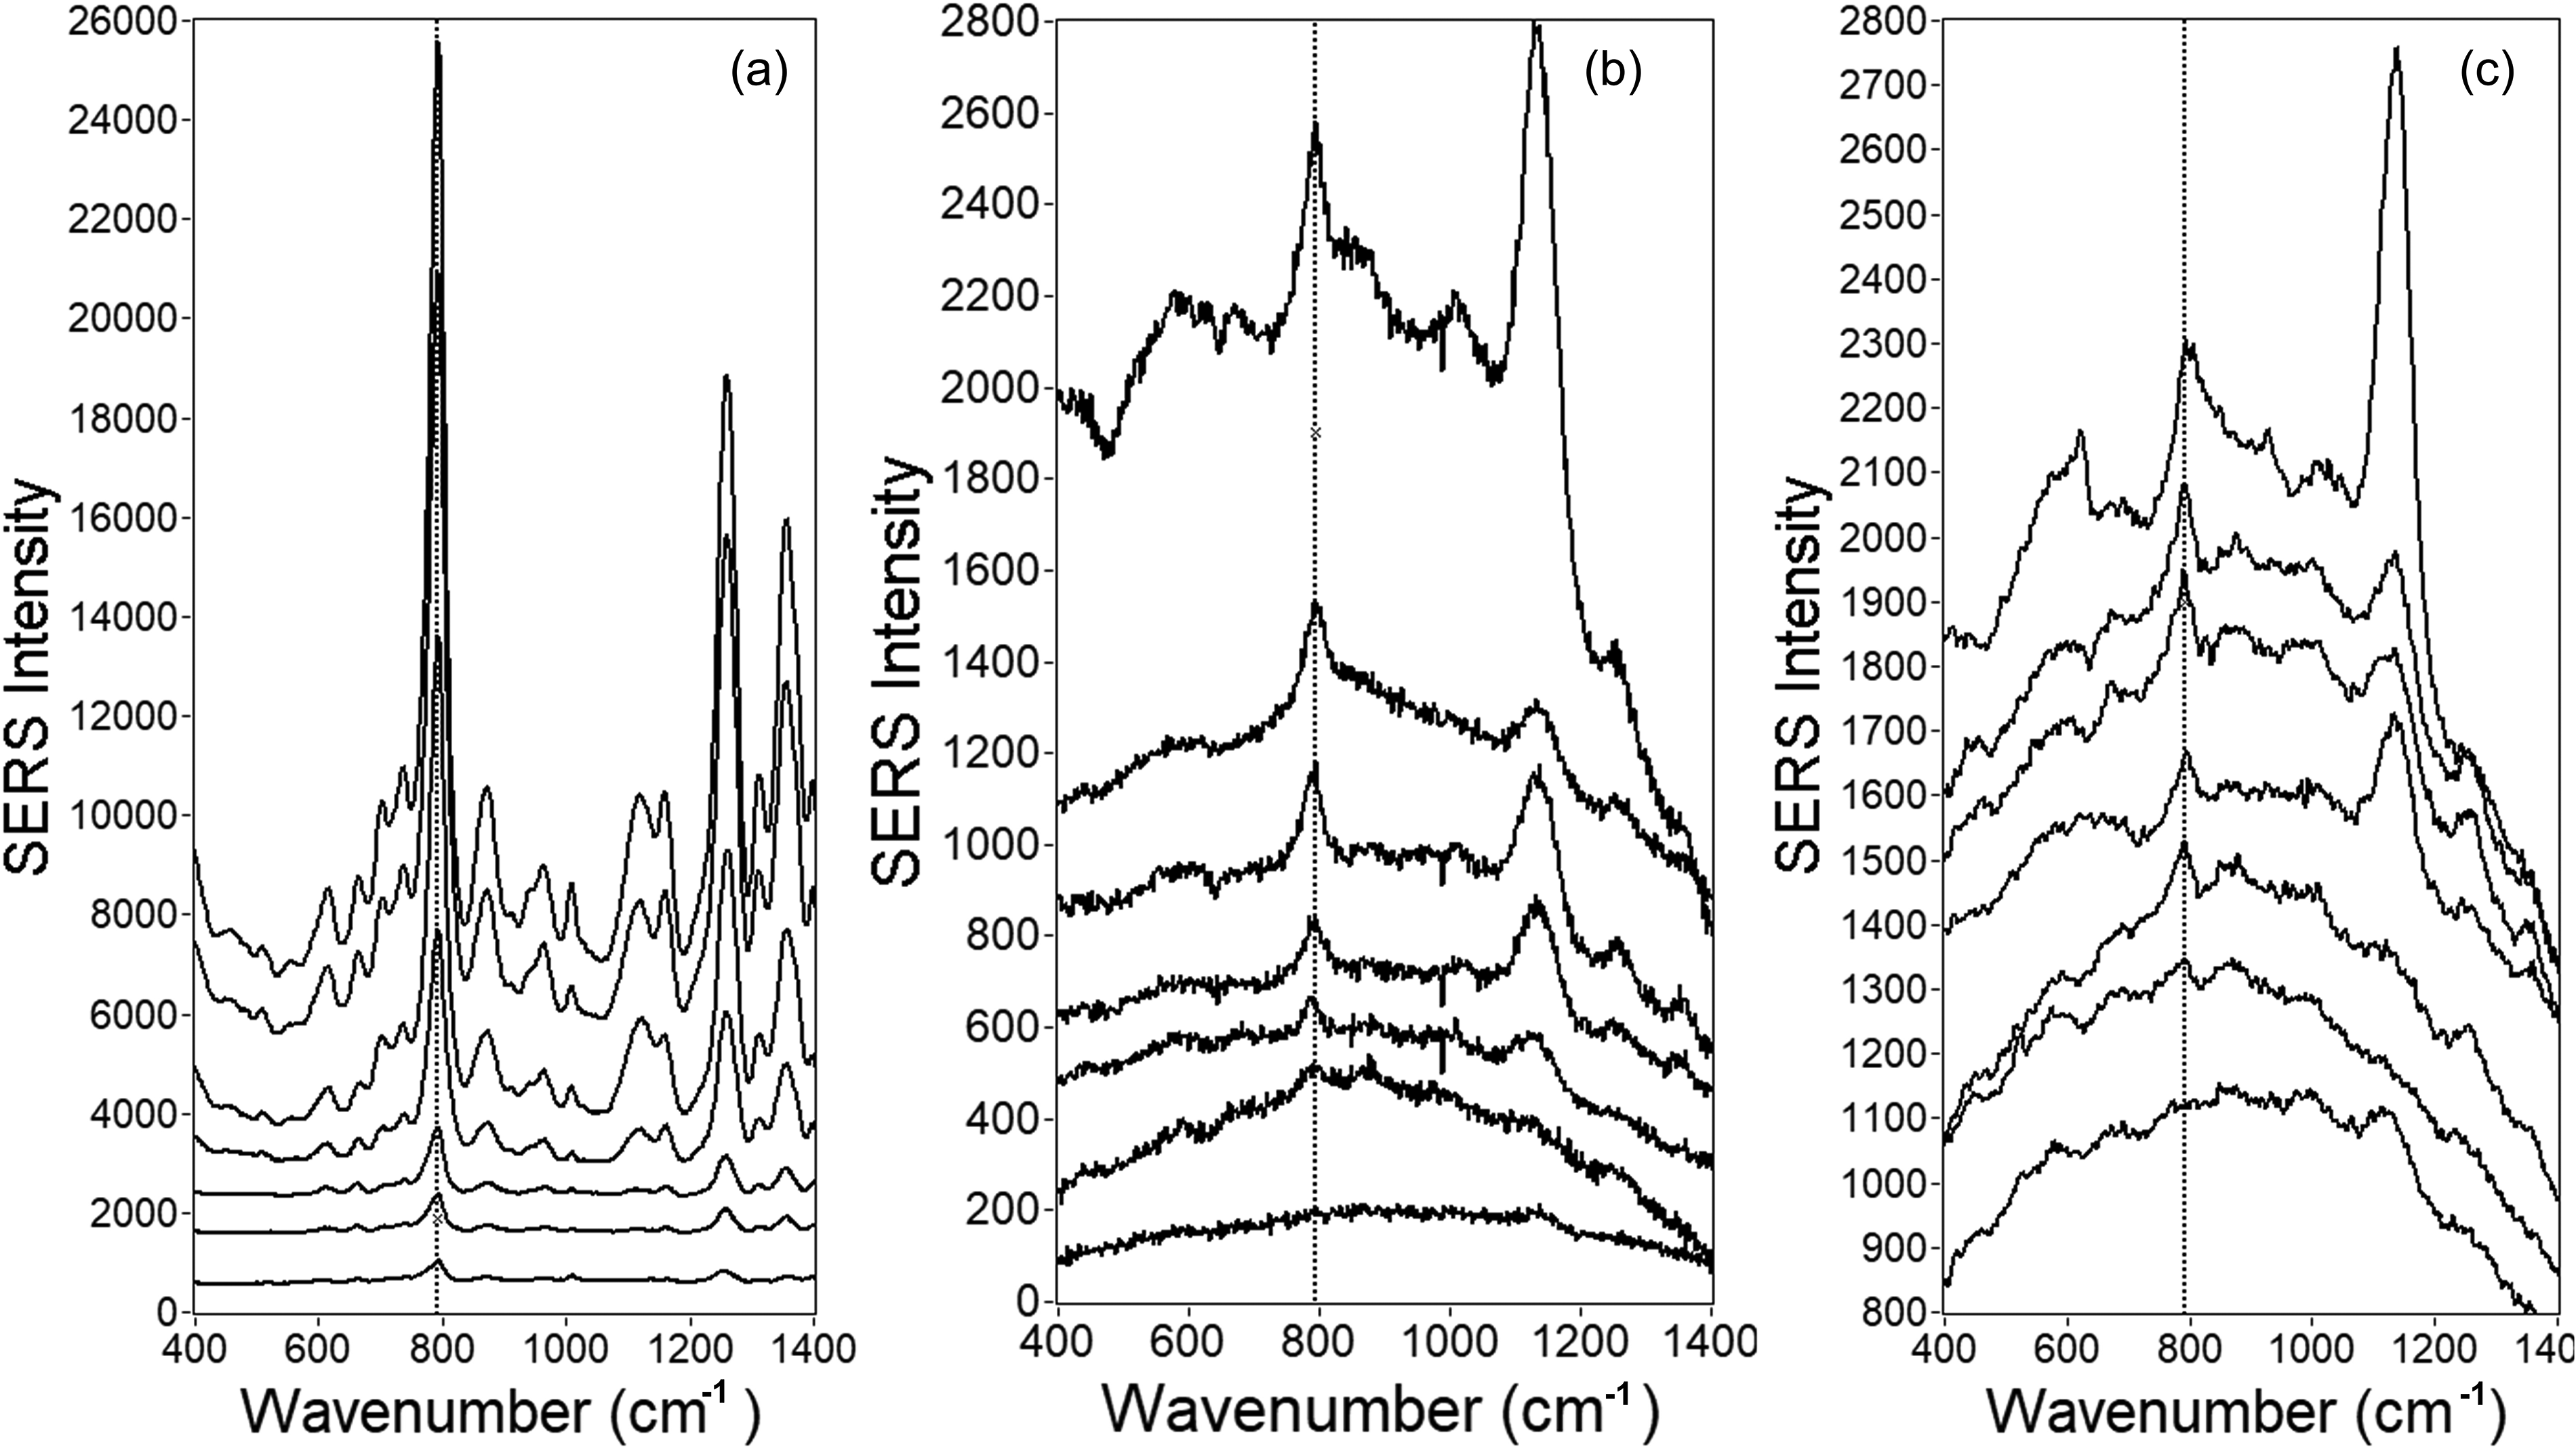
Selected individual emtricitabine spectra from a single well (a) 500 ng/mL, (b) 100 ng/mL, and (c) 40 ng/mL. Spectra are offset for clarity.

Histograms showing all spectral Qi values from one well (1800 spectra) for (a) 500 ng/mL, (b) 100 ng/mL, and (c) 40 ng/mL.
Since a majority of SERS spectra for each well correspond to little to no signal, taking the average of all 9000 spectra for five wells for each concentration to create a calibration curve would result in very low analytical sensitivity, i.e., the slope of the calibration curve would be small. However, using the Qi selection process, the 180 top spectra can be selected to create a calibration curve. This is depicted by the squares plotted in Figure 4. Due to a nonlinear trend observed across the entire concentration gradient, the data points were divided into two segments: a higher gradient in the concentration range from 500 to 200 ng/mL and a lower gradient in the concentration range from 100 to 0 ng/mL. Each segment was then fitted with a linear regression separately. Although the relationship is not linear across all concentrations, linear fits in the low- and high-concentration ranges (green and blue lines, respectively, in Figure 4) can be used as a guide for the analytical sensitivity. As shown, this calibration method results in much greater sensitivity at high concentrations. Also shown in Figure 4 are error bars at each concentration corresponding to five single well replicates (taking the top 180 spectra for each well). As observed, the variance is quite large at all concentrations, and in the low-concentration range adjacent error bars overlap. Although spatial selection of top SERS spectra improves sensitivity, calibration reproducibility is poor.

The emtricitabine calibration curve using the baseline corrected intensity of the peak at 794 cm–1. The spectra used for the calibration are the average of the top 10% Qi-ranked spectra from five wells (10% out of 9000 spectra). Error bars correspond to five replicate wells at each concentration. The blue line and green line correspond to linear fits in the concentration range of 500–200 and 100–0 ng/mL, respectively. Statistics are summarized in Table S1 (Supplemental Material).
As an alternative calibration approach, the CDF was calculated for the same data set shown in Figures 1–4, and the results are given in Figure 5. As shown, each curve is a CDF for each concentration, where the y-axis reflects the cumulative probability (ranging from 0 to 1) that at a certain Qi value, all possible Qi values within the distribution are being represented. The Qi values for the CDFs are plotted as log values since they span eight orders of magnitude. For these CDF plots, only non-zero Qi spectra were included in the distribution. In Figure 5a, CDF as a function of FTC concentration in the 0 to 1 probability range is shown. As expected, the highest concentration (gray curve, 500 ng/mL) has a distribution that is shifted to higher Qi values, while the lower concentrations exhibit distributions that are progressively shifted to lower Qi values, with the blank (blue curve) shifted to the lowest Qi values. In the case of the blank, the non-zero Qi values forming the distribution are a result of random noise in the spectra. Plotted in Figure 5b is a selected section of each CDF curve corresponding to the probability range of 0.75–0.96. This is a selected range where all CDFs are well separated across the range.

Cumulative distribution functions (CDFs) as a function of emtricitabine concentration in the probability range (a) 0–1 and (b) 0.75–0.96.
There are several ways to use the CDFs to create calibration curves. We chose to simply take the point-by-point difference between an individual CDF curve and the remaining CDF curves and sum all the differences to yield a single number. Since there are different numbers of points in each distribution, a spline was used to obtain point-to-point correspondence without distorting the CDFs. The resulting calibration curves are shown in Figure 6. The calibration curves using the full probability range (0–1) are shown in Figures 6a and 6b. In Figure 6a, the CDF calibration (constructed using five wells) corresponds to the squares, and the dots at each concentration correspond to the range of values for five replicates using CDFs constructed from single wells. Figure 6b is the identical calibration as Figure 6a, but the dots at each concentration correspond to the range of values for five replicates, each using CDFs constructed using combined spectra from four wells. As observed for all concentrations, the inclusion of more spectra from more wells in the replicates results in a significant decrease in the variance of the replicates compared to a common model constructed using five wells. SD values were calculated for each concentration from Figure 6 and summarized in Table S1 (Supplemental Material). The values of SD calculated based on the data shown in Figure 6b increased for all concentrations in comparison to SD values in Figure 6a. The same trend is true for SD values calculated for data in Figures 6c and 6d. Comparing calibration curves in Figures 6a and 6b, the spread is noticeably reduced, which shows the advantage of adding more spectra from more wells in the replicates. This is also true for the spread in the calibration curves in Figures 6c and 6d. The same trend is visible comparing calibration curves Figures 6a and 6c, when the selected probability range leads to a reduction of the spread.

Calibration curves (squares) constructed using CDFs. (a) Probability range 0–1 where black dots correspond to five predictions from five single well replicate CDFs at each concentration, (b) probability range 0–1 where black dots correspond to five predictions from five quadruple well replicate CDFs at each concentration, (c) probability range 0.75–0.96 (shown in Figure 5b, where black dots correspond to five predictions from five single well replicate CDFs at each concentration, (d) probability range 0.75–0.96, where black dots correspond to five predictions from five quadruple well replicate CDFs at each concentration. Statistics are summarized in Table S1 (Supplemental Material).
Although a linear trend is plotted for the data in the calibration curves shown in Figure 6, two areas are apparent for higher (from 200 to 500 ng/mL) and lower (from 0 to 100 ng/mL) concentration gradients. A similar but more evident trend was observed in Figure 4 using the top 10% averaged spectra instead of the CDF error function. For a better comparison of the calibration curves from Figures 4 and 6, a normalization formula, Eq. 3, was used, where ynormalized value is the normalized value, y represents the raw value which needs to be normalized, ymin and ymax are minimal and maximal values from the data set, which needs to be normalized.


The comparison of two different approaches for building a calibration curve by employing the normalizing formula from Eq. 3. (a) Calibration curves in the whole concentration range built based on the intensity of the SERS peak at 794 cm–1 with respect to the baseline for the top 10% of spectra ranked based on the Qi approach (blue), the CDF approach in probability range 0–1 from five quadruple well replicate CDFs (green), the CDF approach in the probability range 0.75–0.96 from five quadruple well replicate CDFs (orange). (b) Calibration curves in the selected concentration range (0–100 ng/mL), (c) calibration curves in the selected concentration range (200–500 ng/mL). The linear fits are summarized in Table S1 (Supplemental Material).
Figure 7b shows the calibration curves in the lower concentration range, where the difference of the slopes is crucially different. While the slope for Qi is 0.0002, the slopes for CDF calibration curves acquire values of 0.003 and 0.0033, more than an order of magnitude higher. Indeed, the CDF approach significantly improves the analytical sensitivity for the lower concentration range and significantly decreases the variance for the higher concentration range. Interestingly, if the highest concentration is excluded in calculating the linear trend for the CDF high concentration range in Figure 7c, the analytical sensitivity of the CDF approach equals that of the Qi approach. It is plausible that this is due to a saturation of SERS active binding sites at concentrations approaching 500 ng/mL, resulting in a skew of the distribution (Figure S5, Supplemental Material, shows a calibration curve in a concentration gradient from 800 to 0 ng/mL, where the saturation of SERS active binding sites at concentrations 500, 600, 700, and 800 ng/mL is seen as the calibration curve plateaus).
Although only the top 10% of the Qi values were employed to build the calibration curve (blue plots in Figure 7c), the spread is greater, and the values are overlapped compared to calibration curves obtained by using the CDF approach across the higher concentration range. In contrast, the spatial selection of the top 10% of SERS spectra based on the Qi values improves analytical sensitivity in the higher concentration range (shown in Figure 7c) as reflected by the slopes of the plots. The slope of the linear fit is 0.0024 for the Qi plot and 0.0017 for the CDF plot in the high-concentration range.
The limit of detection (LOD) and limit of quantification (LOQ) were calculated to compare two different approaches using calibration curves from Figures 4 and 6 (Table S3, Supplemental Material, summarized LODs and LOQ values for both used approaches). The LOD and LOQ using the Qi approach are 31.6 and 142.2 ng/mL, respectively. The LODs and LOQs using the CDF built from five single well replicate gains higher values in the whole and even in the selected probability range, nevertheless, when a quadruple well replicate was utilized, the LODs and LOQs values significantly decreased to 22.2 and 74.1 ng/mL for the whole probability range and to 18.7 and 63.3 ng/mL for the selected probability range.
Figure 8 shows the number of non-zero Qi values for each concentration, where each square represents one individual well. As can be clearly seen, the number of non-zero Qi values decreases significantly for lower concentrations, but not for higher concentrations. It can also be observed that there is a large degree of variance in the number of non-zero Qi values even for a given concentration. For lower concentrations, the spread is greater, showing there are fewer spectra with great Qi and many with low or no Qi value (e.g., very weak or no valuable SERS intensity). For wells with low concentrations of emtricitabine, the number of spectra with Qi values equal to zero is greater than the number of spectra with non-zero Qi values. Significantly, the only concentration with no zero Qi values is the highest concentration, 500 ng/mL. This supports the hypothesis stated above that analytical sensitivity for the CDF approach is limited near 500 ng/mL due to a saturation of SERS active binding sites (Figure S5, Supplemental Material). In addition, Figure 8 indicates that at low concentrations, a significant amount of spectral acquisition scanning time is spent collecting spectra with a Qi equal to zero. Thus, it is reasonable to suspect that for these concentration ranges, the acquisition time of the data could be significantly improved by using a lower spatial resolution raster pattern to identify regions of non-zero Qi prior to a full-resolution scan. It is also reasonable to suspect that greater spatial resolution (i.e., <30 μm) would improve the high-concentration limit on the analytical sensitivity of the CDF approach. Both of these hypotheses are currently being investigated.

Plot displaying the number of non-zero Qi values for all concentrations.
Conclusion
This work involved the quantification of aqueous solutions of the HIV drug emtricitabine (FTC) by adding a defined volume of simply prepared Ag CNPs and evaporating the resulting solutions to dryness on an aluminum well plate. The use of ETD to create an aggregated solid provides a way to greatly enhance the SERS signal by forcing aggregation and eliminating surface/solution equilibria, but also results in a large degree of spatial heterogeneity with regard to SERS enhancement. In a classic SERS experiment, an average of SERS intensity is typically collected as a function of time and spatial position, resulting in a composite spectrum from a range of SERS enhancement levels. However, in this work, spatially resolved SERS was used to collect the full range of spectral enhancements ranging from spectra with very large SERS enhancement to those with no or little SERS enhancement. Using this data, two approaches were used to improve analytical performance over the classic SERS approach. One approach used the previously published method, 51 used a quality index to screen out spectra with low enhancement factors and used only the intense spectra to enhance the analytical sensitivity. The second approach 48 is novel for the emtricitabine and is based on using the distribution of all acquired spectra to calculate a CDF to use for calibration. In all cases except for the highest analyte concentration (500 ng/mL), the CDF approach resulted in higher analytical sensitivity and better reproducibility. Significantly, in the low concentration range, the enhancement in analytical sensitivity is greater than an order of magnitude.
It is reasonable to expect that in the high-concentration limit, a higher analytical sensitivity can be achieved by increasing the number of spatially resolved spectra collected until a full distribution of Qi values is obtained, which would be represented by several of the collected spectra reaching the noise limit of Qi = 0. A simple way of achieving this would be to either increase the spatial resolution or the coverage area of the raster scan. This approach is currently under investigation.
The achieving of higher sensitivity and better reproducibility by using the CDF approach is important for the detection of the HIV drug emtricitabine from biological samples (blood plasma, blood, urine, etc.). Due to a selection of an arbitrary peak or peaks of the analyzed sample for the CDF analysis, the other peaks from the complex biological samples did not influence the analysis. If any background peaks are present in the spectral region of the analyzed peak or peaks, the CDF analysis could work for the detection if a blank sample without the analyzed sample is known. The quantification would not be so accurate since the background peaks of complex biological samples usually vary from sample to sample. However, employing the multivariant spectral analysis of a single peak of analytes would represent a simple approach.
The spatially resolved scanning of large areas of samples is time-consuming. However, the scanning device is computer-controlled and the acquisition of all spectra from all wells is automatized, which allows the spectral acquisition of large data sets without any assistance (therefore the acquisition of all of the data was performed overnight). Hence, the acquisition is much easier and faster than could be done by conventional quantitative analytical platforms. Nevertheless, the total time of scanning could be dramatically decreased by reducing the amount of time scanning large areas where Qi = 0, which is significant for lower concentrations. A reasonable approach is to include a rapid low spatial-resolution pre-scan to identify regions of SERS active aggregates and then to concentrate data acquisition centered on these areas and to an adjacent limit of Qi = 0 to obtain representative distributions. This approach is currently under investigation.
Supplemental Material
sj-docx-1-app-10.1177_27551857241235972 - Supplemental material for Cumulative Distribution Function and Spatially Resolved Surface-Enhanced Raman Spectroscopy for the Quantitative Analysis of Emtricitabine
Supplemental material, sj-docx-1-app-10.1177_27551857241235972 for Cumulative Distribution Function and Spatially Resolved Surface-Enhanced Raman Spectroscopy for the Quantitative Analysis of Emtricitabine by Jana Hrncirova, Marguerite R. Butler, Sucharita Dutta, Meredith R. Clark and John B. Cooper in Applied Spectroscopy Practica
Footnotes
Data Availability
Data presented in this article are available on request from the corresponding author.
Declaration of Conflicting Interests
The authors declared no potential conflicts of interest with respect to the research, authorship, and/or publication of this article.
Funding
The authors disclosed receipt of the following financial support for the research, authorship, and/or publication of this article: This work was funded by sub-award ENS-20-001 from CONRAD/EVMS under Project Engage, a cooperative agreement (7200AA20CA00030) between the U.S. Agency for International Development (USAID) and EVMS funded by U.S. President's Emergency Plan for AIDS Relief (PEPFAR). The views of the authors do not necessarily reflect those of the funding agency, PEPFAR, or the U.S. Government.
Supplemental Material
All supplemental material mentioned in the text is available in the online version of the journal.
References
Supplementary Material
Please find the following supplemental material available below.
For Open Access articles published under a Creative Commons License, all supplemental material carries the same license as the article it is associated with.
For non-Open Access articles published, all supplemental material carries a non-exclusive license, and permission requests for re-use of supplemental material or any part of supplemental material shall be sent directly to the copyright owner as specified in the copyright notice associated with the article.