
Abstract
In the present work, we report a practical fabrication method of gold-aluminium substrates for surface enhanced Raman spectroscopy. A commercial aluminium-foil was used to fabricate SERS substrates by depositing gold nanocuboids and faceted particles onto their surfaces using the drop-drying method. The gold nanoparticles were characterized by ultraviolet-visible spectroscopy, while the size and morphology were determined by field emission scanning electron microscopy. The performance of the substrates was investigated using Rhodamine 6G in a water solution where a volume of 3 μl was placed on the surfaces of the SERS substrates, and the Raman spectra were immediately acquired using diode laser excitation at 785 nm. The estimated analytical enhancement factor of the gold-aluminium substrates was 1.8 × 10⁶, using a solution of Rhodamine 6G with a concentration of 1 × 10⁹ (0.4796 ppb). We show that our SERS substrates can be easily fabricated, and that they are reproducible and have suitable surface uniformity, thus allowing one to analyse Rhodamine 6G not only as a dry sample, but also in a solution.
1. Introduction
The development of active substrates using noble metal nanoparticles (NPs) for surface-enhanced Raman spectroscopy (SERS) is an important topic in the detection and characterization of chemical species at the single-molecule level of detection. Currently, the main applications of SERS substrates are focused on the fields of medicine, biology, homeland security, environmental pollution and food contamination. Every day, the applicability of SERS grows due to the development of new equipment with affordable prices, as well as to the continuous novel design and fabrication of robust SERS substrates. In recent years, diverse methods have been reported for the development of these optical sensors with high enhancement factors (EF): electron beam lithography [1], focused-ion beam nanofabrication [2], layer by layer [3], nanoimprinting lithography [4], and NPs self-assembly [5, 6]. Substrates with a high EF open the possibility of carrying out applications at the single-molecule level of detection [7, 8], which is possible through the formation of hot spots; the so-called hot spots are formed at interparticle gaps of ≤10nm. For example, lithographic methods and soft lithographic methods have been used to produce regular arrays in order to generate substrates with good reproducibility and high uniformity, but their main problem is their high cost of production, long time of preparation, and the requirement of expensive equipment for the process [9].
By providing simple and reliable methods to fabricate SERS substrates, many scientific, medical and technological fields may be favoured, especially those where the detection of markers and bio-markers are still a challenge when using standard techniques. Ultimately, the final goal of the design of SERS substrates is addressing the improvement of the detection of analytes, either at the single molecule level of detection or at slightly lower sensitivities, but always keeping in mind that repeatability and good uniformity of the substrate are very important factors in their design. On the other hand, the use of colloids which are deposited on prepared solid surfaces by means of drop-casting, immersion, self-assembly, aggregation, dimmers or core satellite formation offers better enhancement factors; different reports have shown that these methods have good efficiency in the formation of hot spots [10], but it is well known that the use of colloidal NPs for the fabrication of reproducible SERS substrates with large uniform hot spot areas remains a big challenge. For all these reasons, the design and fabrication of solid SERS substrates is still a hot area of research.
Another important factor for good performance of a SERS substrate is the sample preparation on the surface of the SERS substrate. Several methods have been proposed to control the adsorption of the chemical species, such as immersing the SERS substrate in the analyte solution for a period of time and then removing and washing it for the analysis [1, 11, 3], depositing a droplet of the analyte on the surface of the substrate and acquiring the spectrum after the drop has dried [8, 12, 13, 14, 15], mixing the analyte with colloidal NPs into a solution with a certain volume of the sample at a defined concentration, and then absorbing it into a capillary glass tube for the analysis [16], or through drop-casting [17]. There are not many reports showing the SERS analysis of a sample in a solution; for instance, Cheng et al. achieved the detection of a bacteria biomarker using a droplet of dipicolinic acid solution, and placing it directly on the surface of the substrate [18]. The last preparation method has several advantages over the others, especially when samples are to be measured in real time, avoiding thermal and ambient degradation, or when samples should only be analysed under wet conditions to maintain their original biochemical properties.
In this paper, we report a facile fabrication of SERS substrates using a simple drop-drying method: one drop of colloidal Au NPs is placed onto the Al-foil, and water is eliminated by evaporation at room temperature, obtaining NP aggregates with an interparticle gap of about 10 nm without any special treatment of the Al surface. Au concave and faceted NPs were prepared by means of a modified seed-mediated growth approach [19], and the SERS substrates were tested using Rhodamine 6G (R6G) in a water solution.
2. Experimental
2.1 Chemical materials
Gold (III) chloride trihydrate (HAuCl4·3H2O), sodium borohydride (NaBH4), cetyltrimethylammonium chloride (CTAC), silver nitrate (AgNO3), hydrochloric acid (HCl), and ascorbic acid (C6H8O6) were purchased from Sigma-Aldrich. Water was purified via a Millipore system. Milli-Q ultrapure water (resistance>18.2 MΩcm) was used throughout the experiments, and R6G (Sigma-Aldrich, 95 %) served as analyte to test the SERS substrates. All chemicals were used without further purification, and all solutions were freshly prepared on a daily basis.
2.2 Gold nanostructure synthesis
In a typical synthesis, seeds were prepared in the following way: 125 μl of HAuCl4 (10 mM) were added to 5 ml of CTAC solution (0.1 M), and to initiate the seed growth, 300 μl of freshly prepared ice-cold NaBH4 solution (10 mM) were added under continuous stirring and kept so for 2 minutes to finally be left undisturbed for 2 h. A growth solution was prepared by consecutively adding 5 ml of CTAC (0.1 M), 250 μl of HAuCl4 (10 mM), 50 μl of AgNO3 (10 mM), 100 μl of HCl (1 M), and 50 μl of ascorbic acid (0.1 M). To initiate the growth of the NPs, 20 μl of seed solution diluted 1:10 were added to the growth solution, and kept under stirring for a couple of minutes, and then were left undisturbed for 12 hours, until the reaction was complete.
2.3 SERS Substrate and sample preparation
Glass slides were covered with commercial Al-foil, 25 μm in thickness, and cleaned twice in an ultrasonic bath with ethanol for 10 minutes. After ultrasonic cleansing had been carried out, the Al-foil was dried with clean air at room temperature. For the preparation of Au NPs assemblies onto the substrate, the colloid of Au NPs was washed using the following process: 6 ml of the colloid were centrifuged at 3500 rpm for 30 min, and after this the supernatant was withdrawn and the precipitate was redispersed in Milli-Q water; this step was repeated five times, and in the last centrifugation, the precipitate was redispersed in 1 ml of water. A droplet of the concentrated Au NPs (3 μl) was placed onto the Al surface until the water was evaporated at room ambient conditions (see Fig. 1a, b). To test the SERS substrates, a stock solution of R6G was prepared in methanol at 0.05 M and kept in the dark to avoid any photobleaching. After that, a set of samples were prepared by diluting the stock solution in water, obtaining the final concentrations of 1×10⁻³ M (479.6 ppm), 1×10⁻⁶ M (479.6 ppb), 1×10⁻⁷ M (47.96 ppb), 1×10⁻⁸ M (4.796 ppb) and 1×10⁻⁹ M (0.4796 ppb).

Schematic illustration of the nanostructured substrate formation, and analyte detection as liquid sample. (a) Sessile droplet for free evaporation, (b) NPs deposited onto Al-foil, (c) R6G as liquid onto nanostructured substrate ready to measure
3. Characterization
Ultraviolet-Visible (UV-Vis) absorption spectra of Au NPs suspended in water were recorded on a miniature StellarNet spectrometer EPP2000 in the wavelength range from 300 to 860 nm. The reflectance spectra of the Al-foil/Au-NPs substrates were recorded using a bifurcate optical fibre, and their corresponding absorbance spectra were calculated. Particle size and morphology were evaluated using a field emission scanning electron microscope (FE-SEM, JEOL JSM-7600F). SERS spectra were recorded by means of a Renishaw InVia microscope Raman spectrometer. Raman measurements were acquired with an excitation line provided by a diode laser at 785 nm, by means of a 20x microscope objective with a 0.4 numerical aperture; the laser power focused on samples was 4 mW, 2 s of integration time, and 20 accumulations were selected.
4. Results and discussion
Figure 2a shows the normalized UV-Vis absorbance spectrum of the colloidal Au NPs (black line), in which the SPR band is observed at 557 nm. As previously mentioned, before the metallic colloid on the substrates was deposited, the NPs were washed several times to reduce the excess of surfactant and so diminish its contribution to Raman signal; the enhanced signal mostly comes from the analyte of interest. The UV-Vis absorbance spectra of cleaned NPs redispersed in water and deposited on the surface of Al were recorded respectively (see section 3). In the case of the NPs that were cleaned and then redispersed in water, the SPR band is still located at the same wavelength of those which were not cleaned (see the red line spectra), with the peak preserving the same spectral behaviour, but in the case of NPs on the substrate, the SPR band is redshifted approximately 55 nm, and the peak became broader, going from 630 nm to 800 nm (see the spectrum in blue of Fig. 2a). The most likely explanation is the change of interparticle distance; when water evaporates, the local concentration of NPs is increased and aggregation happens, but also nanoparticles in the aggregates are distributed in a random orientation, and this random orientation causes the red shift of the plasmon band. An optical image of the colloid drop-drying on the Al-foil substrate is shown in Fig. 2b. It shows the formation of a dense Au NPs ring-like array deposited along the perimeter, but inside the ring, we appreciate many clusters distributed along the area; a zoom of the inside is shown in Fig. 2c. The ring diameter of the deposited colloid is around 2.4 mm, which is enough for the SERS sensing area to measure the analyte in solution. Figure 3 shows the SEM image of the Au nanostructured substrate prepared through the drop-drying method. As can be observed, the image shows anisotropic Au concave nanocuboids and faceted NPs. It was statistically determined that 44% corresponded to cuboids with 26.6 ± 4 nm in width and 39.5 ± 7 nm in length, and the rest to faceted NPs averaging a size of 39.9 ± 10.5 nm. The interparticle distance of the NP distribution on the substrate has an average value of 9 ± 4 nm.

(a) UV-Vis extinction spectra of the colloidal Au NPs as synthesized (black line), after five times washings (red line) and as nanostructured substrate (blue line). Optical image of the NPs deposited on Al substrate with (b) 5x objective and (c) 100x objective

EF-SEM picture of the Au NPs distributed on the Al-foil substrate.
To evaluate the performance of our substrates, R6G was selected for the analysis and measured as a liquid using a small volume of 3 μl at given concentrations, as was described in section 2.3. First, we explored the substrate in the central region of the drop and in the coffee ring zone by acquiring five points in each case, noticing that the signal showed better enhancement in the coffee ring zone; however, the relative standard deviation (RSD%) on the mean intensity was 45%. On the other hand, the central area of the drop exhibited lower signal enhancement, but this zone also displayed a lower RSD%. After that, SERS spectra data were acquired around the central part of the drop for all substrates.
Figure 4 shows the characteristic average and baseline corrected SERS spectra, where Fig. 4a shows the Raman spectra of R6G using Al-foil substrate without NPs, 1×10⁻³M (479.6 ppm), which corresponds to the minimum detected concentration. Fig. 4b shows the SERS spectra using the Al-foil substrate with NPs; the lowest detected concentration was 1×10⁻⁹ M (0.4796 ppb), and our calculations showed that the maximum analytical enhancement factor (AEF) was (1.8 ± 0.9)×106 using the peak at 1509cm−1. The AEF was calculated using the equation [20]:

(a) Raman spectrum of a droplet of R6G solution at 10−3 M on Al substrate, (b) SERS spectrum of R6G solution for different detected concentrations on Al-foil/Au-NPs, and Au-glass.

where CRS and CSERS are the concentrations detected for non-SERS and SERS activity, respectively. IRS is the Raman intensity produced for a concentration under non-SERS condition, and ISERS is the Raman intensity for a concentration under SERS substrate activity.
The reproducibility of our results was confirmed by preparing three different sets of substrates at different times, all of them prepared under the same experimental conditions. In all cases, the minimum detected concentration was determined by testing a set of R6G concentrations going from 1×10⁻⁶ to 1×10⁻¹⁰ M, being 1×10⁻⁹ M the minimum detected concentration. The RSD% among the three different slides on the mean SERS intensities using R6G at 1×10⁻⁹ M was less than 20% (see supporting information). Figure 4b shows the corresponding average SERS spectra acquired for this concentration of each substrate.
On the other hand, Fig. 5 shows the behaviour of the Raman peak height at 1509 cm −1 versus the R6G concentration. A linear correlation in logarithmic scale was observed from 10−3 to 10−9 M, where the SERS signal increases as the concentration of R6G increases. In the same figure, the error of the peak height is shown, and the error bars were calculated from the standard deviation of the SERS intensity at 1509cm−1 by using the spectra acquired at five random points. The distance between two adjacent points was around 10 μm.

SERS signal (log(Intensity)) at 1509cm−1 as a function of the molecular concentration on a logarithmic scale for one droplet of concentrated Au NPs on the Al-foil substrate.
Besides, functionalized glass substrates with amine and thiol groups were prepared using a silanization process, and nanocuboids were deposited with the drop-casting method [21]. Figure 4b shows the mean spectra of the SERS spectra of R6G (1×10⁻⁴ M); the spectra were obtained under the same experimental conditions we used in the case of Al-foil/Au NPs substrates. The SERS signal from Au-glass substrates was not as good as in the case of Al-foil. The colloidal nanoparticles deposited on glass by drop-casting did not have the same hydrophobicity of the Al-foil substrate; thus, the degree of aggregation of the nanoparticles was very low (see supporting information). The main consequence was that the laser light was reflected from both surfaces of the slide and still reached the microscope objective with a strong intensity, and only a broad fluorescence band that overlapped the SERS signal was observed.
The calculated average value of the AEF confirms that the SERS activity of our substrates came from the electromagnetic enhancement produced by the aggregation of the NPs, but mainly by the two adjacent NPs, which produced an enhancement of the local electric field of the localized SPR band. It has been reported that substrates with nanostructures deposited on the surface with gaps around 10 nm produce strong SERS activity. For instance, Wang et al. showed that using Au spheres of 50 nm coated with CTAB, they were able to fabricate highly ordered Au spherical NPs arrays with sub-10 nm spacing between adjacent NPs [22]. Related with the gap between NPs, Liu et al. used Au octahedral NPs with a mean edge length of 42 nm to create nanostructured substrates with an average interparticle distance of 6 ± 2 nm to produce strong SERS activity [5]; also, Au mesoflower arrays of high reproducibility were used with sub-10 nm interparticle gaps [23].
In our case, compact aggregates of cuboids and faceted particles were deposited on the surface of Al substrates (see Fig. 3), with an interparticle gap of 9 nm. This result is very interesting because we did not perform any sophisticated treatment onto the surface of the Al-foil to produce substrates with a good sensitivity limit of detection (1×10⁻⁹ M).
Our SERS substrates prepared using one droplet showed good repeatability and uniformity on the Al-foil surface. However, in order to validate the results and verify that one droplet optimizes the maximum AEF of this methodology, SERS substrates were fabricated with one, two and three-drop deposits. Fabrication was done in the following way: first, 3 μl of Au colloid were deposited on the Al substrate, and after water was completely evaporated at room temperature a new droplet was deposited onto the same area of the previous one. This procedure was carried out until the right number of deposits was obtained. In all cases, we used the same volume per drop (3 μl) and the same absorbance value of the colloid. To evaluate the substrates with different numbers of droplets, they were tested using R6G at 1×10⁻⁹ M.
Figure 6 shows the statistical analysis of the peak height at 1509cm−1 as a function of the number of droplets deposited on the Al-foil substrate. The signals for one, two and three droplets exhibit small changes in the mean intensity of the SERS signal, and the error bars show that there is no significant difference between them. For this reason, we decided to conduct the entire study using the substrates fabricated with one drop, which are easier and faster to prepare than those with two or three drops.
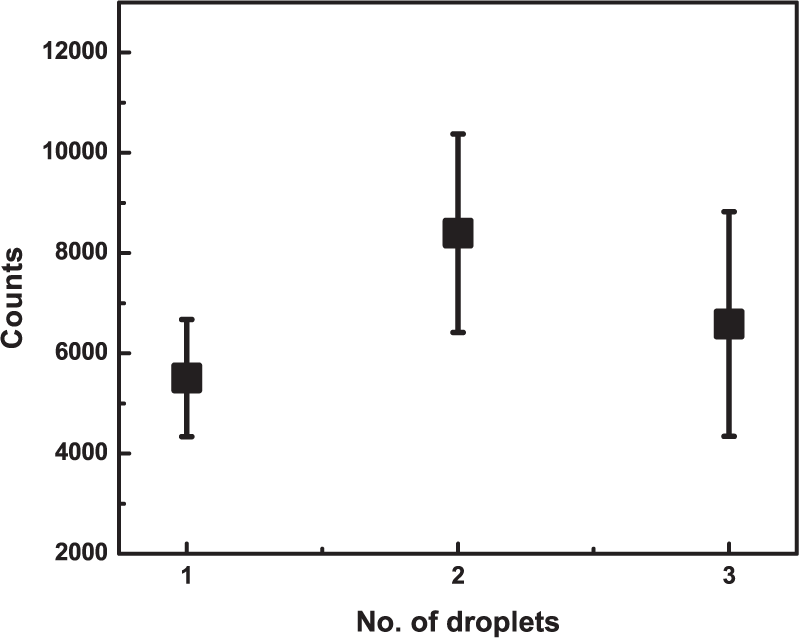
SERS signal of R6G at 1509cm−1 as a function of number of droplets of Au colloidal NPs on the Al-foil
The protocol proposed for SERS substrate fabrication is versatile and easy to follow towards obtaining highly reproducible substrates with acceptable uniformity by means of a simple preparation procedure and at very low cost; it mainly allows the detection of R6G concentrations up to 1×10⁻⁹ M (0.4796 ppb). This is a good range of detection for applications of some prohibited substances; for instance, Liu et al. [14] showed that is possible to detect three types of pesticides in fruits through SERS coupled with Au nanostructures. The lowest detection level was 2 ppm, which represents a good limit of detection, because under these conditions they are able to reach the maximum residue limit established by the Food and Agriculture Organization of the Nations and World Health Organization. Another example of detection levels around 30 ppb is related to rapid and sensitive detection of melamine in milk with Au NPs by SERS, reported by Giovannozzi et al. [24]. Their method is suitable for melamine quantification in the concentration range of 0.57 to 5.0 mg/l (ppm) in a milk matrix, which is in accordance with the European legal limits of 1 mg/l (ppm) for infant dairy products and other food, and 2.5 mg/l (ppm) for animal feed.
Finally, it is important to mention that most of the literature has focused on the design of solid SERS substrates using glass, silicon wafer and quartz surfaces prepared by different methodologies. In all these cases, physical and chemical procedures need to be performed to prepare the surface of solid substrates and deposit the metal colloidal nanoparticles. In this work, Al-foil substrates are proposed as solid substrates because they offer intrinsic advantages over those materials, such as cost, since Al-foil is very cheap (9.0 m2 for 5.00 dollars) compared with silicon wafer (≈8.00 dollars per silicon wafer disc ∅ 0.254 m) and quartz (≈6.80 dollars per quartz disc, ∅ 0.254 m). Our protocol shows that Al-foil can be used without special treatments on its surface: we only cleaned it with ethanol or acetone in an ultrasonic bath to remove dust and carbon particles, and then we proceeded to coat it with gold colloidal nanoparticles. Moreover, the preparation of the Al-foil substrates is easy because it is not necessary to use special tools to cut it in order to obtain different sizes, as opposed to glass and quartz, for which special tools are required to make precision cuts without damaging the surface. Additionally, Al does not exhibit fluorescence (as it happens with glass) or Raman signal.
In this work, we have shown that our SERS substrates manufactured through a simple and easy preparation procedure have a performance at least similar to that of commercial substrates tested and reported in the literature [25, 26]. Currently, we are working on the applicability of our substrates in order to detect prohibited substances that could be in commercial products.
5. Conclusions
In summary, we have demonstrated the fabrication of a simple Au nanostructured substrate by means of a drop-drying method on Al-foil as a SERS substrate. Au concave gold nanocuboids with a mean size of 40 nm and an interparticle distance of 9 nm exhibited good SERS activity. The substrates were tested using R6G dissolved in water and detected as a solution. Our results show that R6G concentrations as low as 1×10⁻⁹ M (0.4796 ppb) can be accurately detected using the described SERS substrates. Our results open the possibility of preparing nanostructured substrates in an easy way and a highly reproducible form, useful for several applications where samples need to be analysed in a water solution.
Footnotes
6. Acknowledgements
This study was partially funded by Consejo Nacional de Ciencia y Tecnologia, Mexico under grant numbers 152971 and 164203. One of the authors, P. Martinez-Torres, is thankful for the 2013–2014 Consejo Nacional de Ciencia y Tecnologia national postdoctoral fellowship. Finally, we thank the reviewers for their valuable comments and suggestions.