
Abstract
Purpose
The aim of this study was to investigate the diagnostic accuracy of HER2 immunohistochemistry (IHC) in gastric carcinoma (GC) through a systematic review, meta-analysis and diagnostic test accuracy review.
Method
The current study included 12,679 GC cases and 181 subsets in 45 eligible studies. We performed concordance analysis between HER2 IHC and in situ hybridization (ISH) in GC. Diagnostic test accuracy was analyzed and the area under the curve (AUC) on the summary receiver operating characteristic (SROC) curve was calculated.
Results
HER2 amplification rates were 3.0%, 31.8%, and 93.0% in the IHC score 0/1+, 2+, and 3+ groups, respectively. The concordance rates between IHC and ISH were 0.969 (95% confidence interval [CI] 0.962-0.975), 0.393 (95% CI 0.331-0.458) and 0.915 (95% CI 0.882-0.939) in the HER2 IHC score 0/1+, 2+, and 3+ groups, respectively. For all the HER2 IHC score groups, the positive rates were higher in the silver ISH (SISH) subgroup than in the fluorescence ISH (FISH) and chromogenic ISH (CISH) subgroups. In diagnostic test accuracy review, the pooled sensitivity and specificity were 0.86 (95% CI 0.84-0.87) and 0.91 (95% CI 0.90-0.91). The AUC on SROC curve was 0.958. However, there was no significant difference in the values of AUC between the ISH methods.
Conclusions
Our results showed that HER2 IHC was well concordant with ISH in HER2 IHC score 0/1+ or 3+. Although this meta-analysis showed higher diagnostic accuracy of HER2 IHC, more detailed criteria for HER2 IHC score 2+ cases will be required to predict HER2 status.
Keywords
Introduction
Gastric carcinoma (GC) is a biologically and genetically heterogeneous tumor and one of the most common malignant tumors worldwide (1). In previous studies, several biological and molecular biomarkers have been introduced in GC. Among these markers, HER2 status is an important marker for the application of treatment modalities using the HER2 monoclonal antibody in GC (2). The HER2oncogene, also known as ERBB2 or neu, encodes a transmembrane receptor glycoprotein with tyrosine kinase activity. This protein is associated with adhesion, migration, and differentiation of tumor cells and is a well-known marker of poor prognosis in a variety of tumors (3). HER2 overexpression and/or gene amplification was found in 7%-34% of GC cases (4). A survival benefit from trastuzumab has been reported in patients with immunohistochemistry (IHC) 2+/in situ hybridization (ISH)+ or IHC 3+ (4). Therefore, the accurate evaluation of HER2 status is very important in the application of targeted HER2 monoclonal antibody therapy.
Diagnostic tests for the evaluation of HER2 status have used HER2 IHC and ISH in daily practice. For HER2 IHC score 2+ cases, an additional ISH should be conducted. Previous studies have reported the correlation between HER2 IHC and ISH (5-6-7-8-9-10-11-12-13-14-15-16-17-18-19-20-21-22-23-24-25-26-27-28-29-30-31-32-33-34-35-36-37-38-39-40-41-42-43-44-45-46-47-48-49). The studies used various IHC methods with different fixation, processing protocols, and antibody clones (5-6-7-8-9-10-11-12-13-14-15-16-17-18-19-20-21-22-23-24-25-26-27-28-29-30-31-32-33-34-35-36-37-38-39-40-41-42-43-44-45-46-47-48-49). In addition, HER2 IHC as an initial tool to evaluate HER2 status may show less agreement between pathologists in daily practice. However, whether these discrepancies influence diagnostic accuracy and concordance has not yet been fully elucidated. Cumulative studies or systematic reviews on these discrepancies are needed to elucidate the correlation between HER2 IHC and ISH.
In the present study, we performed a systematic review and meta-analysis in an attempt to investigate the concordance between HER2 IHC and ISH in GC. Subsequently, diagnostic test accuracy review was conducted for the diagnostic role of HER2 IHC in GC.
Materials and methods
Published Study Search and Selection Criteria
Relevant articles were obtained by searching the PubMed and MEDLINE databases through January 31, 2015. These databases were searched using the following keywords: “gastric carcinoma”, “HER2” or “HER-2”, “immunohistochemistry” and “in situ hybridization”. The titles and abstracts of all searched articles were screened for exclusion. Review articles were also screened to find additional eligible studies. The search results were then scanned according to the following inclusion and exclusion criteria: 1) HER2 status was investigated in human GC tissue; 2) the correlation between HER2 IHC and ISH was included; 3) case reports or non-original articles were excluded; and 4) all were English-language publications.
Data Extraction
Data from all eligible studies were extracted by 2 independent authors. The included data were extracted from each of the eligible studies (5-6-7-8-9-10-11-12-13-14-15-16-17-18-19-20-21-22-23-24-25-26-27-28-29-30-31-32-33-34-35-36-37-38-39-40-41-42-43-44-45-46-47-48-49): the first author's name, year of publication, antibody clone and manufacturer, study location, dilution ratio of antibody, cutoff value, number of patients analyzed, and ISH method. For meta-analysis, we extracted all data associated with IHC results (scores 0, 1+, 2+ and 3+) and ISH results (number of amplification and non-amplification).
Statistical Analysis
To perform the meta-analysis, all data were analyzed using the Comprehensive Meta-Analysis software package (Biostat, Englewood, NJ, USA). We investigated the rates of HER2-amplified cases according to HER2 IHC scores for meta-analysis. The concordance rates were measured by agreement rates between HER2 IHC and ISH. In addition, subgroup analyses based on ISH methods were performed. Heterogeneity between the studies was checked by the Q and I2 statistics and demonstrated as p values. Additionally, sensitivity analysis was conducted to assess the heterogeneity of eligible studies and the impact of each study on the combined effect. For the assessment of publication bias, Begg's funnel plot and Egger's test were used. If significant publication bias was found, the fail-safe N and trim-and-fill tests were additionally conducted to confirm the degree of publication bias. The results were considered statistically significant at p<0.05.
Diagnostic test accuracy review was carried out using the Meta-Disc program (version 1.4) (50). Forest plots and the summary receiver operating characteristic (SROC) curve were obtained. The area under the curve on SROC and the diagnostic odds ratio (OR) were calculated by the Meta-Disc program.
Results
Selection and Characteristics of the Studies
In this systematic review and meta-analysis, 461 reports were identified in the database search. Among them, 249 were excluded because of insufficient or no information on the correlation between HER2 IHC and ISH. In addition, 90 reports were excluded because they reported the results of nongastric cancer and other diseases, or used animals or cell lines, and 77 were excluded because they were non-English or non-original articles. Finally, 45 studies were included in this systematic review and meta-analysis (Fig. 1 and Tab. I). There were 181 subsets from 45 eligible studies in terms of separate counting of IHC scores, IHC antibodies, IHC scoring system, and ISH methods. The total number of patients was 12,679. Eligible studies used various manufacturers’ antibodies and ISH methods, as shown in Table I. The overall HER2-IHC-positive rate and HER2-ISH amplification rate were 20.4% and 14.6%, respectively.
Main characteristics of the eligible studies
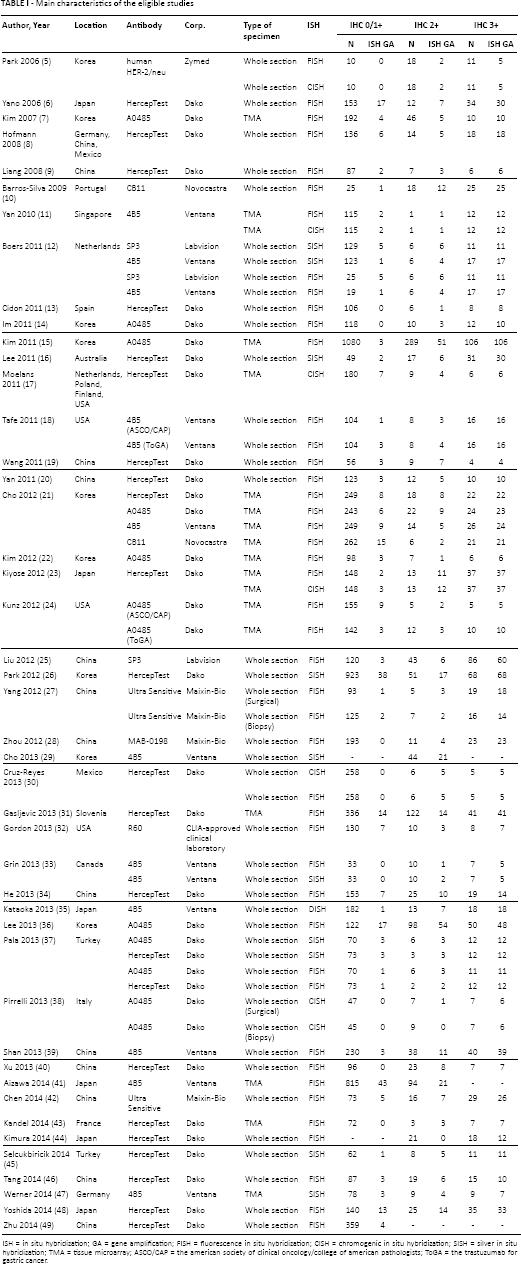
ISH = in situ hybridization; GA = gene amplification; FISH = fluorescence in situ hybridization; CISH = chromogenic in situ hybridization; SISH = silver in situ hybridization; TMA = tissue microarray; ASCO/CAP = the american society of clinical oncology/college of american pathologists; ToGA = the trastuzumab for gastric cancer.
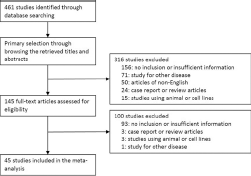
Flow chart of study search and selection methods.
Systematic Review and Meta-Analysis
Correlation between HER2 IHC and ISH
In 45 eligible studies, concordance analysis between HER2 IHC and ISH was conducted in 61, 60, and 60 subsets for the HER2 IHC score 0/1+, 2+, and 3+ groups. In the HER2 IHC score 0/1+ group, the concordance rates were 0.957 (95% confidence interval [CI] 0.952-0.962) and 0.969 (95% CI 0.962-0.975) in the fixed-effect and random-effect models, respectively (Tab. II). In the HER2 IHC score 2+ group, the concordance rates were 0.333 (95% CI 0.306-0.362) and 0.393 (95% CI 0.331-0.458) in the fixed-effect and random-effect models, respectively. For the HER2 IHC score 3+ group, the concordance rates were 0.855 (95% CI 0.825-0.880) and 0.915 (95% CI 0.882-0.939) in the fixed-effect and random-effect models, respectively. The HER2 score 0/1+, 2+, and 3+ groups showed significant heterogeneity (p<0.001, p<0.001, and p<0.001, respectively). Sensitivity analysis was conducted, and none of the eligible studies influenced the pooled concordance rate. The ranges of concordance rates in the sensitivity analysis were 0.969-0.970, 0.384-0.402, and 0.911-0.919 in the HER2 IHC score 0/1+, 2+, and 3+ groups, respectively. For the assessment of publication bias, we used Begg's funnel plot and Egger's test. In Egger's test, significant publication biases were identified in the IHC score 0/1+, 2+ and 3+ groups (p<0.001, p = 0.006, and p<0.001, respectively), and asymmetry was identified in Begg's funnel plots. The fail-safe N and trim-and-fill tests were additionally conducted to confirm the degree of publication bias. However, publication biases were not significant in the fail-safe N test or the trim-and-fill test.
Concordance analysis between HER2 immunohistochemistry and in situ hybridization
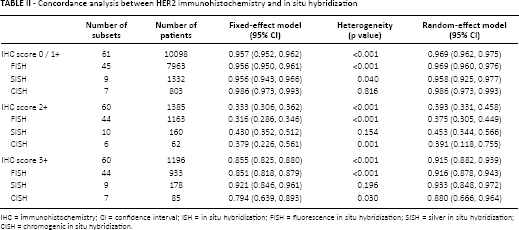
IHC = immunohistochemistry; CI = confidence interval; ISH = in situ hybridization; FISH = fluorescence in situ hybridization; SISH = silver in situ hybridization; CISH = chromogenic in situ hybridization.
Subgroup Analysis
We performed subgroup analysis to evaluate the low concordance rate of the HER2 IHC score 2+ group. Eligible studies in the study groups were subdivided into 3 categories according to the ISH methods: the fluorescence ISH (FISH), silver ISH (SISH), and chromogenic ISH (CISH) subgroups (Tab. II). In the random-effect model, the concordance rates were 0.375 (95% CI 0.305-0.449), 0.453 (95% CI 0.344-0.566), and 0.391 (95% CI 0.118-0.755) in the FISH, SISH, and CISH subgroups, respectively. In addition, for the HER2 IHC 0/1+ and 3+ groups, the positive rates were higher in the SISH subgroup than in the FISH and CISH subgroups. In subgroup analysis, there were no significant differences in concordance rates between the study locations.
The eligible studies used biopsied and/or surgical specimens to evaluate HER2 expression. To elucidate the impact of specimen type on the interpretation of HER2 expression, we performed subgroup analysis based on specimen types. In the IHC 2+ group, the concordance rate of the biopsied specimen subgroup was higher than that of the surgical specimen subgroup (0.588, 95% CI 0.299-0.789 vs. 0.344, 95% CI 0.280-0.415), but there was no statistical significance (p = 0.101). In addition, there was no difference in the concordance rates between biopsied and surgical specimen types in the IHC 0/1+ (0.968, 95% CI 0.917-0.988 vs. 0.965, 95% CI 0.957-0.971) and IHC 3+ groups (0.925, 95% CI 0.838-0.968 vs. 0.910, 95% CI 0.864-0.941).
Diagnostic Test Accuracy Review
To evaluate the diagnostic accuracy of HER2 IHC, we performed a diagnostic test accuracy review. In this review, HER2 IHC scores 2+ and 3+ were considered IHC positive. The sensitivity and specificity ranges of studies with HER2 IHC scores 2+ and 3+ were from 0.44 to 1.00 and from 0.31 to 1.00, respectively, and their pooled sensitivity and specificity were 0.86 (95% CI 0.84-0.87) and 0.91 (95% CI 0.90-0.91), respectively (Fig. 2). The SROC curve is shown in Figure 3, and the AUC on the SROC curve was 0.958, very close to 1. In addition, the diagnostic accuracy was investigated according to the ISH methods. The values of AUC were 0.955, 0.961, and 0.976 in the FISH, SISH, and CISH methods, respectively. Next, subgroup analysis was conducted according to the manufacturer's antibodies, which were divided into HercepTest, A0485, 4B5, and others. As shown in Table III, the pooled sensitivity and specificity were highest in the 4B5 subgroup: 0.90 (95% CI 0.86-0.93) and 0.94 (95% CI 0.93-0.95), respectively. Also the diagnostic OR and the AUC on the SROC curve were highest in the 4B5 subgroup.
Sensitivity, specificity, diagnostic odds ratio and area under the curve of summary receiver operating characteristic curve according to the HER2 antibody
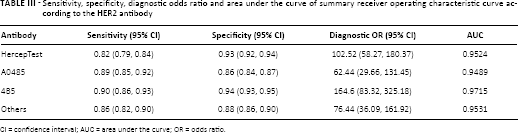
CI = confidence interval; AUC = area under the curve; OR = odds ratio.
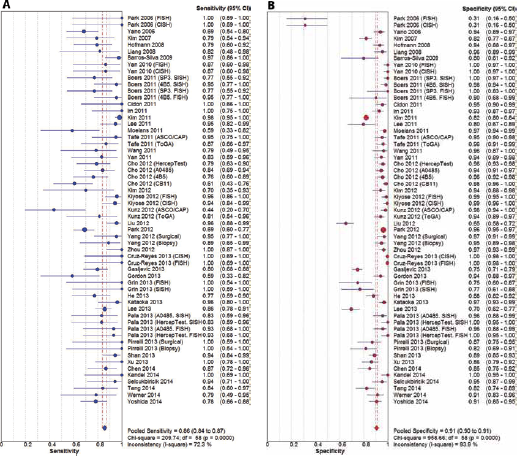
Forest plot diagram of the pooled sensitivity (
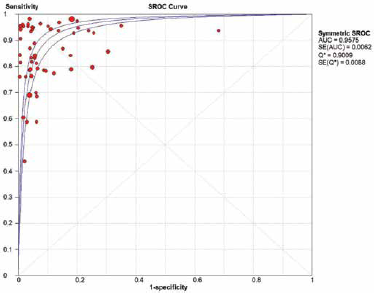
Summary receiver operating characteristic (SROC) curve of HER2 immunohistochemistry. AUC = area under the curve; SE = standard error.
Discussion
HER2 overexpression/gene amplification is an important factor for prognosis and treatment in GC and breast cancer. However, the concordance between HER2 IHC and ISH has not yet been fully elucidated in GC. This is the first meta-analysis of the concordance between HER2 IHC and ISH and the diagnostic accuracy of HER2 IHC in GC.
HER2 overexpression/gene amplification has been reported in up to 34% of all GC cases (4). In our systematic review, it varied from 4.2% to 54.4% in the eligible studies. In addition, the ranges of HER2 IHC positivity and gene amplification rates were 7.7%-74.4% and 3.7%-55.9%, respectively. Previous studies have shown that HER2 overexpression/gene amplification is significantly associated with poor prognosis (10, 51, 52). Furthermore, targeted therapy using the HER2 monoclonal antibody has been shown to produce survival benefit, and this treatment modality in advanced GC patients is one of the important treatment options (4). Some previous studies have reported that patients with HER2 IHC negativity and HER2 gene amplification have no therapeutic benefit from trastuzumab (4, 53). Therefore, the accurate evaluation of HER2 status could be of prime importance in the management of GC patients.
For the evaluation of HER2 status, IHC is used as an initial test and cases with IHC scores of 0/1+ or 3+ are confirmed without additional ISH tests. If the HER2 IHC score is 2+, an additional HER2 ISH test should be performed to confirm HER2 gene amplification. Although many studies have reported the concordance between HER2 IHC and ISH, we have not yet reached a conclusion on the concordance rate. In our systematic review, the concordance rate ranges were 0.800-1.000 and 0.455-1.000 in the HER2 IHC score 0/1+ and 3+ groups, respectively. However, because each eligible study used different IHC antibodies in the ISH methods, concordance analysis via a systematic review and meta-analysis is needed to elucidate the concordance between HER2 IHC and ISH. Also, diagnostic test accuracy review, which can determine why results vary between studies and compare the performances of alternative tests, should be done to confirm the diagnostic accuracy of HER2 IHC (54).
In this meta-analysis, the concordance rates between HER2 IHC and ISH were 96%, 36%, and 91% in the HER2 IHC score 0/1+, 2+, and 3+ groups, respectively, for GC, which is similar to the rates for breast cancer (55). As shown in Table II, the concordance rates were 0.969 and 0.915 in the HER2 IHC score 0/1+ and 3+ groups, respectively. HER2 IHC is useful for the evaluation of HER2 status as an initial test. However, because the discordance rates were 3.1% and 8.5% in the HER2 IHC 0/1+ and 3+ groups, respectively, the possibility of opposite results in ISH should be considered in cases with IHC scores of 0/1+ or 3+. If the false positive rate is high, this accounts for the failure to benefit from administered trastuzumab. In daily practice, precise evaluation of the HER2 status may be more important in the HER2 IHC 3+ group without additional ISH tests than in the HER2 IHC 2+ group. In addition, the choice of an ISH method or concurrent usage of IHC antibody could be important to elevate the sensitivity of the HER2 test. In the subgroup analysis in terms of ISH methods, the concordance rate was higher in the SISH subgroup than in the FISH and CISH subgroups for each of the HER2 IHC score groups. In our diagnostic test accuracy review, however, there was no significant difference in the AUC on the SROC curve between the ISH methods.
The concordance rate of the HER2 IHC 2+ group was 0.393 (95% CI 0.331-0.458) and more heterogeneous than in the HER2 IHC 0/1+ and 3+ groups. Although the HER2 IHC 2+ group is basically heterogeneous compared with the other HER2 IHC score groups, the heterogeneity of the concordance rate may have been caused by variable factors including ISH methods, IHC antibodies/methods, type of specimens, and examining pathologists. Asioli et al (56) showed that the sensitivity and accuracy of HER2 IHC were increased by additional block analysis. Thus, this heterogeneity might be influenced by tumor size and sampling for investigation of HER2 expression. Also, the intratumoral heterogeneity of HER2 expression could have contributed to the lower concordance rate in the HER2 IHC 2+ group (36). To confirm the cause of the heterogeneity, subgroup analysis was additionally performed based on specimen types, ISH methods, and IHC antibodies. Unlike breast cancer, the quantitative criteria of GC for HER2 overexpression are different between biopsied and surgical specimens. To elucidate the impact of specimen type on the interpretation of HER2 expression, we performed subgroup analysis based on specimen types, i.e., surgical and biopsied specimens. However, there was no difference in the concordance rates between biopsied and surgical specimens in the subgroup analysis. For the HER2 IHC 2+ group, the concordance rates were 0.375, 0.453, and 0.391 in the FISH, SISH, and CISH subgroups, respectively (Tab. II). Although the SISH technique was developed to overcome disadvantages of the FISH technique, whether the discrepancy between SISH and FISH may have influenced the heterogeneity of the concordance rate could not be explained in our meta-analysis. Moreover, since a HER2 IHC score of 2+ or 3+ was considered positive for IHC, we conducted a diagnostic test accuracy review. In the review, the AUCs on the SROCs were 0.955, 0.961, and 0.976 in the FISH, SISH, and CISH subgroups, respectively. Although the diagnostic accuracy was highest in CISH, the difference in the AUC on SROC between the groups was not statistically significant.
In daily practice, various HER2 antibodies, such as HercepTest, A0485, 4B5, CB11, and SP3, are used as an initial HER2 test; however, the same criteria are applied for the evaluation of HER2 IHC regardless of the antibody. Cho et al (21) reported that the rates of HER2 overexpression were different between antibodies, and that among the antibodies tested A0485 showed the highest positive rate. Furthermore, the HER2 test using CB11 had lower sensitivity and higher specificity than HER2 tests using other antibodies. In the present meta-analysis, however, the pooled sensitivity and specificity, the diagnostic OR, and the AUC value were highest in the HER2 IHC test using the 4B5 antibody. This discrepancy could have been caused by various factors including patient characteristics, IHC methods, and study location. In our meta-analysis we were unable to ascertain whether differences between antibodies affect the concordance rates. Bahreini et al (55) reported that in breast cancer, the HER2 test with CB11 and the HercepTest had higher sensitivity and specificity than tests using other antibodies. Further cumulative studies are needed to identify the ideal antibody for the HER2 test in GC.
There are some limitations to the present analysis. First, some eligible studies with a small number of patients showed low positive rates and concordance rates, which may have influenced the pooled values. Although ISH tests are expensive, multi-step and time-consuming tests compared to IHC, whether HER2 ISH as a first-line test for the evaluation of HER2 status is more advantageous could not be confirmed in our meta-analysis. In addition, because GC can show considerable intratumoral heterogeneity of HER2 expression (unlike breast cancer, which shows less heterogeneity), IHC is usually performed first to locate the HER2-positive region as well as the positivity of HER2 expression. Thus, it could be difficult to perform ISH before IHC because ISH can only be performed in a limited area. In addition, the impact of tumor size and sampling on the heterogeneity of HER2 expression could not be established in our systematic review and meta-analysis.
In conclusion, the present meta-analysis showed higher concordance rates between HER2 ISH and IHC scores 0/1+ and 3+, and higher diagnostic accuracy of HER2 IHC. The results of this meta-analysis suggest that HER2 IHC may be useful for evaluating HER2 status as an initial test and that more detailed criteria for HER2 IHC score 2+ cases will be required to predict HER2 gene amplification.
Footnotes
Financial support: Supported by grant No. 23-2015-0170 from the SNUH Research Fund.
Conflict of interest: The authors declare that they have no conflict of interest.