
Abstract
Excess water-soluble vitamins are thought to be eliminated in the urine. We have reported a strong relationship between water-soluble vitamin intake and urinary excretion in females. The relationship, however, is not well understood in males. In the present experiment, 10 Japanese male subjects were given a standard Japanese diet for the first week. The subjects remained on the same diet, and a synthesized water-soluble vitamin mixture containing one time the Dietary Reference Intakes (DRIs) for Japanese was given for the second week, three times the DRIs for the third week, and six times the DRIs for the fourth week. Twenty-four-hour urine samples were collected each week. Urinary excretion levels for seven of the nine water-soluble vitamin levels, excluding vitamin B12 and folate, increased linearly and sharply in a dose-dependent manner. These results suggest that measuring urinary water-soluble vitamins can be good nutritional markers for assessing vitamin intakes in humans.
Introduction
Evaluating the nutritional levels of individuals is important because metabolism differs among people. Calculating the nutritional intake from recorded dietary intakes has been the most frequently used method. Measuring biomarkers in blood and urine samples has been another common approach.
We have previously reported that urinary excretion of water-soluble vitamins closely reflects the excess water-soluble vitamins in rats1–15 and humans.16–27 Nutritional assessment using biomarkers is persuasive and leads to quick changes in dietary habits. We have not yet assessed whether there is a strong relationship between urinary excretion and vitamin intake in males. We sought to answer this question in the present experiment.
Materials and Methods
This study, conducted from November 13, 2006 to December 8, 2006, was reviewed and approved by the Ethical Committee of The University of Shiga Prefecture. All participants provided written informed consent.
Chemicals
Thiamin hydrochloride (C12H17ClN4OS-HCl; molecular weight = 337.27), riboflavin (C17H20N4O6; molecular weight = 376.37), pyridoxine hydrochloride (C8H11NO3-HCl; molecular weight = 205.63), pyridoxal phosphate (PLP) monohydrate (C8H10NO6P-H2O; molecular weight = 265.16) cyanocobalamin (C63H88CoN14O14P; molecular weight = 1355.40), nicotinamide (C6H6N2O; molecular weight = 122.13), calcium pantothenate (C18H32N2O10-Ca; molecular weight = 476.54), folic acid (C19H19N7O6; molecular weight = 441.40), D(+)-biotin (C10H16N2O3S; molecular weight = 244.31), and L(+)-ascorbic acid (C6H8O6; molecular weight = 176.13) were purchased from Wako Pure Chemical Industries. 4-Pyridoxic acid (4-PIC; C8H9NO4; molecular weight = 183.16) was made by ICN Pharmaceuticals (Costa Mesa, CA, USA) and obtained through (Wako Pure Chemical Industries, Osaka, Japan).
Subjects
Male Japanese university students and faculty members were recruited from The University of Shiga Prefecture. The purpose and protocol of this study were explained to all participants, and written informed consent was obtained. Participants diagnosed with cold or influenza, and those who had taken multi-vitamin supplements at least once during the previous month, were excluded. All subjects passed the regular medical examination in the university. Of the 12 apparently healthy male Japanese who participated in this study, 10 subjects, aged 19-55 years (means ± SD = 26.8 ± 11.0 years) completed the study (Table 1).
Characteristics of Japanese male subjects.

All subjects (

Photographs of the food that were administered to the Japanese male subjects during the experiment.
Composition of diet fed to Japanese male subjects during the study.

Values were calculated from the data of “Standard Tables of Food Composition in Japan-2010-.” Numbers in parentheses state the water-soluble vitamin content as measured by us.
NE (niacin equivalent): calculated by assuming that 1 mg of nicotinamide can be synthesized from 60 mg of tryptophan and that 100 g of protein contains 1.2 g of tryptophan.
Diet and Study Design
The subjects took the diet from day 1 to day 5 in each week (experimental period, 4 weeks). But, they lived freely to soften the restraint at day 6 and day 7 in each week. Approximately, 1, 3-, and 6-folds of the synthesized water-soluble vitamin mixture as vitamin mixture α, β, and γ shown in DRIs for Japanese-2010- 31 were made (Table 3). They were given the diet only for the first week, the diet with vitamin mixture α for the second week, the diet with vitamin mixture β for the third week, and the diet with vitamin mixture γ for the fourth week. One-third of the dose was put into a small gelatinous capsule, and the capsule was administered three times daily after breakfast, lunch, and dinner. The folate level in vitamin mixture γ exceeds the tolerable upper limit intake of folate (1 mg/d), 31 however, does not the no-observed-adverse-effect-level (5 mg/d); 31 that figure has been set on toxicological consideration. Thus, the administration of vitamin mixture γ for a week was approved by the Ethical Committee of The University of Shiga Prefecture.
Composition of vitamin mixtures administered during weeks 2, 3, and 4.

Thiamin hydrochloride was used; value was expressed as thiamin itself.
Pyridoxine hydrochloride was used; value was expressed as pyridoxine itself.
Ca pantothenate was used; value was expressed as pantothenic acid itself.
The relative biological values of synthesized vitamins against dietary vitamins were used: vitamin B1, 1.7; vitamin B2, 1.5; vitamin B6, 1.4; niacin, 1.7; pantothenic acid, 1.4 vitamin B12, 2.0; folate, 2.0; biotin, 1.3; vitamin C, 1. Values were taken from Refs.45,46
Analytical Methods
General Biomarkers in Blood
Whole blood samples were sent to the Institute of Shiga Health Center (Shiga, Japan) for measurements of general biomarkers in blood. The numbers and percentages of blood cells are measured by XE-2100 automated hematology analyzer. Enzyme activities and the concentrations of nutrients were measured by automatic biochemical analysis systems LABOSPECT 008.
Measurement of the Levels of Water-Soluble Vitamins in Whole Blood and Plasma
The whole blood samples (3 mL x 2) were taken from the brachial vein and placed directly into a tube Venoject II (code No. VP-DK052K [Terumo Corporation, Tokyo, Japan]). A portion of the whole blood (0.6 mL) was retained to measure nicotinamide and riboflavin levels, and stored at -80°C until needed. Additional collected blood samples were centrifuged for 30 minutes at 1,500 x
Vitamin B1. Frozen plasma samples (0.15 mL) were thawed, 5% trichloroacetic acid (0.3 mL) was added, and mixed well and kept for 10 minutes at 4°C. The suspension was centrifuged at 10,000 x
Vitamin B2. Frozen ethylenediaminetetraacetic acid (EDTA)-treated whole blood samples (0.1 mL) stored at -80°C were thawed. The measurement method
33
was modified as follows. To 0.1 mL of each of thawed whole blood, 0.44 mL of water and 0.26 mL of 0.5 mol/L H2SO4 were added and kept at 80°C for 15 minutes. After cooling on ice, 0.2 mL of 10% trichloroacetic acid was added and the mixture was centrifuged at 10,000 x
PLP (a coenzyme of vitamin B6). Frozen plasma samples (0.1 mL) were thawed and then added to 0.1 mL of 5% metaphosphoric acid and mixed well for 5 minutes at room temperature. The mixture was centrifuged for 15 minutes at 10,000 x
Vitamin B12. Frozen plasma samples (50 µL) were thawed and then added to 0.57 mmol/L acetate buffer, pH 4.5 (0.25 mL), 0.05% KCN (10 and water (0.5 mL). The vitamin B12 was converted to cyanocobalamin by immersing it to boiling water bath for 30 minutes. After cooling on ice, 10% methaphosphoric acid (15 µL) was added and then the solution was centrifuged at 10,000 x
Nicotinamide. Frozen whole blood samples (75 µL) in a screw-capped vial were thawed and added to 1.425 mL of 2 µg/L isonicotinamide (used as an internal standard), which was autoclaved at 120°C for 10 minutes to convert pyridine nucleotide coenzymes to nicotinamide. After cooling on ice, the sample was centrifuged at 10,000 x
Pantothenic acid. Frozen plasma sample (0.1 mL) was thawed and centrifuged at 10,000 x
Folates. Frozen plasma sample was thawed and centrifuged at 10,000 x
Biotin. Frozen plasma sample was thawed and centrifuged at 10,000 x
Vitamin C. Freshly prepared plasma (0.1 mL) was added to 0.9 mL of ice-cold 20% metaphosphoric acid containing 1% stannous chloride, mixed well, and centrifuged at 10,000 x
Measurement of the Levels of Water-Soluble Vitamins in Urine
Twenty-four-hour urine samples were collected in amber bottles with 10 mL of 1 mol/L HCl and these urine samples were stored at -80°C until needed.
Vitamin B1. The acidified urine samples were thawed and centrifuged at 10,000 x
Vitamin B2. The acidified urine samples were thawed and centrifuged at 10,000 x
Vitamin B6. The acidified urine samples were thawed and centrifuged at 10,000 x
Vitamin B12. Frozen acidified urine samples (0.9 mL) were added to 0.1 mmol/L acetate buffer, pH 4.8 (0.18 mL), 0.025% KCN (0.02 mL), and water (0.68 mL). The vitamin B12 was converted to cyanocobalamin by autoclaving for 5 minutes at 121°C. After cooling, 10% methaphosphoric acid (20 µL) was added and then the solution was centrifuged at 10,000 x
Nicotinamide. Frozen urine samples (1.5 mL) were thawed and then centrifuged at 10,000 x
An another catabolite MNA in urine sample (0.8 mL) reacted with 0.1 mol/L acetophenone in ethanol (0.5 mL) in a strong alkali medium (1.0 mL of 6 mol/L NaOH) at 0°C in the presence of a large amount of isonicotinamide (0.20 mL of 1 mol/L isonicotinamide).
42
After being kept for 10 minutes, formic acid was added and the mixture was kept for another 15 minutes at 0°C. Then, the mixture was heated at above 93°C for 5 minutes. The reaction product, 1-methyl-7-phenyl-1,5-dihydro-5-oxo-1,6-naphthyridine, was analyzed by HPLC described previously and modified as follows.
17
The method employs adsorption on a Tosoh ODS-80Ts (250 x 4.6 mm, I.D., 5 µm) column, elution with a mixture of 30 mmol/L KH2PO4 (pH was adjusted to 3.0 by H3PO4) containing 1 mmol/L EDTA and 1 g/L 1-heptanesulfonic acid sodium salt:acetonitrile (1000:290, v/v), at a flow rate of 1.0 mL/min, and estimation at excitation wavelength of 382 nm as well as emission wavelength of 440 nm. The column temperature was maintained at 30°C. The derivatized product of MNA was eluted
Pantothenic acid. Frozen acidified urine samples were thawed and centrifuged at 10,000 x
Folates. Frozen acidified urine samples were thawed and centrifuged at 10,000 x
Biotin. Frozen acidified urine samples were thawed and centrifuged at 10,000 x
Vitamin C. Frozen acidified urine sample (0.1 mL) was thawed and consequently added to 0.1 mL of 0.2% 2,6-dichloroindophenol, 50 µL of 1% stannous chloride, and 0.12 mL of 2% dinitrophenylhydrazine in 4.5 mol/L H2SO4, and mixed well.
39
The resulting mixture was stirred at 37°C for 3 hours. The reacted product, dehydroascorbic acid bis(dinitrophenyl)hydrazone), was added to 1 mL of water and then to 1 mL of ethyl acetate, and vigorously shacked for 5 minutes. After centrifuged at 600 x
Measurement of the Contents of Water-Soluble Vitamins in Food
Preparation and measurement of the extracts of B-group vitamins from breakfast, lunch, dinner, and snacks was described below. Whole foods served at breakfast, lunch, dinner, and snacks were mixed, and minced well by a kitchen knife. Each of the whole minced materials was added to 5 volumes of 1% TAKA-DIASTASE® (obtained from Sankyo Co., Ltd., Tokyo, Japan. Now the company name was changed to Daiichi-Sankyo Co., Ltd.) solution dissolved in water and incubated for 3 hours at 37°C in order to digest biopolymers such as protein, fat, and carbohydrate. These homogenates were designated as the treated homogenates of foods.
Vitamin B1. The treated homogenates of foods were added to 10 volumes of cold 5% trichloroacetic acid and mixed well for 5 minutes at room temperature. The acidified homogenates were centrifuged at 10,000 x
Vitamin B2. The treated homogenates of foods were added to 5 volumes of 50 mmol/L KH2PO4-K2HPO4 buffer (pH 7.0). The measurement method
33
was modified as follows. To 0.1 mL of each homogenates, 0.44 mL of water and 0.26 mL of 0.5 mol/L H2SO4 were added, and the mixture were kept at 80°C for 15 minutes. After cooling, 0.2 mL of 10% trichloroacetic acid was added, and the mixture was centrifuged at 10,000 x
Vitamin B6. The treated homogenates of foods were added to 2 volumes of 0.11 mol/L HCl and the mixture was mixed well for 10 minutes at room temperature. The acidified homogenate was autoclaved at 121°C for 3 hours to convert vitamin B6 coenzyme to the free form of vitamin B6. After cooling, the mixture was adjusted to pH 5.0 with 1 mol/L NaOH and then increased to 100 mL with water. The solution was filtered with qualitative filter number 2 (Advantec, Tokyo, Japan). The filtrate was used to measure the level of vitamin B6 using
Vitamin B12. The treated homogenates of foods (0.5 mL) were added to 2.5 mL of 0.57 mol/L acetic acid–sodium acetate buffer (pH 4.5) plus 5 mL of water and 0.1 mL of 0.05% KCN. The homogenate was then put into a boiling water bath for 5 minutes. After cooling, 0.15 mL of 10% metaphosphoric acid was added and increased to 10 mL with water. The solution was centrifuged at 10,000 x
Nicotinamide. The treated homogenates of foods (1 mL) were withdrawn, added to 4 mL of water, and then autoclaved at 121°C for 10 minutes to convert pyridine nucleotide coenzymes to nicotinamide. After cooling, the mixture was centrifuged at 10,000 x
Pantothenic acid. The treated homogenates of foods were added to 5 volumes of 50 mmol/L KH2PO4–K2HPO4 buffer (pH 7.0) and were incubated overnight at 37°C to convert free pantothenic acid from the bound type of pantothenate compounds. The reaction was stopped by placing the mixture into a boiling water bath for 5 minutes. After cooling, the mixture was centrifuged at 10,000 x
Folate. The treated homogenates of foods were added to 5 volumes of 0.1 mol/L KH2PO4–K2HPO4 buffer (pH 6.1) and were autoclaved at 121°C for 5 minutes. After cooling, 2.5 mL of proteinase MS (200 U/mL of water; Kaken Pharmaceutical Co., Ltd., Tokyo, Japan) was added. The mixture was incubated at 37°C for 3 hours to digest proteins and release polyglutamated folate from the protein-bound types. The reaction was stopped by placing the mixture into a boiling water bath for 10 minutes. After cooling, 0.5 mL of conjugase (extract from porcine kidney acetone powder [type II]; Sigma-Aldrich, St Louis, MO, USA) was added to the mixture, which was then incubated overnight at 37°C to convert polyglutamated folates to monoglutamated folates. The reaction was stopped by placing into a boiling water bath for 10 minutes. After cooling, the mixture was centrifuged at 10,000 x
The conjugase solution was made up as follows: 60 mL of 50 mmol/L KH2PO4–K2HPO4 buffer (pH 7.0) was added to 20 g of porcine kidney acetone powder and stirred for 30 minutes at 4°C. The suspension was centrifuged at 10,000 x
Biotin. The treated homogenates of foods were added to 2 volumes of 2.25 mol/L H2SO4 and were autoclaved at 121° C for 1 hour to convert bound biotin to the free form of biotin. After cooling, the suspension was centrifuged at 10,000 x
Vitamin C. The treated homogenates of foods (1 mL) were added to 9 mL of ice-cold 20% metaphosphoric acid containing 1% stannous chloride, mixed well, and centrifuged at 10,000 x
Urinary Excretion Percentages of Water-Soluble Vitamins
The urinary excretion of percentages of water-soluble vitamins over intakes of water-soluble vitamins during the study was calculated as follows: (24-hour urinary excretion of vitamin mol/d)/(vitamin intake, mol/d) x 100.
Statistical Methods
Intra- and inter-individual variations were calculated with analysis of variance. Nonparametric Friedman test for repeated measures following Dunn's post-test was used to analyze statistical differences. Pearson coefficients were calculated to determine correlation between dietary vitamin intake and the concentration of blood or urine vitamin. A
Results
Basic Characteristics
The body weight and height of the 10 Japanese male subjects did not change during the course of the study. Table 1 shows their age, height, body weight, and BMI. Table 2 shows the composition of the diet fed throughout the study. Table 3 shows the vitamin mixtures α, β, and γ administered in weeks 2, 3, and 4, respectively. Table 4 shows the general biomarkers in the blood at the end of weeks 1, 2, 3, and 4; all values were within the reference range.
General biomarkers in the blood of Japanese male subjects.

Values are means ± SD for the 10 subjects. Nonparametric Friedman test for repeated measures following Dunn's post-test was used to analyze statistical differences; no significant differences were observed at all.
Blood Water-Soluble Vitamins
Figure 2 shows the correlation between water-soluble vitamins ingested and circulating in the blood. The correlation was significant for vitamin B2, PLP (coenzyme form of vitamin B6), vitamin B12, nicotinamide, pantothenic acid, and folate, but the slopes were not steep against the amounts ingested. No significant correlation existed for vitamin B1, biotin, and vitamin C.
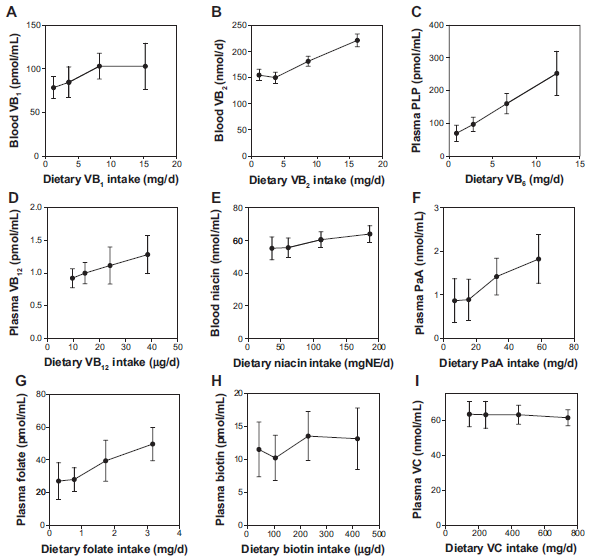
Correlation of vitamin intake and concentration of water-soluble vitamins in the blood of the Japanese male subjects.
Urine Volume
Figure 3 shows the daily changes of the urine volumes of each subject. Twenty-four-hour urine samples were collected eight times and the results are presented in Table 5. The intra-individual coefficient of variation was lower than the inter-individual coefficient of variation. The lowest urine volume was 700 mL/d and the highest 3,030 mL/d. The median was 1,595 mL/d, and the mean ± SD of all 80 samples was 1,678 ± 630 mL/d.

Changes in urine volumes for each Japanese male subject during the study.
Averages of the eight daily urine volumes collected from each Japanese male subject.

Urinary Creatinine
Figure 4 shows the daily changes in the urinary creatinine in each subject. Twenty-four-hour urine samples were collected eight times. The average urinary creatinine for each individual is shown in Table 6. The intra-individual coefficient of variation was lower than the inter-individual coefficient of variation. The lowest level of urinary creatinine was 11.42 mmol/d and the highest level was 20.35 mmol/d. The median was 15.58 mmol/d, and the mean ± SD of all 80 samples was 15.60 ± 1.55 mmol/d.

Changes in urinary creatinine for each Japanese male subject during the study.
Averages of the eight daily urinary creatinine collected from each Japanese male subject.

Urinary Water-Soluble Vitamins
Figure 5 shows the correlation between the water-soluble vitamins excreted in the urine and ingested. A significant correlation was observed for seven of the nine water-soluble vitamins.

Correlation of vitamin intake and urinary concentrations of water-soluble vitamins in Japanese male subjects.
Urinary excretion of vitamin B12 did not increase with vitamin B12 intake (Fig. 5D).
Urinary excretion of folate increased with folate intake, but the line was not straight; which had a broken point (Fig. 5G). Figure 6 shows the breaking point between dietary folate intake and urinary folate. The breaking point was observed at approximately 1.6 mg of dietary folate/d, which was obtained by intersecting the graph lines of weeks 1 and 2 and weeks 3 and 4.

Breaking point in the relationship between dietary folate intake and urinary folate in Japanese male subjects.
Figure 7 shows the percentage of water-soluble vitamins excreted in the urine. The percentages of vitamin B1, vitamin B2, vitamin B6, niacin, pantothenic acid, biotin, and vitamin C were relatively constant regardless of their intake. The percentage of vitamin B12 excreted decreased with intake, suggesting that vitamin B12 absorption is limited by a special mechanism. 44
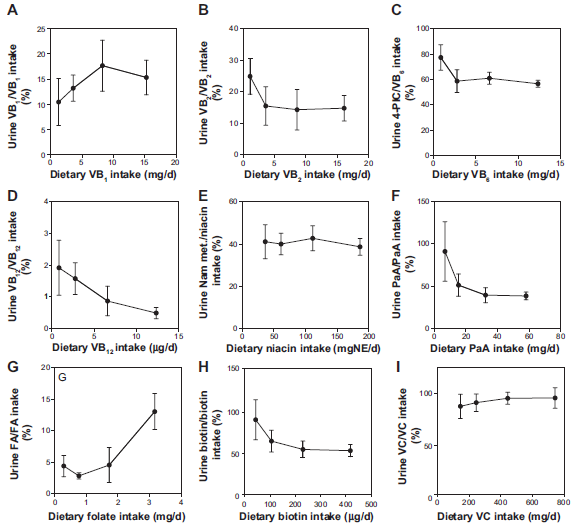
Correlation of vitamin intake and the percentage of urinary vitamin/vitamin intake in Japanese male subjects.
Figure 8 shows the significant correlation between urinary vitamin B12 and urine volume.

Correlation between urinary vitamin B12 and urine volume of Japanese male subjects.
Discussion
Dietary assessments are an easy way to obtain dietary and nutrient intakes, but misreporting is common and, therefore, cannot be an accurate way of determining nutritional statuses. Furthermore, using dietary assessments to determine micronutrient intakes is difficult because of high variations in habitual micronutrient intake. It is important to evaluate the nutritional level of each person because metabolic ability varies with every individual. Two methods (recorded dietary assessments, and measurement of nutritional biomarkers in the blood and urine) are being used to speculate the nutrients intakes. Nutritional biomarkers, for examples, measurements of nutrients and their metabolites in urine and blood, are used as a more accurate way for measuring the nutritional status of dietary intake or the metabolism of the dietary constituents. We previously determined that measuring the biomarkers of water-soluble vitamins in urine samples were better than in blood samples. We also investigated the relationship between urinary excretion and intakes of water-soluble vitamins in humans and animals.1–27 We confirmed that water-soluble vitamins were available as nutritional biomarkers for assessing their intake in females. This experiment sought to verify this fact in males.
The urine samples of the male subjects were clearly better than the blood samples. The slopes were much steeper in the urine than in the blood. Of the nine water-soluble vitamins, vitamin B12 excretion did not reflect vitamin B12 intake. Instead, urinary vitamin B12 is correlated with urine volume. We previously reported this phenomenon 23 and again observed it in the present experiment. The urinary concentration of vitamin B12 (pmol/mL) was constant at approximately 50-60 pmol/L of urine. Vitamin B12 has a mechanism of absorption and excretion route that is different from other water-soluble vitamins: it is excreted through the bile. 44 The change in urinary vitamin B12 is too small to evaluate vitamin B12 intake. 23
In Japanese females, folate had a lower linear regression coefficient value than the other water-soluble vitamins, except for vitamin B12. 20 A similar observation was made in the present experiment. A breaking point was also observed at approximately 1.6 mg/d of dietary folate. Interestingly, administering 0.24 mg/d of synthetic folate (0.48 mg/d of dietary folate) did not change the urinary folate percentages, but administering more than 0.72 mg/d of synthetic folate (1.44 mg/d of dietary folate) changed the elimination process. We could not determine whether this was good or bad for health promotion. Figure 9 shows a proposed relationship between vitamin intake and urinary vitamin elimination. In general, urinary excretion of water-soluble vitamins cannot be detected when vitamin intake is below the required levels. When vitamin intake exceeds the requirements, they are absorbed passively into the body. The excreted vitamins and/or their metabolites are observed for the first time when they are eliminated linearly into the urine by passive diffusion. Therefore, urinary excretion of vitamins is constant. Such a phenomenon is thought to be good for health promotion. For folate intake, less than 1.6 mg/d is good for health promotion. When intake exceeds saturation in the body, the vitamins and/or their metabolites are actively excreted into urine to prevent excessive toxicity of the vitamins. Such a phenomenon is not good for health promotion, but toxicity does not appear. At this level, termed the tolerable upper limit, excretion does not increase according to vitamin intake because the body is no longer able to eliminate the vitamins. Habitual intakes above the tolerable upper limit increase the risks of health problems. For dietary folate, 1.6 mg/d is the tolerable upper limit. Apart from vitamin B12, no tolerable upper limits were seen in the other water-soluble vitamins.

Proposed relationship between intake and elimination of water-soluble vitamins.
In conclusion, urinary water-soluble vitamin levels reflect their intakes and are suitable biomarkers for measuring their intakes. Vitamin B12 is an exception.
Author Contributions
KS designed the study and drafted the manuscript. KS, JH, and TF performed the experiments, and JH and TF reviewed the manuscript and helped in the study design. All authors reviewed and approved of the final manuscript.
Footnotes
Acknowledgments
The authors express their sincere appreciation to their students for measuring the urinary excretions of vitamins.