Historically, breast cancer classification has relied on prognostic subtypes. Thus, unlike hematopoietic cancers, breast tumor classification lacks phylogenetic rationale. The feasibility of phylogenetic classification of breast tumors has recently been demonstrated based on estrogen receptor (ER), androgen receptor (AR), vitamin D receptor (VDR) and Keratin 5 expression. Four hormonal states (HR0–3) comprising 11 cellular subtypes of breast cells have been proposed. This classification scheme has been shown to have relevance to clinical prognosis. We examine the implications of such phylogenetic classification on DNA methylation of both breast tumors and normal breast tissues by applying recently developed deconvolution algorithms to three DNA methylation data sets archived on Gene Expression Omnibus. We propose that breast tumors arising from a particular cell-of-origin essentially magnify the epigenetic state of their original cell type. We demonstrate that DNA methylation of tumors manifests patterns consistent with cell-specific epigenetic states, that these states correspond roughly to previously posited normal breast cell types, and that estimates of proportions of the underlying cell types are predictive of tumor phenotypes. Taken together, these findings suggest that the epigenetics of breast tumors is ultimately based on the underlying phylogeny of normal breast tissue.
Historically, taxonomy of a disease entity has been based on an underlying biology that explains the pathogenesis of a particular disease. Once a disease is established as a single uniform entity from the perspective of a common pathophysiology, various clinical and molecular prognostic features are used to define the severity of the disease.
This paradigm has been difficult to follow for cancer classification, because of our lack of understanding of the underlying mechanisms. In the case of breast cancer, an empirical system developed over the past three decades without a clear underlying organizing principle. Clinically, human breast cancers are currently grouped into three categories based on the presence of estrogen receptor (ER+), progesterone receptor (PR+), and human epidermal growth factor receptor 2 (HER2+) or by their absence in triple-negative breast cancers (ER/PR/HER2–-). These categories are based on biomarkers that correlate with response to different treatments such as ER-antagonist tamoxifen and anti-HER2 treatment herceptin. Though pragmatic, such an ad hoc classification scheme does not provide insights about the pathogenesis or true phylogeny of breast cancer. A comprehensive discussion of inaccuracies of breast cancer classification appears in a recent review.1
With the emergence of high-throughput molecular statistical tools, several purely prognostic classification schemes have been proposed for breast cancer. For example, messenger RNA (mRNA) expression profiles of breast tumors have been used to define four prognostic subgroups of breast cancer: Luminal A, Luminal B, Basal-like, Claudin-low and Her2-like.2 DNA methylation patterns have been used to identify five distinct groups3 and 10 different breast cancer clusters have been identified in a DNA copy number-based genetic classification system.4,5
However, while prognostic categories subdivide diagnostic categories into distinct outcome groups, they cannot be the sole basis of a comprehensive classification approach. The principal reason for this is that in a purely prognostic approach, the only criterion that distinguishes two entities is their difference in clinical outcome. Hence, two different entities with the same outcome but with different pathogenesis cannot be distinguished by this approach. This is a nontrivial issue as they may require different treatment approaches because of the differences in pathophysiology. Conversely, a purely prognostic approach may end up categorizing two different stages of a single disease as different entities.
Consequently, purely molecular prognostic approaches to classify breast cancer have not led to a comprehensive classification. There has been little overlap among the mRNA expression, DNA copy number, and methylation-based prognostic groups, because they are not based on a common pathophysiology. A breast cancer task force recently concluded that molecular tools do not currently provide sufficiently robust information beyond histological type, grade, and ER, PR, and HER2 status,6 and these molecular tests are therefore not routinely performed at most institutions.7
We set out to provide a pathophysiological framework that can provide a biological setting in which prognostic categories can be discovered. The phylogeny of normal cell types have been successfully used as a reference point to classify lymphomas and leukemias.8 The discovery of the molecular similarity between leukemias and lymphomas with normal lymphocytes and leukocytes was important in this process.
In solid tissues, characterization of the normal cell subtypes has been difficult. Until recently, only two cell types -luminal versus myoepithelial cells – had been described in the human breast.9 This has precluded a normal cell-type-based classification system for breast cancer. Inspired by the classification of hematopoietic malignancies, we hypothesized that a more detailed description of normal cell types in the human breast may be important for classification of human breast tumors.
Recently, we analyzed more than 15,000 normal breast cells and described the normal phylogeny of cell subtypes in the luminal layer of human breast.10 These cell types conform to four novel hormonal differentiation groups (HR0, HR1, HR2, and HR3) based on estrogen receptor, androgen receptor, and vitamin D receptor (ER, AR, and VDR) in normal human breast. When normal cell types were compared with more than 3000 human breast tumors, we found that each patient's tumor could be placed precisely in this normal cell-type phylogeny.
In this study, we examine breast tumor “taxonomy” based on normal tissue differentiation: triple-positive tumors (HR3) that co-express ER, AR, and VDR; double-positive tumors (HR2) that are ER/AR[+] (HR2ea), AR/VDR[+] (HR2av), or ER/VDR[+], (HR2ev); single-positive tumors (HR1) that only express one of the hormone receptors, ER[+] (HR1e), VDR[+] (HR1v), or AR[+] (HR1a); and hormone receptor–negative tumors (HR0) that are negative for ER, AR, and VDR.
In general, normal tissue differentiation and cellular phylogeny is regulated by epigenetic mechanisms. It remains to be demonstrated that an epigenetic basis exists for the breast-specific phylogeny we have described. DNA methylation, tightly associated with alterations in the nucleosome DNA scaffold (and hence chromatin), is in part responsible for coordination of gene expression in individual cells.11–13 Differentially methylated DNA regions (DMRs) distinguish cell lineages with high sensitivity and specificity,14 and considerable research has been underway to delineate precise DMRs that define and specify a particular cell lineage. Our recently published set of statistical methods exploits this association to infer changes in cell mixture proportions solely on the basis of a DNA methylation profile. These methods are based on linear mixing assumptions, ie, that latent linear structures within DNA methylation profiles reflect phenotypic associations with cell mixture. In particular, we have demonstrated the use of a reference DNA methylation data set to deconvolve a separate target DNA methylation data set into constituent cell-type proportions15 and have more recently demonstrated the reference-free deconvolution of DNA methylation data sets, which allows for inference of latent linear structures reflecting cellular mixtures when no reference data sets exist.16 Both methods assume that DNA methylation is measured on an average beta scale roughly corresponding to a fraction of methylated cytosine molecules and that an m X n matrix Y of average beta values (m = # CpG sites, n = # subjects) is linearly generated via E(Y)=BXT + MΩT, where X is the n x d design matrix of phenotype and potential confounders, B is the m x d matrix of regression coefficients representing direct effects not mediated by cell type, and MΩTrepresents the linear mixture effect, with M an m x k matrix representing cell-specific methylation states, Ω an n x k matrix representing subject-specific cell-type distributions, and the value k chosen in advance. In the reference-based method, an estimate of M is obtained from the reference data set, while the reference-free method extracts it as a latent variable. The latter is achieved by first fitting the model Y = B*XT + E*, where B* is an m x d matrix of “unadjusted” coefficients and E* is an m x n matrix of errors, subsequently using straightforward linear algebra to extract an estimate of the adjusted coefficient matrix from the singular value decomposition of the concatenated matrix (B*, E*). Additionally, we have proposed a bootstrap method for obtaining standard errors (SEs) for both and * and have distributed software for our method via the R/CRAN package RefFreeEWAS.
No reference data set currently exists for normal breast cells types. However, we propose that breast tumors, arising from a particular cell-of-origin in a more-or-less clonal fashion, will essentially magnify the epigenetic state of their original cell type. In particular, any phenotype that reflects histologic information will also contain information about the epigenetics of normal breast cells. Specifically, if the proportions Ω of constituent cell types vary with available phenotypic information X, then the DNA methylation data Y from tumors will be strongly influenced by the underlying DNA methylation states M for the constituent cell types, assumed more or less to reflect normal breast cells. Thus, we hypothesize that tumor methylation data can be decomposed into two components: the cell-mixture component Δ = MΩT(Delta), reflecting normal breast cells, and the remainder term B(Beta), which reflects tumor-specific activity. Critically, Δ = B* – B, which is estimable by our recently published statistical methods.
In this paper, we use three publicly available breast tumor methylation data sets to test our hypothesis. All three data sets were obtained from Gene Expression Omnibus (GEO), and each contain data assayed by the Illumina Human-Methylation27 BeadChip array. Table 1 describes the data sets, GSE20712,17 GSE31979,18 and GSE32393.19 Note that each of the three data sets contains additional samples reflecting normal breast tissue, and GSE20712 also includes companion mRNA expression data set, GSE20711. Regressing DNA methylation data on phenotype matrices X reflecting underlying histology, we demonstrate the following: (1) CpG sites and genes with significant Δ coefficients (reflecting cell mixture effects) will be more consistent across the three data sets than those with significant B coefficients (reflecting effects that are independent of cell mixture); (2) deconvolution of DNA methylation data from normal breast tissue at CpG sites with the most significant Δ coefficients will lead to latent linear structures that more strongly correspond to normal breast cell types than do the latent linear structures obtained by deconvolving normal breast tissue at CpG sites with the most significant B coefficients; and (3) deconvolution of tumor data will produce linear structures that more closely align to tumor histology when CpG sites with the most significant Δ coefficients are used instead of those with the most significant B coefficients. Note that for (2), we use mRNA expression data paired with samples in GSE20712 to supervise deconvolution of cell types and use data from our recent paper, Santagata et al.10 as a basis for normal-cell comparison, and that for (3) we use tumors only from GSE31979 and GSE32393 as the basis for comparing classifications obtained from GSE20712, since the tumor histology classifications of GSE20712 ultimately form the basis of classification via the phenotype matrix X used to obtain estimates of Δ and B.
A total of 103 total samples were available, but 13 had missing/ambiguous histology.
Six healthy tissues matched to tumor and 15 to normal breast organoid.
Results
Comparison of Delta and Beta Coefficients
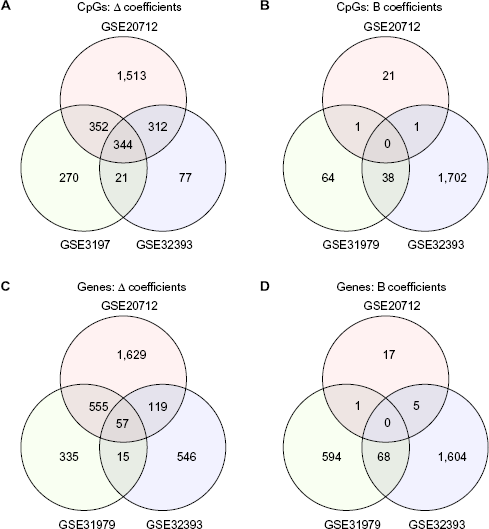
We applied the method of Houseman et al.16 to tumor data obtained from the three GEO data sets described in Table 1. The phenotype matrix X used for each analysis is detailed in Table 2. The Venn diagrams in Figure 1 illustrate the number of significant (q < 0.05) CpG coefficients Δ (mixture) and B (mixture-adjusted) as well as overlaps between the three data sets. Corresponding numbers are shown for unique genes to which significant CpGs are mapped. Venn diagrams in Figure 1 illustrate overlaps between significant Δ coefficients and significant B coefficients within each data set. While there were 344 overlapping CpGs (57 overlapping genes) with significant Δ coefficients across the three data sets, there were no overlapping CpGs or genes with significant B coefficients. Significantly more CpGs and genes overlap via Δ than via B (P < 10-12, two-sample binomial proportion test).
Overlaps in CpGs and genes having significant Δ or B coefficients. Each panel reports the number of features that significantly distinguish clinical phenotypes within three breast cancer data sets (described comprehensively in Tables 1 and 2). Panels (A) and (B) report significant (q < 0.05) CpG loci, while panels (C) and (D) report unique genes to which significant CpG loci are mapped. Panels (A) and (C) report significance based on Δ coefficients (representing cell-composition effects), while panels (B) and (D) report B coefficients (representing effects not mediated by cell composition).
Summary of analysis.
GSE20712
GSE31979
GSE32393
EWAS MODEL (X)
HISTOLOGY + GRADE + SIZE
HISTOLOGY
HISTOLOGY + ER + GRADE + AGE
Histology categories
Basal|HER2|LumA|LumB
ER-|ER+|Her2|LumA|LumB|TriN
Invasive ductal|invasive lobular|mucinous or medullary + others
Deg. Free (Total Mod)
6
6
7
Deg. Free (Phenotype Test L)
3
5
3
Dirichlet Model (Z)
–
Histology
Histology + ER
Notes
Age and size available only as binned high/low. Node and Age bin were omitted due to low overall significance; Grade was binned into (1,2) versus 3. ComBAT-adjusted for Beadchip effects (with Histology as protected phenotype).
103 tumors available, 13 excluded from EWAS analysis due to missing/ambiguous histology, but included in Dirichlet model for assessing cell-type proportion estimates. Age/node not available. Size omitted due to low overall significance. Two different types of normal breast tissues are included, as described in Table 3.
Size not available; Grade: 1,2, (3,NA) [4 NAs]; mean Age = 59. ComBAT adjusted for Beadchip effects (with Histology as protected phenotype). Both Histology and ER used as tested phenotype.
Note: Boldface variables in Epigenome-wide Association Study (EWAS) model were used in phenotype-specific hypothesis tests represented by the matrix L
Figure S2 illustrates correlation among estimates of B* (total unadjusted), B, and Δ in significance (as measured by-log10P-value) averaged over the three data sets. Significance of ΔA coefficients correlated strongly with significance of B* coefficients (Spearman rS = 0.61) but was uncorrelated with significance of B coefficients (Spearman rS = -0.01); significance of B coefficients correlated only weakly with significance of B* coefficients (Spearman rS = 0.33). Figure S3 illustrates correlation between data sets in significance of Δ and B coefficients. Spearman correlations for Δ were 0.41, 0.43, and 0.35 for GSE20712 versus GSE31979, GSE20712 versus GSE32393, and GSE31979 versus GSE32393 respectively; corresponding Spearman correlations for B were 0.01, -0.01, and 0.01.
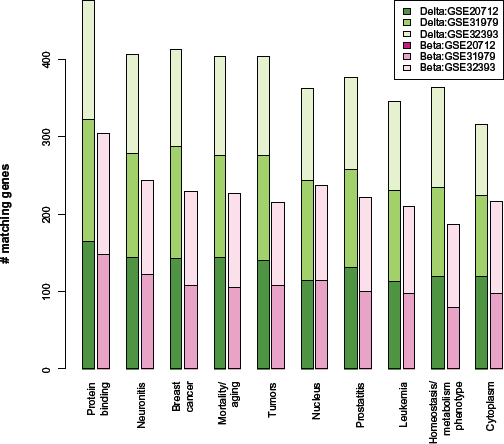
Figure 2 shows the GeneDecks annotation terms most significantly associated with lists of genes to which significant (q < 0.05) CpGs are mapped, either via Δ or via B. Prominent terms include protein binding, neuronitis, breast cancer, mortality/aging, and tumors; for the top 10 terms, greater numbers of matching genes were obtained via Δ than via B. Note that there were no significantly matching B terms for GSE20712. In general, the number of genes mapped to significant Δ coefficients significantly matching GeneDecks terms was larger than the corresponding number of genes mapped to B coefficients. For GSE31979 and for GSE32838, Figure S4 illustrates a comparison of significance between Δ and B over all significant GeneDecks terms, demonstrating greater significance via Δ than via B. Overall, these results suggest greater statistical and biological significance and consistency across data sets among lists of genes were obtained via Δ compared with lists obtained via B. In order to compare GeneDecks terms by predominance among one type of coefficient over another, we sorted the terms by two quantities: √NΔ – √NB and by √NB – √NΔ, where NΔ was the number of matching genes mapped to significant Δ coefficients across all three data sets, NB was the corresponding number of genes mapped to significant B coefficients, and the square-root function was used as the variance-stabilizing transform for Poisson counts. Table S1(A) shows the top 50 terms by the first criterion, and Table S2(B) shows the top 50 terms for the second criterion. Terms favored by Δ were predominantly disorder attributes, while those favored by B were predominantly expression pattern attributes. The most predominant disorder terms favored by Δ coefficients involved immune function, inflammation, and cancer, while additional terms suggest cell membranes and signaling. Interestingly, VDR, which has been shown to distinguish normal breast cell types,10 may figure prominently in two of the top terms, “tuberculosis” and “hepatitis b”,20–22 not to mention the vascular endothelial growth factor (VEGF) pathway critical in “hypertension”.23 In contrast, the predominant terms favored by B coefficients demonstrate no strong pattern other than expression in disparate tissues. Taken together, these lists suggest that the genes mapped to CpG loci that share epigenetic patterns in a linear fashion (ie, suggestive of mediation by cells) share integrated biological activity, while the genes mapped to CpG loci that represent “unique” epigenetic markers of clinical phenotype share less biological activity.
Annotation terms associated with significant Δ or B coefficients. Bars indicate the number of unique genes within three breast cancer data sets (described comprehensively in Tables 1 and 2) that map to top GeneDecks terms. These were unique genes, up to 500 for each of six analyses that map to the CpG-specific coefficients having the smallest P-values for distinguishing clinical phenotypes. Green bars are based on Δ coefficients (representing cell-composition effects), while pink bars are based on B coefficients (representing effects not mediated by cell composition). Note that for GSE20712, no significant B coefficients mapped to these genes associated with these 10 terms. The 10 terms shown are those that had the highest average count across all six analyses.
Comparison with Normal Breast Tissue
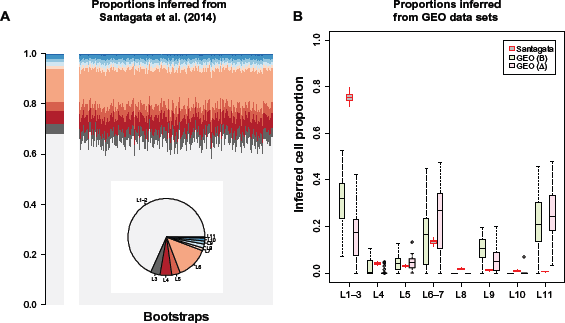
We next sought to compare the biological significance of Δ-based coefficients with B-based coefficients for normal breast tissue. Table 3 summarizes normal breast tissue available via the three GEO data sets used in this analysis. We first used mRNA expression data for Estrogen Receptor 1 (ESR1), AR, and VDR to assign each “tumor” in GSE20712 to one of eight categories. These categories are mapped to 11 normal cell-type categories, each defined by expression of ER, AR, VDR, and K5, as described previously10 and as shown in Table 4. Additionally, to address potential contamination by blood, we used DNA methylation data from 500 CpGs to infer leukocyte proportions for each tumor, using our reference-based deconvolution algorithm.15 Over the union of 100 leukocyte DMRs with the 5000 CpGs having most significant A coefficients (for a total of 5081 CpGs), we estimated the mean methylation matrix MΔ for the eight hormonal cell subgroup categories described in Table 4, subsequently applying our reference-based deconvolution algorithm15 to normal data described in Table 3 to obtain cell proportion estimates for each of 14 cell types (8 breast cells and 6 leukocyte types). We repeated the analysis using top 5000 CpGs having the most significant B coefficients (for a total of 5077 CpGs), obtaining the corresponding cell proportions . Finally, as a basis of comparison, we used data provided in Supplementary Tables S2A–S2D of Santagata et al.10 to infer the proportion of normal cell types in normal breast tissue. Figure 3A illustrates the proportion of normal cell types inferred from the Santagata et al data,10 while Figure 3B illustrates the correspondence between these inferred proportions and proportions and of cell-type obtained from GEO data. Note that bootstrap estimates of cell-type probabilities are also shown in Figure 3A and were used to generate the distribution of parameter estimates shown in gray in Figure 3B. Additionally Figures S5 and S6 depict the GEO-based estimates in clustering heat map format. The absolute correspondence was far from perfect in either case in particular, the GEO analysis suggested elevated proportions of L11 cells, while the Santagata et al data suggest relatively low proportions. However, in all other respects, there was general semiquantitative agreement: in both analyses, proportions of L1–-3 and L6–7 were elevated relative to L4, L5, L8, L9, and L10. Note that while imperfect in both cases, the correspondence was worse for (8 degrees-of-freedom χ2 statistic = 1528) than for (8 degree-of-freedom χ2 statistic = 2608). The clustering heat map shown in Figure S6 shows that the leukocyte assignment appears principally in the natural killer (NK) category, ie, for a relatively rare cell type in comparison to granulocytes or CD4+ T cells; such a finding would contradict overall contamination of tumor sample by blood, and instead suggest either biased estimates MB of normal cell-specific epigenetic states or infiltration of tumor via NK cells, in either case failing to reflect normal breast cell activity. Note also that a paired t-test comparing the total proportion assigned leukocyte cells differed significantly (P < 10-12) between and with greater leukocyte proportion assigned for this finding, illustrated in Figure S7, provides additional evidence that represents greater misclassification with respect to normal breast cell phylogenetics.
Correspondence of estimated normal cell proportions. Panel (A): left subpanel indicates estimated proportions; right subpanel illustrates variation among bootstrap samples. Panel (B): distributions of cell proportions inferred from tumor data or normal cell data obtained from Santagata et al.10
Numbers of tumors available in both GSE20712 (DNA methylation) and GSE20711 (mRNA expression).
Comparisons with Tumor Tissue
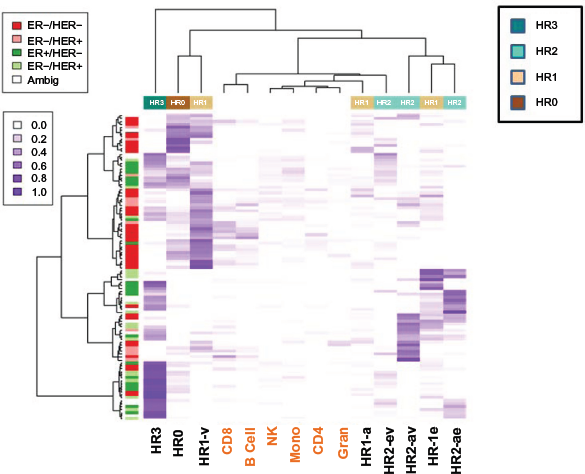
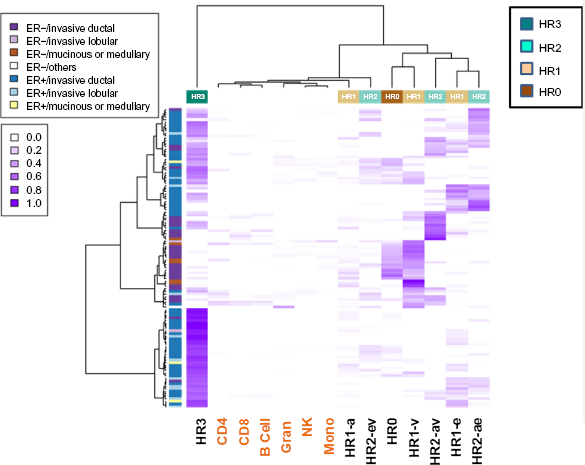
Finally, we applied the deconvolution method described above to tumor data from GSE31979 and GSE32393. Clustering heat maps appearing in Figures 4 and 5 depict the correspondence of tumor histology with inferred cell proportions (via Delta coefficients): for GSE31979 (Fig. 4) and for GSE32393 (Fig. 5). A likelihood ratio test (LRT) assuming a Dirichlet model for and revealed highly significant results for both cell proportion estimates, but greater significance for than for . In particular, for GSE31979, the LRT statistic via Δ was 201.2 (90 d.f. χ2, P = 1.7 x 10⁻¹⁰) and via B was 191.3 (90 d.f. χ2, P = 2.8 x 10⁻⁹). Similar results were obtained for GSE32393: the LRT statistic via Δ was 156.1 (45 d.f. χ2, P < 10-12) and that via B was 125.4 (45 d.f. χ2, P = 1.6 x 10⁻⁹). Note that the clustering heat maps for both data sets reveal that the ER status of tumors (bar on left, green for ER+) line up reasonably with the ER status of the inferred ER+ cell types (HR3, HR1-e, HR2-ev, and HR2-ae). In contrast, ER– tumors mostly line up with HRO and HR1-v. Figure 4 suggests little to no clustering by HER2 status; the lack of an epigenetic signature is consistent with the genetic amplification-driven pathogenesis of these tumors. In Figure 5 there is once again a correlation between ER+ tumors and HR subtypes (HR3, HR1-e, HR2-ev, and HR2-ae) and ER- tumors mostly line up with HRO and HR1-v. In contrast, no clustering according the morphological categories (ductal, lobular, mucinous, or medullary) is observed. Note also that, as measured by estimated cell proportion, about 24% of the GSE31979 tumors and 36% of the GSE32393 tumors belonged to the triple-positive HR3 group, while 12% of the GSE31979 tumors and 6% of the GSE32393 tumors belonged to the triple-negative HRO group. It is worth pointing out that in the standard breast cancer classification, all ER+ tumors would be combined into one group. However, as can be seen in Figures 4 and 5, HR3 tumors, which are by definition ER+ (ER/AR/VR+), form a very distinct cluster category different from other ER+ tumors, such as HR2 (ER/AR+ or ER/VDR+) and ER+ HR1 (ER+).
Clustering heat map showing estimated proportions of normal cell types within tumors available in GSE31979. Left annotation bar represents tumor phenotype; top annotation bar represents HR classification of normal breast cell types, further described by bottom labels.
Clustering heat map showing estimated proportions of normal cell types within tumors available in GSE32393. Left annotation bar represents tumor phenotype; top annotation bar represents HR classification of normal breast cell types, further described by bottom labels.
Discussion
We hypothesized that the coefficient matrix A, representing the effects of tumor phenotype on DNA methylation mediated by cell composition, would more stably reflect tumor biology than the coefficient matrix B, which represents DNA methylation effects that are apparently independent of cell composition. We have shown this is indeed the case, with greater overlap across three breast cancer data sets (GSE20712, GSE31979, and GSE32393) in CpGs and genes with significant Δ coefficients compared with B coefficients; this finding suggests that the CpGs that act together in a linear fashion consistent with cell composition effects more consistently reflect breast tumor biology. Additionally, there was greater correlation of CpG-specific total (unadjusted) effects B* = Δ + B with Δ than with B, suggesting that the cell-composition portion of the association between tumor phenotype and DNA methylation drives the overall association.
For the prominent annotation terms that match genes to which CpGs having DNA methylation significantly associated with phenotype are mapped, more genes are mapped to CpGs with significant Δ coefficients than with significant B coefficients. Cancer-specific terms such as “breast cancer”, “tumors”, and “leukemia” were prominent. Also prominent were immune-related terms such as “leukemia” and “mortality/aging” (changes in immune function are hallmarks of aging24,25); this finding is consistent with previously observed immune characteristics of breast tumor methylation, reflecting processes such as infiltration by T-cells,17 although we attempted to address infiltration in downstream analyses. The very general Gene Ontology term “protein binding” also figured prominently; this is consistent with previously observed importance of cytoskeletal protein binding in breast cancer26 as well as established signaling pathways3,27 in which substrate binding may be involved. The prominence of the term “neuronitis” is puzzling, but consistent with metabolic changes observed in both breast tumors and synaptic coupling,28 and with the prominence of the Wnt pathway in both DNA methylation–related mRNA expression in breast tumors3 and neuronal differentiation.29 While we found that prominent terms were represented more by genes with significant Δ coefficients than by genes with significant B coefficients, we acknowledge several alternative interpretations of this finding. The first is that the cell-compositional effects that consistently associate with tumor phenotype simply reflect infiltration by immune cells; the second is that the cell-compositional effects represent clonal expansion of a specific underlying normal breast cell type that has undergone carcinogenic transformation.
To distinguish between these two explanations, we analyzed DNA methylation data from normal breast cell tissue, using a supervised deconvolution approach,15 where cell types were determined by applying expression-based normal breast cell categories10 to existing mRNA expression data (available for the breast tumors in GSE20712), choosing CpGs that had the most significant Δ coefficients and choosing additional CpGs that identify known immune cell types.15 The rationale for this analysis was the following: if cell-type heterogeneity in breast tumors is driven by the clonal expansion of a specific type of normal breast cell, then the set of CpGs for which heterogeneity in DNA methylation is explained mostly by cell composition will represent, for the most part, the set of CpGs that serve to identify each normal breast cell type, in the same manner that has been previously characterized for leukocytes.15,30 In other words, tumorogenesis acts to magnify the typical epigenetic state for one type of normal breast cell, thus enabling a plausible (if imperfect) characterization of such states. Emerging from this deconvolution analysis were estimated proportions within normal breast cell tissue of each expression-based normal cell type, described in Table 4, adjusted for immune infiltration. While we did not observe perfect correspondence between these estimated proportions and those obtained from an independent data set,10 there was general semiquantitative agreement. The greatest discrepancy was that, in our deconvolution analyses, there was a smaller estimated proportion of L1–3 (HR0) cells and a greater estimated proportion of L11 (HR3) cells, when compared to the independent data set based on normal breast tissue, reflecting a potential bias in the use of tumor data to define representative sets CpGs. When we repeated the analysis using the most significant B coefficients in place of the significant Δ coefficients, we found a similar pattern but strictly worse correspondence with proportions estimated from normal tissue, thus reinforcing the finding that the DNA methylation profiles may be driven more by cell-composition effects reflecting normal cell types than by effects that are independent of normal cell composition.
We applied similar deconvolution analysis to tumor data appearing in GSE31979 and GSE32393; we found negligible correlation of cell-type proportions to HER2 status and substantial agreement in ER status between predicted cell type and tumor histology. We also observed low estimated proportions of leukocytes, suggesting that cell-compositional effects are explained principally by underlying normal cell histology and negligibly by immune infiltration. Finally, we note that the correspondence between tumor phenotype and estimated cell-type proportion was greater for the compositionally based estimates than for the estimates based on independent effects , though both were strong.
To date, the most comprehensive integrated molecular profiling of breast tumors is that undertaken by the Cancer Genome Atlas (TCGA) network.3 The DNA methylation profiling in the TCGA study did not attempt to establish correspondences with normal tissue, so the potential of a direct comparison with our results is limited. However, TCGA found a significant correspondence of DNA methylation with mRNA expression in the Wnt signaling pathway (associated with ERs31–33 and also a child term of the GO “protein binding” term), and also found at most a modest association of DNA methylation with HER2 status. A slightly older study34 found no associations between DNA methylation and ER status, parity, or oral contraceptive use (ie, hormonal signaling), but this study used the relatively sparse GoldenGate platform (Illumina, Inc) for assaying DNA methylation.
We note that a substantial proportion of the tumors in GSE31979 and GSE32393 were apparently members of the triple-positive HR3 lineage, while smaller fractions were members of the triple-negative HR0 lineage. While these proportions are biased by selection of tumors in the original study and thus do not necessarily represent population-based estimates, we note that in our earlier study10 we found that nearly half of the breast cancer patients belonged to the HR3 group and that patients with these triple-positive tumors (HR3) were up to seven times more likely to survive compared to patients with triple-negative tumors (HR0). Compared with many existing genetic/molecular tests with 2–5 fold survival differences, this cell-type-based approach can become a powerful new tool in predicting patient outcomes, thus representing great prognostic potential. Additionally, we note that the selection of CpGs based on cell-composition effects (Δ) led to greater consistency in significant associations across distinct data sets and better apparent correspondence with normal breast cell phylogeny compared with results obtained by selection of coefficients than CpGs presumed to have an effect independent of cell composition (B). Thus, as an analytical technique for developing prognostic biomarkers using DNA methylation data, the reference-free approach we have employed in this analysis may have great potential.
A major limitation of this analysis, reflected in the imperfect correspondence between estimated normal cell proportions obtained from the two distinct analytical approaches we employed, is that our CpG sets that putatively distinguish normal breast cell types as well as the normal DNA methylation states estimated for those CpGs were determined from tumor data, thus potentially biased by epigenetic changes related to carcinogenesis. We would expect much cleaner correspondence if the CpGs and their normal methylation states could be obtained by profiling DNA methylation for isolated cell types from normal breast tissue. While no such data sets yet exist, we anticipate that such data sets will exist in the near future, thus potentially validating the findings in the present article.
Finally, it is worth noting that we initiated this study based on eight cell subtype lineages defined by protein expression for ER, AR, VDR, and K5 detected by immunostains. The CpG methylation results corresponding to these eight lineages suggest that they may have distinct DNA methylation signatures. Hence, this result supports the notion that these protein-based phenotypic categories may have an epigenomic underpinning. These results indicate that the novel analytical approach we used for estimating normal cell proportions from protein co-expression cell counts could be applied more generally to estimate normal cell proportions for heterogeneous tissue.
Materials and Methods
Data Sets
Data sets were obtained from GEO. All three sets (accession numbers GSE20712, GSE31979, and GSE32393) represent DNA methylation data assayed via the Illumina HumanMethylation27 BeadChip Array platform. Beadchip identifiers were available for data sets GSE20712 and GSE32393, so these were used to preadjust logitaverage betas for BeadChip batch effects using the ComBAT algorithm,35 protecting histology, and ER status against over-adjustment. As beta values are required for the method published by Houseman et al.16 adjusted values were subsequently transformed back via inverse-logit to the average beta scale. Only CpGs having fewer than three missing values were used in analysis. We attempted to minimize the size of the models used in this analysis by omitting covariates that displayed only weak overall associations with DNA methylation by preliminary assessment via limma analysis.36 For GSE20712, paired mRNA expression data assayed via Affymetrix Human Genome U133 Plus 2.0 Array exist in GEO via accession number GSE20711; these were used to assign cell-of-origin categories to individual tumors in GSE20712.
Delta and Beta Coefficients
For each of the three data sets analyzed, we used the recently published reference-free deconvolution algorithm16 to estimate CpG-specific DNA methylation effects adjusted for cell mixture, as implemented in the R package RefFreeEWAS (version 1.01) within R version 3.0.0. For each data set, the covariate matrix X was constructed as described in Table 2. For GSE31979, 13 of 103 total tumor samples were excluded due to missing or ambiguous histology classification.
In order to estimate the variation in estimators and *, the reference-free algorithm generates bootstrap estimates for and * and hence These were used to compute SEs and P-values (for Beta coefficients) and (for Delta coefficients) for each row j ∊ {1,2,…, m}. To represent false discovery rate, we used the q value package (version 1.34.0) in R to transform P-values to q-values. Additional technical details are provided in the Supplementary Methods document. After selecting a q-value threshold of 0.05, we computed overlaps between significant Beta and Delta coefficients within each data set and Beta-specific and Delta-specific overlaps across data sets. We also employed the GeneDecks functionality of GeneCards (http://www.genecards.org/index.php?path = GeneDecks) to biologically annotate genes to which significant (q < 0.05) CpGs were mapped. Since GeneDecks accepts a maximum of 500 genes, we used only 500 genes corresponding to the smallest q-values in cases where more than 500 unique genes had significant CpGs. Note that all queries were run on April 6, 2014.
Comparison with Normal Breast Tissue
To estimate the distribution of normal breast cell types, we used data from Tables S2A through S2D in Santagata et al.10 Each of these tables provides co-expression frequencies of five proteins: K5, VDR, ER, AR, and Ki67. In particular, for two proteins G1 and imaging-based cell counts N10, N01, and N11 are given for and cells, respectively. From these counts, we obtained a vector ω0 with a cell-type proportion estimate for each of the 10 categories described in Table 4. Bootstrap inference was achieved using a parametric bootstrap procedure, where 250 data sets were simulated using fitted parameters, each used to obtain a bootstrap estimate . Bootstraps revealed a slight bias in parameter estimates compared with fitted probabilities (as is evident upon careful examination of Fig. 3A), so that bootstrap means were used to bias-correct final quantiles depicted in Figure 3B (in red and gray) and in comparisons described below. In particular, Figure 3B shows the median, quartiles, and 2.5th/97.5th percentiles for each cell-type distribution assuming normally distributed estimates with mean equal to bias-corrected estimates and standard deviations equal to the cell-type-specific bootstrap standard deviations . Details appear in the Supplementary Methods document. Complete code for this analysis appears on our website, http://people.oregonstate.edu/~housemae/software/CancerInformatics2014/.
Gene expression arrays were available for 88 of the 119 tumors profiled in GSE20712; paired mRNA expression data appear on GEO via accession number GSE20711. These data were used to assign each of the 88 tumors to one of eight categories based on AR, ER, and VDR expression (collapsing categories L1–2 and L3 in one category and L6 and L7 in another). Bimodal probe 226197_a was used for AR expression, dichotomized approximately between modes at the value 8.0. Bimodal probe 205225_at was used for ESR1, dichotomized approximately between modes at the value 9.0. None of the VDR probes were bimodal, so probe 204254_s_at was used for VDR, dichotomized just below the mean at the value 8.0. Sample sizes for each category are shown in Table 4. Figure S8 in the Supplement depicts the histograms of the expression data as well as the chosen thresholds. The top 5000 CpGs ranked by Delta P-values defined above were combined with 100 leukocyte-specific DMRs,15 for a total of 5081 CpGs. For each of these, mean methylation (average beta) was subsequently computed from tumor methylation data for each of the eight defined cell categories. These were combined with mean methylation values at the same CpGs for six leukocyte types (B-cell, CD4+ T cell, CD8+ T cell, granulocyte, monocyte, and NK)15 obtained from data available in GEO, accession number GSE39881. The result was a 5081 X 14 matrix M(Δ) of cell-type–specific methylation values for eight breast cell types and six blood cell types, the latter to account for potential blood contamination of samples. For each of the available 48 normal breast cell samples summarized in Table 3, we obtained cell-type proportions by applying the reference-based method.15 In this context, the algorithm produced a 14 X 1 vector for each normal breast tissue sample i having DNA methylation profile at the selected CpG sites. We repeated the process by selecting instead the top 5000 CpGs ranked by Beta P-values , resulting in 5077 common CpG sites, a 5077 x 14 matrix M(B) of cell-type–specific methylation values, and cell proportion vectors for each tumor sample i. Box-and-whisker diagrams in Figure 3B depict the distributions of and by cell type. Figures S5 and S6 display the resulting data and as clustering heat maps, with clustering obtained via Ward's method.
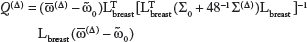
To compare and to the distribution ω0 obtained from the Santagata et al data,10 we used the and estimates to calculate Delta- and Beta-specific means and (respectively) and variance–covariance matrices Σ(Δ) and Σ)(B) (respectively), constructing finally the 8 d.f. chi-square statistics
and
with Lbreast the 14 x 8 matrix that selects out only the breast coefficients. Note that Σ0 represents the variance-covariance matrix for the “estimate” , but the corresponding matrices for mean estimates and are, respectively, 48-1Σ(Δ) and 48-1Σ(B).
Comparisons with Tumor Tissue
We also applied the approach described above (to obtain estimates and of cell-type proportion for normal breast tissue) to tumor samples available in GSE31979 and GSE32393. We did not apply the approach to tumor samples from GSE20712, since the tumor data were used to select the CpGs used in the estimation procedure (via M(Δ) and M(B)). Thus, for each tumor sample i in GSE31979, we estimated cell proportion vectors and , and for each tumor sample i in GSE32393, we estimated cell proportion vectors and . The results are depicted as clustering heat maps in Figures 4 and 5 with clustering obtained via Ward's method. From these individual estimates, proportion sets and were assembled. We simplified the annotation of GSE31979 phenotypes in Figure 4, classifying each tumor as “Ambiguous/unknown” (n = 13), ER+/HER2+ (n = 5), ER+/HER2- (n = 34), ER-/HER2+ (n = 12), ER-/HER2–(n = 39). Supplementary Table S2 provides details of classification based on the histology information available in the GEO files. Note that unknown HER status (4 Luminal A tumors and 21 ER– tumors) were classified as “HER–” for this analysis. Annotation details for GSE32393 are given in Table S3, detailing histology by ER status (ER+ n = 76, ER- n = 38); note that one invasive lobular tumor had unknown ER status and was classified as ER–.
To evaluate concordancy between cell-type proportions and histological/molecular classification, we fit Dirichlet models to each tumor-specific cell proportion vector, a null model that assumes no concordance and another model that allocates a portion of each sample to the cell-type categories according to histological/molecular classification. Table 2 indicates the variables that were used to define the classification. Note that for GSE31979, 13 tumor samples with missing or ambiguous classification were included in this analysis, assigned to a separate histology category of Ambig, producing seven overall histology categories. Chi-square likelihood-ratio test (LRT) statistics and the corresponding P-values were computed for each data set and statistic (Delta and Beta). Details of the Dirchlet model fitting appear in the Supplementary Methods document.
Author Contributions
Developed statistical algorithms, provided epigenetic expertise, and composed the manuscript: EAH. Provided expertise on breast cancer, breast cancer typing, and edited the manuscript: TAI. Made critical revisions: EAH. Both authors reviewed and approved of the final manuscript.
Footnotes
Supplementary Data
References
1.
SantagataS.InceT.Normal cell phenotypes of breast epithelial cells provide the foundation of a breast cancer taxonomy. Expert Rev Anticancer Ther.2014; 14. http://www.ncbi.nlm.nih.gov/pubmed/25263303.
2.
PratA.PerouC.M.Deconstructing the molecular portraits of breast cancer. Mol Oncol.2011; 5(1): 5–23.
3.
Cancer Genome Atlas Network.Comprehensive molecular portraits of human breast tumours. Nature.2012; 490(7418): 61–70.
4.
CurtisC.ShahS.P.ChinS.F.The genomic and transcriptomic architecture of 2,000 breast tumours reveals novel subgroups. Nature.2012; 486(7403): 346–52.
5.
DawsonS.J.RuedaO.M.AparicioS.CaldasC.A new genome-driven integrated classification of breast cancer and its implications. EMBO J.2013; 32(5): 617–28.
6.
GuiuS.MichielsS.AndréF.Molecular subclasses of breast cancer: how do we define them? The IMPAKT 2012 Working Group Statement. Ann Oncol.2012; 23(12): 2997–3006.
7.
SchnittS.J.Classification and prognosis of invasive breast cancer: from morphology to molecular taxonomy. Mod Pathol.2010; 23(suppl 2): S60–4.
8.
SwerdlowS.CampoE.HarrisN.L.JaffeE.PileriS.SteinH.WHO classification of Tumours of Haematopoietic and Lymphoid Tissues.Lyon, France: International Agency for Research on Cancer; 2008.
9.
JonesC.MackayA.GrigoriadisA.Expression profiling of purified normal human luminal and myoepithelial breast cells identification of novel prognostic markers for breast cancer. Cancer Res.2004; 64(9): 3037–45.
10.
SantagataS.ThakkarA.ErgonulA.Taxonomy of breast cancer based on normal cell phenotype predicts outcome. J Clin Invest.2014; 124(2): 859–70.
11.
JiH.EhrlichL.I.SeitaJ.Comprehensive methylome map of lineage commitment from haematopoietic progenitors. Nature.2010; 467(7313): 338–42.
12.
KhavariD.A.SenG.L.RinnJ.L.DNA methylation and epigenetic control of cellular differentiation. Cell Cycle.2010; 9(19): 3880–3.
13.
NatoliG.Maintaining cell identity through global control of genomic organization. Immunity.2010; 33(1): 12–24.
14.
BaronU.TürbachovaI.HellwagA.Research paper DNA methylation analysis as a tool for cell typing. Epigenetics.2006; 1(1): 55–60.
15.
HousemanE.A.AccomandoW.P.KoestlerD.C.DNA methylation arrays as surrogate measures of cell mixture distribution. BMC Bioinformatics.2012; 13: 86.
16.
HousemanE.A.MolitorJ.MarsitC.J.Reference-free cell mixture adjustments in analysis of DNA methylation data. Bioinformatics.2014; 30: 1431–9.
17.
DedeurwaerderS.DesmedtC.CalonneE.DNA methylation profiling reveals a predominant immune component in breast cancers. EMBO Mol Med.2011; 3(12): 726–41.
18.
FacklerM.J.UmbrichtC.B.WilliamsD.Genome-wide methylation analysis identifies genes specific to breast cancer hormone receptor status and risk of recurrence. Cancer Res.2011; 71(19): 6195–207.
19.
ZhuangJ.JonesA.LeeS.H.The dynamics and prognostic potential of DNA methylation changes at stem cell gene loci in women's cancer. PLoS Genet.2012; 8(2): e1002517.
20.
BellamyR.RuwendeC.CorrahT.Tuberculosis and chronic hepatitis B virus infection in Africans and variation in the vitamin D receptor gene. J Infect Dis.1999; 179(3): 721–4.
21.
FarnikH.BojungaJ.BergerA.Low vitamin D serum concentration is associated with high levels of hepatitis B virus replication in chronically infected patients. Hepatology.2013; 58(4): 1270–6.
22.
SalamonH.BruinersN.LakehalK.Cutting edge: Vitamin D regulates lipid metabolism in mycobacterium tuberculosis infection. J Immunol.2014; 193: 30–4.
23.
CardusA.PanizoS.EncinasM.1, 25-Dihydroxyvitamin D3 regulates VEGF production through a vitamin D response element in the VEGF promoter. Atherosclerosis.2009; 204(1): 85–9.
24.
MillerR.A.The aging immune system: primer and prospectus. Science.1996; 273(5271): 70–4.
25.
JaffeA.E.IrizarryR.A.Accounting for cellular heterogeneity is critical in epigenome-wide association studies. Genome Biol.2014; 15(2): R31.
26.
SjöblomT.JonesS.WoodL.D.The consensus coding sequences of human breast and colorectal cancers. Science.2006; 314(5797): 268–74.
27.
LeeA.V.JacksonJ.G.GoochJ.L.Enhancement of insulin-like growth factor signaling in human breast cancer: estrogen regulation of insulin receptor substrate-1 expression in vitro and in vivo. Mol Endocrinol.1999; 13(5): 787–96.
28.
PavlidesS.TsirigosA.VeraI.Transcriptional evidence for the” Reverse Warburg Effect” in human breast cancer tumor stroma and metastasis: similarities with oxidative stress, inflammation, Alzheimer's disease, and” Neuron-Glia Metabolic Coupling”. Aging (Albany NY).2010; 2(4): 185.
ReiniusL.E.AcevedoN.JoerinkM.Differential DNA methylation in purified human blood cells: implications for cell lineage and studies on disease susceptibility. PLoS One.2012; 7(7): e41361.
31.
ArmstrongV.J.MuzylakM.SuntersA.Wnt/β-catenin signaling is a component of osteoblastic bone cell early responses to load-bearing and requires estrogen receptor a. J Biol Chem.2007; 282(28): 20715–27.
32.
BocchinfusoW.P.HivelyW.P.CouseJ.F.VarmusH.E.KorachK.S.A mouse mammary tumor virus-Wnt-1 transgene induces mammary gland hyperplasia and tumorigenesis in mice lacking estrogen receptor-α. Cancer Res.1999; 59(8): 1869–76.
33.
KouzmenkoA.P.TakeyamaK.ItoS.Wnt/β-catenin and estrogen signaling converge in vivo. J Biol Chem.2004; 279(39): 40255–8.
34.
ChristensenB.C.KelseyK.T.ZhengS.Breast cancer DNA methylation profiles are associated with tumor size and alcohol and folate intake. PLoS Genet.2010; 6(7): e1001043.
35.
JohnsonW.E.LiC.RabinovicA.Adjusting batch effects in microarray expression data using empirical Bayes methods. Biostatistics.2007; 8(1): 118–27.
36.
SmythG.K.Linear models and empirical Bayes methods for assessing differential expression in microarray experiments. Stat Appl Genet Mol Biol.2004; 3(1): 3.