
Abstract
Heterogeneous DNA methylation patterns are linked to tumor growth. In order to study DNA methylation heterogeneity patterns for breast cancer cell lines, we comparatively study four metrics: variance, I2 statistic, entropy, and methylation state. Using the categorical metric methylation state, we select the two most heterogeneous states to identify genes that directly affect tumor suppressor genes and high- or moderate-risk breast cancer genes. Utilizing the Gene Set Enrichment Analysis software and the ConsensusPath Database visualization tool, we generate integrated gene networks to study biological relations of heterogeneous genes. This analysis has allowed us to contribute 19 potential breast cancer biomarker genes to cancer databases by locating “hub genes” – heterogeneous genes of significant biological interactions, selected from numerous cancer modules. We have discovered a considerable relationship between these hub genes and heterogeneously methylated oncogenes. Our results have many implications for further heterogeneity analyses of methylation patterns and early detection of breast cancer susceptibility.
Introduction
Cancer is one of the leading causes of death worldwide. There were approximately 1.7 million new cases of cancer and over 585,000 cancer-related deaths in the U.S. alone in 2014. 1 Around one in eight women will be diagnosed with breast cancer in their lifetime, and hundreds of thousands of people in the U.S. are diagnosed with this disease each year. 2 Because cancer springs from the rapid growth of abnormal cells, effective early detection and screening are principal to overcoming this disease. Therefore, medical researchers have been conducting genetic and epigenetic research to find potential biomarkers for early detection, screening, and treatment.3–5
Traditional pathological examination of tumors tends to rely on needle biopsy, a procedure that analyzes tiny fractions of cells that may not sufficiently represent the tumor mass in heterogeneous cells. This means that important disease details and features may be overlooked. Furthermore, increasing evidence indicates greater heterogeneity of cancer cells when compared to normal cells. Although some research has been done on cancer heterogeneity patterns using DNA sequencing data, 6 this topic is relatively new and challenging because genome-wide DNA sequencing datasets are as large as hundreds of gigabytes or even terabytes and have complex biological and technical structures. 7 In this paper, we focus on studying cancer methylation heterogeneity patterns for breast cancer cell lines. Detailed information about DNA methylation is illustrated below.
DNA methylation occurs when a methyl group (-CH3) covalently bonds to a cytosine in the dinucleotide 5′-CpG-3′ (or the fifth nucleotide). 8 When a cytosine is linked to a gua-nine by a phosphodiester bond, a CG or CpG site is formed. CpG islands are genomic regions that are rich in CpG sites. These islands often overlap with transcription start sites of genes, as well as intergenic regions and gene bodies. 9 DNA methylation plays an important role in regulating gene expression by directly preventing transcription factor binding. 9 DNA methylation near transcription starting sites may block initiation and methylation in centromeres and other repeat regions. DNA methylation is also likely to have a role in both chromosomal and genome stability through suppressing expression of transposable elements. 10
Heterogeneous or differential methylation means that there is a large amount of methylation variation or difference among different samples of one group (eg, cancer patients) or between two groups (eg, cancer patients and normal individuals).11–14 For instance, comparing methylation ratios at each cytosine base (mC-ratio) in different cancer patients reveals heterogeneous methylation patterns. It is important to identify the genes or regions that have heterogeneous methylation patterns across different samples or patients. Generally speaking, researchers are aware of the existence of methylation heterogeneity, but it is unknown what the exact heterogeneity patterns are. It is also unclear how many genes have such heterogeneous patterns and what the impact these heterogeneous genes may have, especially in relation to cancer genes. In order to address the above questions, we conduct a bioinformatics analysis. More detailed explanations of all steps and results are introduced in the following sections.
Methods
Four metrics for methylation heterogeneity analysis
In some genomic regions, DNA methylation levels are heterogeneous across different cancer patients or samples. The heterogeneity pattern may be due to different methylation events within cancer cells. In order to gain some intuitive understanding of the methylation heterogeneity or variation patterns, we first calculate the mean and standard deviation at selected CpG sites across all cell lines. Our exploratory analysis of mean and standard deviation of the methylation levels at each CpG site reveals that most CpG sites are either fully methylated or not at all. Moreover, there is clear evidence that the methylation levels at some CpG sites are much more heterogeneous. We also find that greater variation or heterogeneity is often observed in partially methylated sites. Based on this understanding, we choose to analyze DNA methylation heterogeneity patterns using four statistical metrics: variance, I2 statistic, entropy score, and methylation state.
Variance
We calculate the sample variance of methylation levels of all samples at a CpG site and use the standard deviation to measure the variation or spread of DNA methylation levels. Large variation indicates that the methylation levels of different samples are very heterogeneous. We compare the other two quantitative metrics (see below) with standard deviation because this metric is a direct measure of variation.
I2 statistic
The I2 statistic was originally introduced by Higgins et al.15,16 to measure the impact of heterogeneity on meta-analysis. This statistic is defined based on the Cochran's heterogeneity statistic Q, that is,
Entropy score
Entropy may be used to measure the randomness and heterogeneity level among different samples and determine if methylation levels vary from person to person among cancer patients. We will calculate an entropy score for each CpG site as defined by the method named Quantitative Differentially Methylated Regions (QDMR) below.
14
Let mi = {mi,1, mi,2, …, mi,3, …, m
i,N
) be the methylation levels at CpG site i and across N samples, where m
i,s
represents the methylation level in sample s. The sum of methylation levels of CpG site i in N samples is
Methylation state
For methylation states, we categorize CpG sites into the several categories: L (Low), H (High), M (Median), and O (Other). A low methylation state (L) means that all methylation levels at a CpG site are below 0.2, and a high methylation state (H) means that all methylation levels at a CpG site are above 0.8. A median methylation state (M) means that all methylation levels at a CpG site are between 0.2 and 0.8. The CpG sites with methylation levels that do not fall in any of these three categories are defined as an O (Other) state. CpG sites of the O state are then further categorized into Bimodal, High-Medium (HM) methylation, Low-Medium (LM) methylation, and then Rest (R). A Bimodal methylation state means that over 40% of the samples at a CpG site have methylation levels below 0.2, and over 40% of the samples have levels above 0.8. A High-Median (HM) methylation state occurs when all methylation levels at a CpG site are above 0.4. A Low-Median (LM) methylation state occurs when all methylation levels at a CpG site are below 0.6. The remaining CpG sites are categorized as the Rest (R) methylation state. All methylation states are shown using example data in Figure 1. By categorizing the data with these classifications as shown in Figure 1, we can analyze the methylation heterogeneity patterns in more detail. Among all the above methylation states, we are most interested in the Bimodal and the Rest methylation states because they are the most heterogeneous, or least consistent, and therefore most likely to affect tumor suppressor genes and oncogenes.

Dot plot of methylation states.
Data and R functions
The dataset used in this project contains the methylation level for each CpG site of seven breast cancer cell lines, namely, BT20, BT474, MCF7, MDAMB231, MDAMB468, T47D, and ZR751. The DNA methylation sequencing data of these seven samples are publicly available (GSE27003). 17 The data preprocessing step is done using the methylation sequencing alignment tool BRAT-bw. 18 From our preliminary study, we know that cancer methylation levels are more heterogeneous than normal data. 12 Abnormal heterogeneous methylation patterns may cause the silencing of tumor suppressor genes and the overexpression of oncogenes. Before any statistical analysis, we process our data by extracting the CpG sites with methylation levels for more than 70% of the samples for better accuracy.
Genome datasets are enormous, and it takes time to process them. In order to analyze and interpret DNA methylation sequencing data, we have used the statistical computer language R to analyze heterogeneity patterns for DNA methylation sequencing data. To speed up the analysis, we have used a high-performing super computer with multiple nodes for parallel processing. With the obtained output files, we then run other programs to process further information, such as obtaining a list of genes that cover selected heterogeneous CpG sites.
Results
Performance of four metrics
In the last section, we illustrated the performance of the four metrics that we use to study methylation heterogeneity or variation levels. Among these four metrics, methylation state is the most intuitive one. Based on the definition of the different methylation states, CpG sites with High (H) and Low (L) methylation states have low variation, whereas Median (M) and Other (O) methylation states show more variation, which is expected. The methylation state of one chromosome (chr1) is summarized in Table 1. From Table 1, we can see that the High (H) and Low (L) states together contribute about 55% (16.33% + 38.13%) of the CpG sites. The High-Median (HM) and Low-Median (LM) states together contribute to about 17% (11.83% + 5.22%) of the CpG sites. The Median (M) state has the least number of CpG sites (only 0.19%). About 2% of CpG sites have the Bimodal pattern. The Rest state has about 26.32% of the total sites. CpG sites with the Rest state are heterogeneous but lack patterns, making it difficult to categorize them specifically. Among the seven methylation states, Bimodal and Rest have most heterogeneous patterns.
Number and percentage of CpG sites belonging to each methylation state.

Because the qualitative metric (methylation state) is the most intuitive and biologically meaningful metric, we plot the three quantitative metrics: standard deviation, I2 statistic, and entropy score against each methylation state using boxplots (Fig. 2). These plots will help us analyze how well each quantitative metric measures heterogeneity level. The two metrics standard deviation and I2 statistic produce very similar representations of heterogeneity. However, it is evident that entropy does not produce an analogous result. We then compare the entropy score with standard deviation using a plot with different methylation states highlighted with different colors (Fig. 3). Figure 3 shows that the entropy score nearly reverses the relative variation pattern for some CpG sites: High (H) and Low (L) methylation states show greater heterogeneity, while Median (M) and other methylation states show lower heterogeneity. That is, Figure 2 shows a different pattern when comparing entropy with standard deviation, and this pattern is counterintuitive.

Boxplots of quantitative metrics vs. methylation states.
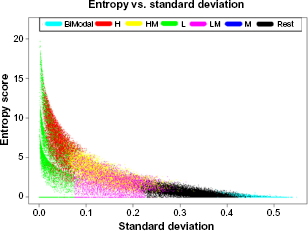
A scatterplot of entropy against standard deviation.
When the I2 statistic versus the standard deviation is graphed, there is a clear positive correlation between the two metrics (Fig. 4). The CpG sites categorized as High (H) or Low (L) have very low I2 values, which are expected because the methylation levels in these categories have a very narrow range for the values to fall into. Furthermore, the Bimodal and Rest states have high I2 statistic values. CpG sites that have a methylation state considered to be Bimodal or Rest are actually far more heterogeneous. As Table 1 shows, Bimodal and Rest states together hold a significant percentage (about 28.3% of the data) of CpG sites in each chromosome.

A scatterplot of I2 statistic vs. standard deviation.
As shown above, the entropy score gives a different and counterintuitive result. However, variance (or standard deviation), I2 statistic, and methylation state all give relatively intuitive and similar measures of heterogeneity or variation. These three metrics could be considered for measures of variability or heterogeneity across samples. For the rest of the section, we use the intuitive metric (methylation state) to consider the biological implication that heterogeneous genes may have on breast cancer.
Biological implications based on genetics and pathway analysis
Genetic analysis
Because we are specifically interested in the genes with highly heterogeneous methylation patterns, we select the CpG sites that are categorized as Bimodal and Rest methylation states. We utilize an R function written by Dr. Sun's laboratory to annotate our processed breast cancer data, generating two lists of genes with CpG sites in the body or in the promoter region. These lists are combined and repeats are omitted. We then obtain a variable that is the number of heterogeneous CpG sites associated with each gene. When checking the distribution of this variable, we find that this list of numbers ranges from 1 to 112 and that 75% of these numbers are not larger than 3. In order to ensure that the selected genes are of greater importance in relation to breast cancer, we have specified parameters in our code to select only the genes with over 25 heterogeneous CpG sites. With this selection, we further analyze the top 13.5% of heterogeneous genes. Using this particular list of genes, we utilize the ConsensusPath Database (ConsensusPathDB)19–21 to integrate interaction networks among genes, creating genetic maps for visualization of our heterogeneous gene lists. In the entire genome of breast cancer data from the 7 cell lines, there are 2618 distinct genes with at least 25 heterogeneous CpG sites that are categorized as the most heterogeneous methylation states, Bimodal and Rest. A total of 710 of these genes are related to cancer modules 22 (ie, cancer-related gene sets). We then use these genes in our further analyses. These cancer modules are identified by mining a large compendium of cancer-related microarray data. 22 To determine the link between our significant genes and their biological importance, we compare them to lists of breast cancer methylated genes, tumor suppressor genes, oncogenes, and transcription factors. This comparison indicates that of our specified gene list, 43 are known breast cancer methylated genes, 5 are tumor suppressor genes, 81 are oncogenes, and a significant 376 are transcription factors. Moreover, 44 of these transcription factors are also identified as oncogenes; therefore, if expressed, they may have a high impact on tumor growth.
We further analyze our 2618 genes with heterogeneous CpG sites and their biological significance by utilizing the gene set enrichment analysis (GSEA) that was created by the Broad Institute of MIT and Harvard. 23 This GSEA software package uses a hypergeometric distribution to compare our list of heterogeneous genes with gene lists found in Molecular Signatures Database, a collection of annotated gene sets. To ensure statistical significance, we use the GSEA default FDR (False Discovery Rate) q-values <0.05. Using “cancer modules” as “gene sets”, our GSEA analysis shows that with q-values less than 0.05, at least 173 genes are overlapped or significantly represented in the top 10 cancer modules. Examination of gene sets and their overlap can highlight common biological processes. Among 173 heterogeneous genes, 15 significantly represent in the top 10 cancer modules (Table 2). Detailed descriptions of these 15 genes can be found online in GeneCards (www.genecards.org). The numbers of the top cancer modules are listed in Table 2. These modules are gene sets that are significantly changed in various cancer conditions. 22 More detailed description of these cancer modules can be found online. 24 In addition, instead of using cancer modules as “gene sets”, we may use the KEGG pathways as “gene sets” for the GSEA. Using the KEGG pathway for GSEA, important KEGG cancer pathways and signaling pathways (eg, MAPK signaling pathway and calcium signaling pathway) are significantly represented.
Fifteen heterogeneous sample genes represented in top 10 significant cancer modules.

Tumor suppressor and breast cancer-related genetic pathways
Using the carefully chosen list of heterogeneous genes, we select 173 genes that are significantly represented in numerous important cancer modules to determine potential links between certain genes in our list and the genes related to breast cancer. Utilizing the genetic software, ConsensusPathDB, we have created an induced network module as shown in Figure 5, considering only high-confidence binary protein and gene regulatory interactions to ensure the importance of the genes' roles in relation to breast cancer. In addition to the selected heterogeneous genes of high-confidence relation, we have also included genes that regulate the cell cycle, tumor suppression, transcription factors, and cell reception, which are frequently linked with breast cancer. Abnormal methylation of these genes may lead to tumorigenesis. In order to include these genes, we first take a list of genes that are typically linked with breast cancer and then add them to the list of heterogeneous genes before running the ConsensusPathDB. By including genes that have known links to breast cancer in the network, the ability to identify a novel gene from the list of heterogeneous genes that is linked to breast cancer may increase. That is, genes that are more connected to or share pathways with a large number of genes such as oncogenes and tumor suppressor genes are also more likely in general to be linked with breast cancer, and thus, the genes that are deeply rooted in the network of known cancer-related genes may also be novel biomarkers or cancer genes. In particular, as shown in Figure 5, the TP53 gene is a tumor suppressor protein containing DNA binding and transcriptional activation domains. TP53 interacts both indirectly and directly with many of our selected genes. The TNF-alpha gene is a tumor necrosis factor involved in a wide spectrum of biological interactions, and it is mostly indirectly connected to our selected heterogeneous genes.

Tumor suppressor gene network including TP53, TP63, and TNF-alpha.
Beyond the above tumor suppressor genes, we have also formed genetic mappings between the heterogeneous gene list of 173 and known breast cancer genes of high- or intermediate-risk such as BRCA1, BRCA2, STK11, PTEN, ATM, CHEK2, MRE11A, RAD50, and NBN.25–27 Breast cancer cases are usually associated with these abnormal genes. We have limited the number of breast cancer genes by choosing those with the most evidence of their relation to cancer. Implementing the induced network module once again, we consider binary protein and gene regulatory interactions to determine biological links between our long list of potential breast cancer biomarkers and these known cancer genes. From this network, we notice a multitude of heterogeneous genes directly linked to high-risk breast cancer genes, especially those in the top right section of Figure 6. Abnormalities in these genes are likely to affect gene and protein interactions and biological functions, thus giving a high potential for affecting and indicating breast cancer in a patient.

Breast cancer susceptibility of high- and intermediate-risk genetic mapping.
Hub genes and potential biomarkers for breast cancer
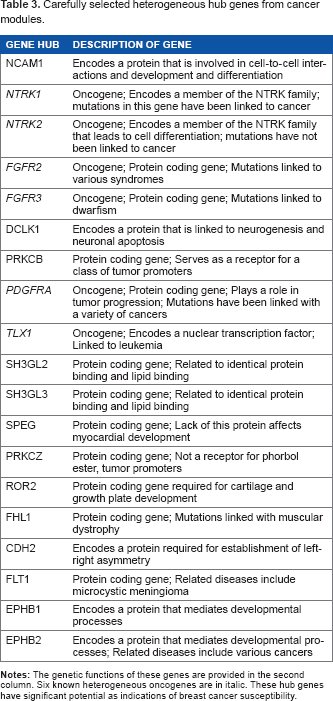
By selecting heterogeneous genes that show up most significantly in a greater number of cancer modules, we obtain a longer list of 271 genes. We then remove intermediate nodes, focusing only on the original data to discover hub genes as shown in Figure 7. In Figure 7, the number of interactions ranges from 1 to 8. We define hub genes as heterogeneous oncogenes that interact with six other genes. Therefore, we select approximately the top 25% of interactive genes, which likely lead to greater potential consequences due to increased relations. Genes that indicate potential effects in multiple cancer modules are more likely indicators of the breast cancer itself. In Figure 7, 12 indicated oncogenes are found among our prespecified heterogeneous genes. We notice that 6 of these 12 (or 50%) oncogenes are identified as hub genes. The hub genes may have strong potential as breast cancer biomarkers and are listed along with their functions in Table 3. Our results show a relatively strong correlation between heterogeneous oncogenes in breast cancer cell lines and their roles as hub genes.

Networks for hub genes and potential biomarkers for breast cancer.
Carefully selected heterogeneous hub genes from cancer modules.
Discussion
We focus part of our research on the comparison of metrics both quantitatively and qualitatively. It is intuitive that the qualitative methylation states of H, L, HM, and LM have relatively less variation than the Median, Bimodal, and Rest states, but it is not quantitatively clear how large the variation of reach methylation state is and how different several methylation states are. In addition, as shown in the QDMR paper, the entropy seems to be a good method of identifying differential methylation regions or characterizing the heterogeneity patterns of methylation levels. However, when we zoom in to investigate the performance of the entropy score, we find the surprising and counterintuitive results of QDMR entropy. This has sparked our interest in evaluating other quantitative metrics and comparing them with the intuitive qualitative metric of methylation states, as shown in Figure 2.
As for methylation states, we define them based on our understanding of the methylation sequencing data. We did some exploratory analysis as shown in Figure 1 of our previous publication at the International Journal of Biomedical Data Mining. 12 According to Figure 1 and in theory, the Low (or L) methylation state should be around “0”. In addition, considering that there may be methylation sequencing quality issues and large variation due to unknown reasons, we define it to be [0, 0.2]. Similarly, we define the High (or H) methylation state to be in the range of [0.8, 1].
Methylation, as a component of normal cellular ontogeny, likely plays a critical role in facilitating tumor cell progression. Because methylation, especially hemimethylation (methylation only on one DNA strand 28 ), can be ephemeral in nature, it is sometimes used to explain sudden changes in metastatic abilities. Variation in DNA methylation, which is related to eukaryotic gene control, may play a major role in the heterogeneity and phenotypic instability found in cancer cells. Random somatic mutational events, which are responsible for heterogeneity and are exemplified by the Bimodal and Rest methylation states, could reinforce increasingly malignant tumor cells and less responsive states due to increasing genetic alterations. 29 In addition, increased epigenetic heterogeneity in cancer could support cancer cells in rapidly adapting to changing environments. 30
Conclusion
In this paper, we have studied the methylation heterogeneity patterns for breast cancer cell lines by comparing four metrics: variance, I2 statistic, entropy score, and methylation state. After performing a comparative analysis on the effectiveness of each metric, we have used the categorical metric (methylation state) to extract genes with the most heterogeneous states (namely, Bimodal and Rest), which we run through the GSEA software to sort the genes in relation to cancer modules. 22 We have compared the list of Bimodal and Rest heterogeneous genes with numerous data sets to determine the number of known breast cancer methylated genes, tumor suppressor genes, oncogenes, and transcription factors found in the heterogeneous gene list. A significant number (376) of the entire gene list is transcription factors. Moreover, 44 of these transcription factors are also identified as oncogenes; therefore, if expressed, these genes may have a high impact on cancer development.
After selecting genes represented in the highest number of related cancer modules, we have utilized the publicly available software ConsensusPathDB to analyze integrated gene networks. These networks display significant selected heterogeneous genes that are linked in biological functions to tumor suppressor genes and high- and moderate-risk known breast cancer genes. Furthermore, we merge our results from GSEA and ConsensusPathDB to determine a link between heterogeneous oncogenes and hub genes, or genes that interact with at least six separate genes from the cancer modules. Therefore, the more cancer modules in which a gene has effect, the stronger its indication of breast cancer. Using this information, we conclude that a considerable percentage of heterogeneous known oncogenes are also hub genes, determining 19 potential breast cancer biomarker genes. These 19 genes are a contribution to the genetic databases PubMeth (pubmeth.org) and GeneCards (genecards.org), as well as cancer treatment and screening for early detection among breast cancer patients.
Our results provide a substantial contribution to the growing databases of breast cancer-related genes, which can be used during early treatment and screening of patients to discover certain genes that may have an important impact on breast cancer. Our results also show a significant correlation between heterogeneous oncogenes and hub genes (the potential biomarkers) that other cancer researchers and doctors may find useful when locating cancerous genomic regions.
Author Contributions
Conceived and designed the experiments: SS. Analyzed the data: ST, KB, LY. Wrote the first draft of the manuscript: ST, KB, LY, SS. Contributed to the writing of the manuscript: ST, KB, LY, SS. Agreed with manuscript results and conclusions: ST, KB, LY, SS. Jointly developed the structure and arguments for the paper: ST, KB, LY, SS. Made critical revisions and approved the final version: SS. All the authors reviewed and approved the final manuscript.
Footnotes
Acknowledgment
We appreciate the support provided by our IT colleagues and the MathWorks staff members at Texas State University.