
Abstract
Introduction
Breast cancer being a multifaceted disease constitutes a wide spectrum of histological and molecular variability in tumors. However, the task for the identification of these variances is complicated by the interplay between inherited genetic and epigenetic aberrations. Therefore, this study provides an extrapolate outlook to the sinister partnership between DNA methylation and single-nucleotide polymorphisms (SNPs) in relevance to the identification of prognostic markers in breast cancer. The effect of these SNPs on methylation is defined as methylation quantitative trait loci (meQTL).
Materialsand Methods
We developed a novel method to identify prognostic gene signatures for breast cancer by integrating genomic and epigenomic data. This is based on the hypothesis that multiple sources of evidence pointing to the same gene or pathway are likely to lead to reduced false positives. We also apply random resampling to reduce overfitting noise by dividing samples into training and testing data sets. Specifically, the common samples between Illumina 450 DNA methylation, Affymetrix SNP array, and clinical data sets obtained from the Cancer Genome Atlas (TCGA) for breast invasive carcinoma (BRCA) were randomly divided into training and test models. An intensive statistical analysis based on log-rank test and Cox proportional hazard model has established a significant association between differential methylation and the stratification of breast cancer patients into high- and low-risk groups, respectively.
Results
The comprehensive assessment based on the conjoint effect of CpG–SNP pair has guided in delaminating the breast cancer patients into the high- and low-risk groups. In particular, the most significant association was found with respect to cg05370838–rs2230576, cg00956490–rs940453, and cg11340537–rs2640785 CpG–SNP pairs. These CpG–SNP pairs were strongly associated with differential expression of
Conclusions
Thus, the analysis based on DNA methylation and SNPs have resulted in the identification of novel susceptible loci that hold prognostic relevance in breast cancer.
Introduction
Variation in gene expression transforms cellular programming from normal to diseased state. The multiple genetic circuits within a cell create a characteristic signature profile of gene expression endorsing each cell a unique identity. These gene expression-based signatures have been successfully implemented in classifying breast cancer into different subtypes.1,2 Similarly approaches based on genome-wide DNA methylation profiling identified breast cancer-specific methylation signatures that correlate with specific clinical outcomes.
3
In addition to diagnostic potential, aberrations in DNA methylation profile regulate gene expression, dictating tumor recurrence and overall survival (OS) in breast cancer and their subtypes.4–9 The prognostic potential of genes, mainly
Genome-wide association studies (GWASs) have identified a large number of genomic variants associated with complex diseases, including breast cancer.15–17 However, most of the disease-associated genomic variants that have been reported in the literature so far are predominantly located in the intergenic or intronic regions of the genome. 18 Furthermore, numerous studies have noted that GWAS haplotypes are enriched in regulatory elements that are concordant with the disease phenotypes. 19 Therefore, it is highly likely that most of the disease-causing genomic variations act by altering gene regulation, such as transcription factor binding and DNA methylation, rather than directly affecting protein function.
Despite the advances in sequencing and availability of multi-omics data sets,20,21 finding causative and prognostic genetic variants for complex diseases, such as breast cancer, remains challenging. Thus, a robust method of associating genomic variants, such as SNPs, in regulatory regions, such as CpG islands, with corresponding DNA methylation alterations is required. 22 The influence of these genetic variants on DNA methylation level was referred to as cis-methylation quantitative trait loci (cis-meQTLs).23,24 Here, we report the joint effect of meQTLs on clinicopathological variables for the identification of prognostic biomarkers, their clinical validity, and the extent to which they capture the pathological difference between breast cancer prognostic groups using these external independent studies.
Materials and Methods
Data Set Retrieval from TCGA Repository
Genotype and epitype data for breast invasive carcinoma (BRCA) were obtained from the Cancer Genome Atlas (TCGA) consortium. In total, 746 DNA methylation, 1076 SNP array, and 1035 clinical sample details for tumors were obtained from TCGA. Besides, RNAseq data set for 1056 tumors and 112 matched normal samples were also retrieved to study the effect of methylation and genotype on fold change (FC) in gene expression.
Illumina 450 k DNA Methylation Data
Level 3 data set pertaining to 746 tumor samples, such that 740 were obtained from the primary tumor, while the remaining six samples pertaining to metastatic class were filtered out. Each of these normalized data sheets incorporated the details for genomic coordinates and beta values for each CpG site, while the associated gene information was optional. Sixty-five non-random SNPs were excluded, and 485,512 CpG sites were processed for further studies. These methylation files were processed to interrogate the SNPs associated with each CpG locus. The entire set of SNPs information were based on the Affymetrix Genome-Wide Human SNP Array 6.0 genotypic platform.
Affymetrix SNP Array Data Set Preparation
Level 1 SNP array data were normalized, and the genotype call for each sample was based on the “Corrected Robust Linear Model with Maximum Likelihood Distance” algorithm. 25 The algorithm estimates the genotype using linear mixture model, and for each SNP-genotype combination, the uncertainty parameter was corrected using HapMap samples. In order to process the large data set, the crlmm package was substantiated with ff package to reduce memory footprint (http://cran.at.r-project.org/web/packages/ff/index.html). The algorithm was implemented to decode the genotype calls for SNPs as 1 (AA/Reference allele), 2 (AB/Heterozygous allele), and 3 (BB/Alternate allele). The genotype calls at the threshold of 0.05 were filtered, while those having more than 25% low-confidence calls were excluded. Data normalization and filtration resulted in 905,422 variants.
RNAseq Data Set Preparation
Level 3 RNAseq data set for gene expression was processed, and quality control was brought about by Broad Institute TCGA workgroup (http://gdac.broadinstitute.org/). The reference gene transcript set was based on HG19 UCSC track (http://hgdownload.cse.ucsc.edu/downloads.html). Furthermore, MapSplice was used to carry out the alignment, and the quantification was done using RNA-Seq by Expectation-Maximization (RSEM).26,27 Finally, the upper quantile normalized RSEM count estimates were downloaded.
Procedure for the Identification of CpG–SNP Pair Associated with the Prognosis in Breast Cancer
Figure 1 outlines the procedure for the identification of regulatory CpG–SNP pair involved in the risk associated with the survival of breast cancer patients. The details are described in the following steps.

Detailed outline for identifying a significant effect of CpG–SNP pairs on the overall survival. It also includes in finding the candidate risk SNPs in the breast cancer prognosis. The individual CpG sites and SNPs have also been correlated with the gene expression. This process utilizes DNA methylation, SNP array, RNAseq, and clinical data.
Step 1
About 660 tumor samples overlapping with DNA methylation, SNPs, and clinical data set were randomly split into training and test models in order to study the synergistic effect of methylation and associated SNPs on survival of breast cancer patients (Fig. 2A). The caret package of R (http://caret.r-forge.r-project.org/) was implemented to group 3/4 of samples (486) into training and 1/4 (164) as testing based on the vital status (dead or alive) of the patients outlined in the clinical data set (Fig. 2B).

(A) Venn diagram details about the DNA methylation, SNP array, and clinical samples across the tumor patients. (B) The tumor sample overlapping across the three data sets is grouped into the 75% training set and 25% test set based on the vital status.
Step 2
The training model was built across 486 samples for each of the 7970 CpG–SNP pairs located at 50 nt upstream of downstream of CpG sites. The significant association between the beta value with respect to each CpG site and the variable genotype associated with each SNP was computed based on the non-parametric one-way analysis of variance (ANOVA). Here, the β-values were modeled as a linear function with respect to alleles (AA, AB, and BB). The complete analysis was carried out at
Step 3
Each of the differentially methylated CpG sites from step 2 was further analyzed to speculate their effect on gene expression. Spearman's correlation test could establish the effect of methylation on log2-tranformed FC in gene expression, such that FC = log2 (
Step 4
For each of the CpG–SNP pairs from step 2, SNPs were evaluated to visualize their significant effect on gene expression. We extracted the variable genotype (AA, AB, BB) associated with each SNP and log2-tranformed FC in gene expression. One-way ANOVA was applied to assess the statistical significance between each SNP genotype and its neighboring gene expression. 28 Moreover, the mean FC in gene expression was calculated with respect to the genotype associated with each SNP. This association between the differential gene expressions with respect to allele was labeled as expression quantitative trait loci (eQTLs).
Step 5
Each of the significant CpGs from CpG–SNP pairs obtained from step 2 was further evaluated for their association with the risk to the OS of the breast cancer patients. The complete analysis was based on the univariate and multivariate Cox proportional hazard (PH) models.29–31 The survival analysis was based on the clinical details in the form of vital status (patient alive or dead) and the date for the last follow-up and days to death. Besides, the SNPs from the overlapSelect were exclusively evaluated for their effect on OS. The training model was built for each of the SNPs across 486 patients. The findings in the training model were validated in the test model. Complete analysis was carried out based on the log-rank test. All the significant SNPs identified in the test model were subjected to multivariate Cox regression analysis to visualize their cumulative effect on OS.
Results
Identification of Methylated Probes or Loci Differing in Genotypes
In this analysis, we mainly elaborate the pattern of polymorphic allele distribution (
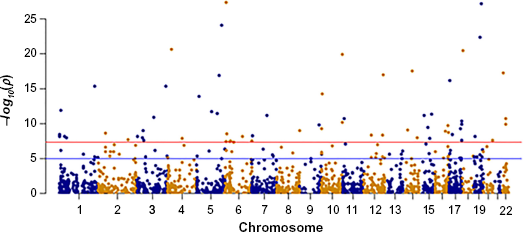
Dots within the Manhattan plot display the identification of significant SNPs in the vicinity of CpG site leading to the meQTLs in the test model; the x-axis represents genomic position of SNPs, while the y-axis represents the –log
In particular, the association of breast risk alleles, rs1570056 and rs11154883, with DNA methylation levels (cg18287222) and

Breast cancer SNPs rs1570056 and rs11154883 are associated with differential CpG methylation. Cis-association between the SNPs (A) rs1570056 and (B) rs11154883 regulates the methylation of CpG probe cg18287222. These SNPs are at loci within an intron variant of
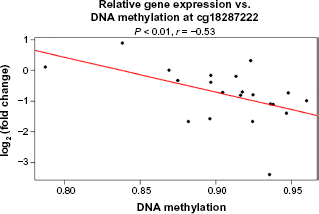
Spearman's correlation with respect to FC in gene expression and DNA methylation in breast cancer, (a) DNA methylation residuals at probe cg18287222 is negatively associated (

FCs in gene expression with respect to variable genotype was identified to be significant at
Prognostic Potential of Differentially Methylated CpGs on Survival of Breast Cancer Patients
Breast cancer has displayed an increasing incidence, and more importantly, the steady mortality rate in a past decade. While the clinical screening has attributed to the enhanced survival of breast cancer patients, still improvised markers are required to assess accurately patient prognosis at the time of diagnosis. The disease heterogeneity and limited specificity and the clinicopathological variables are used in prognostication and staging of breast cancer. Thus, the development of complementary biomarkers with more specific prognostic potential will allow to assess the risk of developing recurrent and/or metastatic disease. We report for the first time the association between the differentially methylated CpG site and OS of breast cancer patients. Univariate and multivariate Cox PH regression analyses have been implemented to establish the prognostic potential of differentially methylated CpGs. Of the total 7970 overlap CpG–SNP pairs, 489 CpGs were identified to be significantly associated with the survival of breast cancer patients in the training model. The prognostic potential of these CpGs was validated in the test model of 164 patients.
To test the association of risk in 164 breast cancer patients for OS, we first began our analysis using univariate Cox PH model. On evaluating 489 CpGs based on the clinicopathological variables of vital status and last follow-up days, 18 covariates were found to be significantly associated with OS of breast cancer patients in the test model. The most significant association with OS was observed for cg04003327: rs1054641 on chromosome 2q37.3 (hazard ratio [HR] = 0.01, additive
Univariate analysis to depict the associations between differentially methylated CpGs and the overall survival of the breast cancer patients.

The univariate analysis was followed by the multivariate regression model to assess the risk associated with 18 co variables validated in the test model obtained from the univariate study. This multivariate Cox PH analysis leads to the identification of eight CpGs having a significant association with OS of the breast cancer patients (Table 2). Among these, the most substantial findings were observed for cg04003327 (HR = 0.016; 95% confidence interval [95% CI] = 0.0003–0.86;
Summary for univariate and multivariate analyses of the associations between the CpGs and the overall risk based on the Cox PH model.


Kaplan-Meier plot associated with CpGs to classify 164 tumor patients (test set) into high- (84 patients) and low-risk (84 patients) groups, respectively, at a threshold
Besides, the exclusive effect of SNPs was also evaluated on OS of breast cancer patients. In the following section, we explain about the variable allele distribution and their association with OS.
Probing the Association of SNPs with OS of Breast Cancer Patients
Genetic variation characterized by single-nucleotide polymorphism (SNP) offers promising surrogate biomarkers to predict therapeutic responses and prognosis in breast cancer patients. In this study, we investigated the risk associated with the individual SNP and in cumulative fashion on the OS. A probabilistic framework was developed for predicting and prioritizing the candidate SNPs in the training data set and validated across test set constituting 164 samples. The complete survival analysis was based on the homozygous dominant and recessive allele and heterozygous allele distribution available for each SNP.
The univariate survival analysis associated with the individual SNP was based on the log-rank test at a threshold
Summary of SNPs associated with OS of breast cancer patients using log-rank test.

The Kaplan-Meier plot for the significant SNPs having nearly equal genotypic frequency is displayed in Figure 8. While the presence of heterozygous allele “GA” associated with SNP rs10101376 is detrimental, the homozygous dominant alleles “CC” and “TT” concomitant with SNPs rs140679 and rs1538146 affect the survival of the breast cancer patient at a threshold

Kaplan–Meier survival plot for SNPs: (A) rs10101376, (B) rs140679, and (C) rs1538146. The survival analysis has been done with respect to reference (solid black line), heterozygous (red dotted line), and alternate alleles (solid green line) at a threshold
Summary of univariate and multivariate analyses of SNP associations with overall risk based on the Cox PH model.

Finally, conjoint analysis of 23 SNPs was carried out to assess the cumulative effect of the genetic variant on OS. We performed multivariate Cox regression analysis between the SNPs and clinical variance. Of the total 23 variables from log-rank test, 16 SNPs in the test model could classify the patients into high- and low-risk groups, respectively, at a threshold

Kaplan-Meier curve associated with (A) top 16 SNPs and (B) top 9 SNPs (listed Table 3) in classifying 164 tumor patients (test set) into high- (84 patients) and low-risk (84 patients) groups at a threshold of
Discussion and Conclusions
Molecular understanding of intertumor heterogeneity is key to effective cancer treatment and personalized medicine. Analysis of high-throughput molecular profiling data has revealed the extent of intertumor heterogeneity in breast cancer. The identification of different levels (subtypes) of tumor heterogeneity and the most appropriate treatment strategies for each subtype is expected to radically improve the treatment practices for the optimal clinical management of breast cancers. 33
GWASs have led to the identification of a large number of genetic variants that confer susceptibility to different types of cancers. However, the risk conferred by an individual variant is not sufficient to uphold the individual risk prediction. Assessing the genetic variability by incorporating multiple SNPs into a predictive model could achieve improved risk discrimination that may be useful for prognostic stratification of breast cancer patients.34,35 It is often a challenge to assess the functional impact of non-coding genetic variants, for example, the effect of SNPs transcriptional activity and the associated disease risk.
Questions still remain for the prognostic biomarkers identified for cancer using data-mining approaches. The first question is that there is little overlap among numerous prognostic signatures generated from different studies. Another question is that most signatures generated do not have clear biological meanings as why these prognostic genes may affect patient outcome, which leads to the clinical application of such signatures still under debate. In this study, we developed a novel method to identify prognostic gene signatures for breast cancer by integrating genomic and epigenomic data. This is based on the hypothesis that multiple sources of evidence pointing to the same gene or pathway are likely to lead to reduced false positives. We also apply random resampling to reduce overfitting noise by dividing samples into training and testing data sets. In this analysis, TCGA BRCA overlapping data set between DNA methylation, Affymetrix SNP array, and clinical samples were randomly divided into two subsets based on the vital status obtained from clinical data. The predictive model was trained based on certain features, mainly the beta values and genotypes associated with methylation and SNP, respectively. The robustness of the features were evaluated statistically in the training subset and validated in an exclusive and independent test subset. The significant association between methylation and genotype was calculated based on one-way ANOVA at a threshold
Studies done so far correlate with the conjoint effect of significant CpG–SNP pair in regulating the differential methylation and OS of breast cancer patients. Recent studies have illustrated the upshot of genetic variants in regulating the overall risk associated with breast cancer patients. However, the cumulative effect is still to be disclosed. In the next section, we detailed about the prognostic potential of individual SNP and their cumulative action. In our study, we have comprehensively analyzed the TCGA SNP array data mapped to methylated loci and concomitantly evaluated its association with the breast cancer survival. Of the total 7970 CpG–SNP pairs, 492 SNPs in the training model were predicted to be significantly associated with OS. However, the univariate analysis based on the log-rank test mapped 23 SNPs to be significant across the test data set. Most of these SNPs have been highlighted in GWASs. In this study, we have mainly displayed Kaplan-Meier plot for the SNP having higher and nearly equal allelic distribution in breast cancer population. The heterozygous allele “GA” associated with SNP rs10101376 is detrimental and is related to poor prognosis. Similarly, the homozygous dominant allele “TT” linked to rs140679 SNP disrupts the mRNA expression of GABA A receptor (GABRG3)
56
and subsequently deteriorates survival probability in breast cancer patients. Presence of homozygous genetic variant “TT” with respect to SNP rs1538146 at 1349 bp upstream of
In summary, the comprehensive assessment of CpG–SNP pairs has led to the identification of loci that hold the risk to the OS of breast cancer patients. The novel findings are highly promising and strongly support the identification of these loci in the clinical visualization of breast cancer progression. Such prognostic scans at the genome-wide level will likely be not only beneficial for the identification of novel prognostic biomarkers but will also open a new horizon to the novel pathways involved in breast cancer progression, directing to the potential targets for more efficient treatment strategies.
Author Contributions
Conceived and designed the experiments: SKP, RVD. Analyzed the data: AS, YB, SJ. Wrote the first draft of the manuscript: AS. Contributed to the writing of the manuscript: YB, SJ, RVD. Agree with manuscript results and conclusions: SA, YB, SJ, SKP, RVD. Jointly developed the structure and arguments for the paper: AS, YB, SJ, RVD. Made critical revisions and approved final version: YB, RVD. All authors reviewed and approved of the final manuscript.