
Abstract
Recent method development has included multi-dimensional genomic data algorithms because such methods have more accurately predicted clinical phenotypes related to disease. This study is the first to conduct an integrative genomic pathway-based analysis with a graph-based learning algorithm. The methodology of this analysis, graph-based semi-supervised learning, detects pathways that improve prediction of a dichotomous variable, which in this study is cancer stage. This analysis integrates genome-level gene expression, methylation, and single nucleotide polymorphism (SNP) data in serous cystadenocarcinoma (OV) and colon adenocarcinoma (COAD). The top 10 ranked predictive pathways in COAD and OV were biologically relevant to their respective cancer stages and significantly enhanced prediction accuracy and area under the ROC curve (AUC) when compared to single data-type analyses. This method is an effective way to simultaneously predict binary clinical phenotypes and discover their biological mechanisms.
Keywords
Introduction
The wealth of publicly available genomic data can be more greatly leveraged if more than one genomic data type is available per patient. For example, genomic data types like copy number variations (CNVs), single nucleotide polymorphisms (SNPs), DNA methylation levels, and microRNA (miRNA) expression can all inform gene expression or function. Integrating these genomic data types into a single model can better inform researchers about the nature of the gene networks, functional pathways, and biological interactions involved in disease. Each genomic data type used in an integrative method gives information on a different aspect of biology, such as mutation, regulation, and expression. Integration of these data types, which are functionally connected, can form a more biologically realistic model and enhance the accuracy of integrative models’ predictions. The Cancer Genome Atlas (TCGA) 1 contains such a set of multiple genomic data types for several cancers like serous cystadenocarcinoma (OV) 2 and colon adenocarcinoma (COAD) 3 used in this study. TCGA datasets have been the data source of many recent investigations into how to best leverage the integration of multiple genomic data types to discover new biological connections.4–6
Integration of multiple genomic data types has been used to build interaction7,8 and coexpression networks
9
of genes that have biological significance to cancer. Genes in these networks were tested for overrepresentation within a biological pathway, revealing important cancer mechanisms. Pathway analysis integrating genomic data types has previously been performed by testing individual genes to infer pathway activities and rank pathways.
10
It has also been performed by pathway-based analyses on single data types followed by Fisher's method to combine the results into a single
The method presented herein is the first to integrate multiple genomic data types with graph-based learning in a pathway-based manner, which utilizes the entire pathway instead of single genes or the entire set of genes in the dataset. Unlike other integrative methods, pathway-based analyses ask not only how well these data types perform as a binary classifier but also what biological mechanisms underlie the differences between the two classes. Pathway-based analyses also have the advantage of incorporating prior biological knowledge, 12 unlike methods whose results are used to find relevant pathways by overrepresentation of significant genes. This prior knowledge has been advocated for genomic analyses by Chasman, 13 Peng et al, 14 and Ritchie. 15 Pathway-based analyses also reduce computational burden and increase the interpretability of the results. 16 To identify significant pathways, previous studies evaluated all individual genes either to build a custom pathway via their relationships or to evaluate differential expression or overrepresentation within known pathways. This is the only known study of multi-dimensional genomic data to perform graph-based classification at a pathway level.
Unlike Tsuda et al, 17 the integrative pathway analysis algorithm uses data from the set of genes in a pathway, not from the entire genome. Pathway analysis produces a computational benefit in reducing complexity and makes the results more interpretable by incorporating prior biological knowledge. 16 It uses a Monte Carlo hold-out internal validation method. It accepts Spearman correlation (not presented) and Gaussian kernel distance weight matrices. It also accepts patient-level data useful in clinical studies both to classify patients and to discover biological mechanisms.
Integrative pathway analysis was conducted on OV and COAD datasets to predict stage and determine the biological mechanisms underlying advancing stage. The algorithm allows these pathways to be ranked based on the predictive power of multiple –omics data types. As the first integrative genomic study on COAD, pathways not previously described as advancing stage are presented.
Materials and Methods
Datasets
The pathway dataset includes 171 KEGG 18 pathways and 347 BioCarta 19 pathways. Data from TCGA 1 were at level 3. This means methylation data are a probe's beta value [0,1]; gene expression data are an average of all probes covering a gene; and SNP is a mean value of all probes in a segmented chromosomal region. Genes within a segmented chromosomal region were given that region's value.
Patients included in the analysis of the OV dataset were limited to those with all of the following: Illumina Infinium HumanMethylation27 data, Agilent Human Genome CGH 1 x 1 M CN data, Agilent 8 x 15 K human miRNA-specific data, Agilent 244 K Custom Gene Expression Array G4502A-07 data, and Affymetrix Genome-Wide Human SNP Array 6.0 data. Patients also had to have known cancer stage. Patients who met all these criteria were grouped into advanced (stage IV, n = 80) and non-advanced (stages IA–IIIB, n = 70) stages.
Patients included in the analysis of the COAD dataset were limited to those with known cancer stage and all of the following: Illumina Infinium HumanMethylation27 data, Agilent 244 K Custom Gene Expression Array G4502A-07 data, and Affymetrix Genome-Wide Human SNP Array 6.0 data. To create two nearly equal size groups, patients who met all these criteria were grouped into early (stages IA–IIB, n = 83) versus late (stages III–IVA, n = 61). Cancer stages are often classified or dichotomized as either “advanced” vs “non-advanced” stage of disease or “early” versus “late” stage of disease. Both allow researchers to better understand the disease mechanisms. Here we demonstrate two different ways to dichotomize the two diseases of interest.
Algorithm
The algorithm was run with one and three data types. The algorithm for single data-type analysis differs from the algorithm for integrative analyses in that no weighting of data types is used, as described below.
In graph-based semi-supervised learning, the set of patients is denoted as a vector
For the patients in the test set,
Let the following be
The algorithm's output is a vector
To classify each patient in
The implementation of this algorithm was written in R version 2.14.0 using nonlinear optimization to find the optimal network weights.
Analytical strategy
The value of parameter
Accuracy of
To select the best distance measure between Pearson correlation and Gaussian kernel distance, two comparisons were made between the distances: OV accuracy and OV AUC. Five runs of the data were performed using different seeds to determine the training and validation sets. For the OV dataset, the runs consisted of the integrated analysis and individual analyses of gene expression, methylation level, and SNP data. The best distance measure for a comparison had both the integrative analysis with the most pathways above the threshold, and the integrative analysis with the most pathways both exceeding the threshold and exceeding the accuracy or AUC of all the one data-type analyses in at least three of five runs.
Significant pathways were determined over 50 runs. For OV and COAD, the integrated analysis and individual analyses of gene expression, methylation, and SNP data were compared. Significant pathways have two criteria. First, the integrative analysis exceeds a mean accuracy of 55% or a mean AUC of 0.55. Second, the mean of the integrative analysis measure (accuracy or AUC) minus the 97.5% lower confidence interval (LCI) using the standard error of the integrated measure (accuracy or AUC) over 50 runs must exceed the mean of each of the one data-type analysis measures. Pathways are ranked by the minimum difference between the LCI of the integrative measure and the mean of any single data-type measure.
Results and Discussion
Initial testing
The value of parameter c was determined by testing a glioblastoma multiforme dataset from TCGA. c = 25 was chosen as the value for all analyses, because it most frequently had the highest accuracy and AUC over five seeds in 20 pathways with 15–70 genes (data not shown). The main integrated analysis for OV and COAD included SNP, methylation, and gene expression data. Gaussian and Pearson distance measures were compared over five OV runs, as described in the Materials and Methods section. The results are as follows: 31 versus 9 pathways, respectively, with accuracy greater than 60%. Overall, 81 versus 55% of these pathways, respectively, had at least three of five runs where integrative accuracy exceeded all single data-type accuracies. The Pearson versus Gaussian AUC comparison results are as follows: 184 versus 95 pathways, respectively, with AUC ≫0.6. In all, 86 versus 58% of these pathways had at least three of five runs where integrative AUC exceeded all single data-type AUCs. Hence, Pearson correlation was a better measure for the OV dataset. Additionally, Pearson correlation has previously been successfully used in both pathway analyses 23 and other methods of data integration.7,10 Thus, Pearson correlation was chosen as the distance measure for this algorithm.
COAD analyses
Patients were grouped into early stage (stages IA–IIB) and advanced stage (stage III to IVA) classes for pathway-based prediction. Pathways significantly improved by integrative analysis were discovered and ranked as described in the Materials and Methods section. There were 29 significant pathways found using accuracy and 22 using AUC. The biopeptide and Fc epsilon receptor I-mediated signaling pathways were significant in both accuracy and AUC measures. Fc epsilon receptor I may affect stage by inhibiting colorectal adenocarcinoma cell growth. 24 Biopeptide pathway genes may affect stage through colon cancer cell growth 25 and general tumor suppression. 26
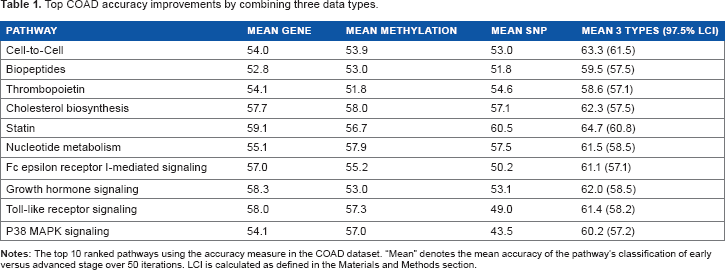
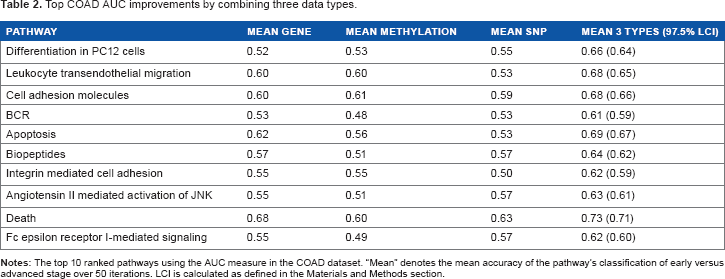
The remaining top 10 pathways from the accuracy (Table 1) and AUC (Table 2) analyses were shown to be biologically relevant to colon cancer stage as follows. The stage can be advanced through metastases spread by migration or motility, tumor growth by cell proliferation, failure of apoptosis, failure of cell cycle arrest, and other mechanisms.
Top COAD accuracy improvements by combining three data types.
Top COAD AUC improvements by combining three data types.
In Table 1, cell-to-cell pathway function is related to stage and its genes individually are related to stage through their expression and their mediators.27,28 The P38 MAPK signaling pathway regulates increase in stage through cell migration, apoptosis, and extravasation.29–31 Growth hormone signaling pathway genes are correlated with stage through apoptosis and cell cycle arrest.32,33 Toll-like receptor signaling pathway gene mutations are associated with stage through cancer growth and neoplastic progression. 34
High concentrations of cholesterol are associated with more advanced stage; 35 thus, the cholesterol-lowering statin pathway could inhibit progression by inhibiting the growth of cancer cells 36 and decreasing polyp number and size. 37
In Table 2, the differentiation pathway drives stage through its MAPK genes and cell cycle regulators.29–31 The apoptosis and death pathways, which have many of the same genes, are related to stage through their roles in progression. 39 The transendothelial migration, integrin-mediated cell adhesion, and cell adhesion molecule pathways are interrelated by common genes and/or functions. They affect stage through metastasis, migration, and apoptosis.40–42 Angiotensin II increases stage through its influence on tumor growth, invasion, and metastasis.43,44
Serous cystadenocarcinoma (OV) analyses
Patients were grouped into early stage (stages IA–-IIIB) and advanced stage (stage IV) classes for pathway-based prediction. Pathways significantly improved by integrative analysis were discovered and ranked as described in the Materials and Methods section.
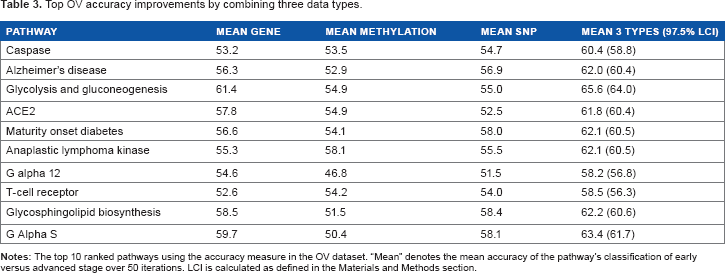
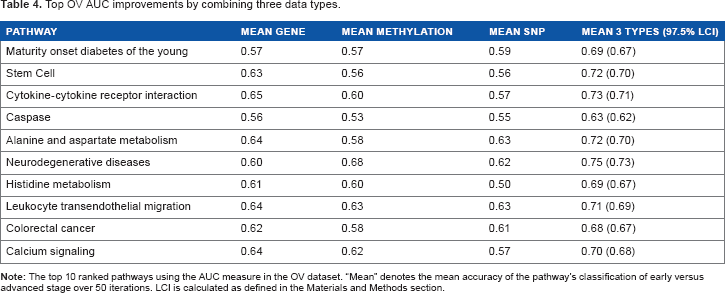
There were 63 significant pathways found using accuracy, and there were 192 significant pathways using AUC. The caspase and maturity onset diabetes of the young pathways are common to the top 10 pathways in both accuracy (Table 3) and AUC (Table 4). Caspases affect stage through apoptosis. 45 Ovarian cancer patients with diabetes are more likely to be diagnosed at a higher stage and have shorter survival time. 46 Estradiol synthesis 47 and overexpression in the glycolysis pathway 48 are underlying factors. The insulin receptor tyrosine kinase called anaplastic lymphoma kinase (Table 3) controls proliferation and apoptosis in ovarian cancer.49,50
Top OV accuracy improvements by combining three data types.
Top OV AUC improvements by combining three data types.
In Table 3, the
Alzheimer's disease pathway genes are linked to previously described roles in ovarian cancer, such as insulin metabolism, caspases, and immune response. More than 60% of the genes in this pathway and 87% in the neurodegenerative disease pathway (Table 4) are apoptosis related. 54
Figure 1 is an example of the network graph of a test set

Caspase pathway validation network in OV. This figure represents the network of patients discovered in testing the caspase pathway in ovarian cancer. Nodes represent patients. The top 200 weighted edges are shown. Weights were determined using α and Pearson correlation coefficients of the integrated data types. Light gray nodes are incorrect integrative method predictions. Medium gray nodes are correct predictions by all data types. Dark gray nodes are correct integrative method predictions and at least one incorrect single data-type prediction.
In Table 4, the leukocyte transendothelial migration pathway is associated with the survival phenotype in multiple tests and studies. 55 Colony stimulating factors in the stem cell pathway give a poor prognostic outlook regarding stage and survival. 56 Interleukins regulate anchorage-independent growth, proliferation, and invasion. 57 The cytokine-cytokine receptor interaction pathway is enriched in patients with long survival time. 58 Ovarian cancer proliferation is stimulated by calcium signaling. 59 A great majority of colorectal cancer pathway genes drive stage, as they are Wnt, 54 caspase, 45 and diabetes related. In all, 46 55% of top-ranked OV pathways advance cancer stage by apoptosis and 44% by cell proliferation. The top pathways in Tables 2 and 4 have the greatest difference between the larger AUC of the integrative analysis and the smaller AUC of the single data-type analyses.
Figure 2 demonstrates this fact for “maturity onset diabetes of the young” (Table 4). This pathway is a clear example of the relationship between exemplary prediction and underlying biology with regard to cancer stage. This top pathway in AUC and accuracy is known to advance ovarian cancer stage. 46
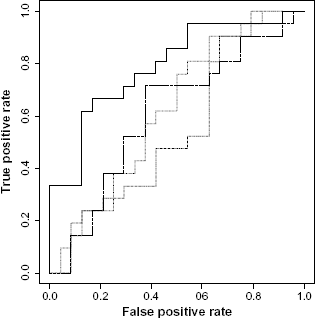
ROC curves for OV pathway Maturity Onset Diabetes of the Young.
We may observe that there may not be a high number of pathways that overlap between top pathways within each disease dataset. Accuracy measure is based on a single cutoff while AUC looks at the area under the ROC curve across multiple cutoffs. If the researcher is interested in how accurate a future sample can classify at a particular cutoff, the accuracy measure would be a better table to refer to. On the other hand, if researcher is interested in the overall performance of a test, eg, a diagnostic one, using a pathway, the AUC measure would be more suitable.
The aim of this study was to use a graph-based learning algorithm for multiple networks to find biological pathways that accurately classify disease stage. Each network is a genomic data type, like gene expression or miRNA expression. Integration of genomic networks increases the proportion of true classifications of stage in pathways critical to disease progression or status. Primarily, this method can be used to give insights into disease biology and progression. Pathway-based analysis can help researchers identify more biologically meaningful genomics markers than single-gene-based approaches. Finding these important pathways allows researchers to focus on smaller sets of genes that explain the response of interest. We demonstrated the use of our tool with colon and ovarian TCGA datasets. It is well known that genes work together in groups. A graph-based classification algorithm takes into account the correlations among biomarkers in pathways and is an ideal algorithm to use for performing integrative pathway analysis.
The methodology of this study is similar to that of Kim et al 58 in that it is a graph-based classification algorithm using multiple networks, although there are significant differences across the two methodologies. In this study, the sets of data types were not preselected as in Kim et al but were the best three of five available data types. Pearson correlation coefficients performed better in the OV dataset as a measure of edge weight than the Gaussian function of Euclidean distance used in the OV dataset of Kim et al. 57 Instead of one testing-training set with an unknown number of samples withheld for testing, this study used a more robust method of running 50 analyses with unique testing-training sets where 30% of samples were withheld for testing. This study had more even divisions between the two classes of OV and COAD stages (53% advanced-stage OV and 42% advanced-stage COAD) than that of Kim et al (92% advanced-stage OV). This may give a more unbiased prediction and more power to predict. Finally, this study classified patients using only the data related to the genes in a single pathway, whereas Kim et al classified patients using the entire dataset. 58
Pathways that were significantly improved in stage prediction using integrative analysis were biologically relevant to their respective cancers. This demonstrates the success of the method in finding pathways that accurately classify stage in ovarian and colon cancers.
Difficulties presented by previous methods of pathway analysis, as described by Wang et al,
60
included genetic architecture, multiple testing, and replication of results. Other difficulties did not apply to the way the integrated analysis was conducted. A replicate dataset is not available; however, validation sets were run for each of the 50 iterations of the datasets. They determined accuracy and AUC of each pathway. Apart from a classification problem, another approach taken could be testing based, in which
Wang et al described the difficulty presented by genetic architecture as one gene driving the entire pathway. 60 It is more likely that the opposite is true. Integrative analysis is likely to drown out the signal of one good gene with the noise of the other genes in the pathway, which are non-informative. Integrative analysis should be used in conjunction with a single-gene-based approach so that no information is overlooked. One gene that classifies patients very well is unlikely to do so significantly more in the integrative analysis than in single data-type analysis, which is the requirement for a significant pathway. This is so because, in the example of this study, a well-classified pathway in the integrated analysis driven by SNP association, gene expression, and/or methylation level would be compared to data types containing these driving factors, and the improvement should be small to none. Only if a combination of these driving factors increases the AUC or accuracy significantly more than a single data type would a gene drive the pathway, and then it would only happen if the other genes in the pathway did not drown out the signal. Integrative pathway-based analysis was an effective way to determine the mechanisms underlying advancing stage in serous cystadenocarcinoma and COAD. The graph-based semi-supervised learning algorithm, which determined these mechanisms also, significantly improved prediction of stage in these cancers compared to analysis of single–omics studies, including gene expression, methylation, and SNP studies. This algorithm can be extended to classify patient status and detect relevant biological mechanisms underlying any disease according to the chosen dichotomous clinical variable, if multiple sets of–omics data per patient are available. As more resources like TCGA 1 become available and expand their datasets, the utility of this algorithm will increase.
Conclusions
Integration of multiple genomic datasets resulted in a significant improvement over the single dataset analyses. Integration of multiple genomic datasets gave a maximum of 70% accuracy and 0.79 AUC. The pathways with these maxima are not in the tables, because the one dataset gene expression analysis for these pathways gives a similar level of accuracy or AUC. The top 10 OV and COAD pathways were all biologically relevant to their diseases, and some were known to be directly related to stage, as described above. Therefore, this algorithm is an effective method of classification and biological discovery.
To date, causes of complex genetic diseases, including cancers, have had small effect size and/or low frequency. Most studies have sought single point sources like a gene or a SNP with a single data type. They have failed to yield the expected result of an association that explains the cause of a disease in a large percentage of patients. The sources of a complex genetic disease can be found in multiple data types like SNPs and methylation level changes. These sources can spread their effects on other data types like methylation level changes to gene expression. Therefore, networking these sources using multiple types of–omics data over a pathway with a function relevant to the disease is an effective way to incorporate these truths over multiple potential disease-associated markers into a single model with the power to determine which biological mechanisms, or pathways, have significant contribution to disease. The contribution discovered will relate to the dichotomous clinical variable used in the model. For example, if the variable is cancer stage, the mechanisms will describe the pathways differing between early and advanced stages. The network generated by the integrative pathway-based analysis for each significant pathway can become a hypothesis-generating tool in the discovery of the precise elements of the pathway contributing to the disease.
Future work with regard to this algorithm should include a decrease in computational time to make it feasible to work with more than three data types. A potential method may be to increase the sparsity of the distance matrix, if it does not impair the algorithm's ability to detect biologically relevant pathways. The algorithm could also be improved by adding a method to automatically calibrate the optimal
Author Contributions
Conceived and designed the experiments: AD and HP. Analyzed the data: AD and HP. Wrote the first draft of the manuscript: AD and HP. Contributed to the writing of the manuscript: AD, AN, HP. Agree with manuscript results and conclusions: AD, AN, HP. Jointly developed the structure and arguments for the paper: AD, HP. Made critical revisions and approved final version: AD, AN, HP. All authors reviewed and approved of the final manuscript.