
Abstract
It has become increasingly common for large-scale public data repositories and clinical settings to have multiple types of data, including high-dimensional genomics, epigenomics, and proteomics data as well as survival data, measured simultaneously for the same group of biological samples, which provides unprecedented opportunities to understand cancer mechanisms from a more comprehensive scope and to develop new cancer therapies. Nevertheless, how to interpret a wealth of data into biologically and clinically meaningful information remains very challenging. In this paper, I review recent development in statistics for integrative analyses of cancer data. Topics will cover meta-analysis of homogeneous type of data across multiple studies, integrating multiple heterogeneous genomic data types, survival analysis with high- or ultrahigh-dimensional genomic profiles, and cross-data-type prediction where both predictors and responses are high- or ultrahigh-dimensional vectors. I compare existing statistical methods and comment on potential future research problems.
Keywords
Introduction
With the rapid development and decreasing cost of high-throughput technologies, cancer biology has moved from a data-poor field to a data-abundant field. To illustrate, to date, more than 1,000,000 samples have been stored in Gene Expression Omnibus 1 and ArrayExpress 2 ; meanwhile, over 2,500 sequencing samples are deposited in the ENCyclopedia of DNA elements (ENCODE) project 3 and the Sequence Read Archive 4 . Moreover, multiple types of genomics, epigenomics, and proteomics data, together with clinical data such as survival data, are simultaneously measured for cancer patients in the Cancer Genome Project (CGP), 5 the International Cancer Genome Consortium (ICGC), 6 and The Cancer Genome Atlas (TCGA). Consequently, the large volume of data provides unprecedented opportunities as well as challenges for using integrative analysis to reveal cancer mechanisms. Novel statistical methods and theories are in urgent demand for interpreting the wealth of data into biologically and clinically meaningful information while avoiding the “blind men and an elephant” scenario.
When tracing the history of the past two decades, it can be seen that high-throughput biology has triggered the active statistical research in high-dimensional data. Recently, to handle the real dimension of genomic data, which is usually beyond the scale of hundreds of variables, methods handling ultrahigh-dimensional data are emerging. The diversity of cancer data types together with the availability of related studies on similar types of cancers adds another two dimensionalities of complexity. It is of critical clinical and biological interests to understand what subtypes a cancer have, how genomic profiles and survival rates of patients vary among subtypes, whether a patient's survival can be predicted from his or her genomic profiles, and how one type of genomic profile is correlated with another type of genomic profile. No doubt, the abundance and sophisticated structures of cancer data will drive a whole class of exciting statistical problems in the coming years. In this paper, I review recent developments in statistical methods for integrative analyses of cancer data. This review complements an earlier review this year 7 from a statistical perspective, with a more detailed comparison of statistical methods, a broader range of topics such as integration of homogeneous type of genomic profiles across studies and integration of genomic profiles with survival data, as well as comments on potential extension of current methods (see Table 1). With increasing feasibility to access cancer data from those public repositories 8 so that anyone interested in the data can easily work on them, we hope the current review will arouse interests in developing new statistical tools and theories for integrative genomic analyses in cancer.
Summary of the main reviewed methods.

The rest of the paper is organized as follows. In the next section, I review models for integrating a single type of genomic profile across multiple studies to improve signal detection. This is followed by a section that is devoted to the integration of multiple types of genomic profiles. The next two sections present, respectively, integrating genomic data with survival analysis and the cross-data-type prediction problem where both the responses and predictors are high dimensional. Finally, the last section concludes the paper.
Integration of a Single Genomic Data Type
High-throughput technologies often have low signal-to-noise ratio. Consequently, results obtained from analysis based on a single study often suffer from low reproducibility either because of the low sample size or the heterogeneity of the datasets. With the rapid accumulation of related studies in public data repositories as mentioned above, it is more cost effective to borrow information across studies to improve signal detection. Nevertheless, caution should be paid when pooling datasets together to account for systematic biases such as batch effects as well as study specificity.
Batch Effects
Batch effects are widespread in high-throughput biology. They are artifacts not related to the biological variation of scientific interests. For instance, two microarray experiments on the same technical replicates processed on two different days might present different results due to factors such as room temperature or the two technicians who did the two experiments. Batch effects can substantially confound the downstream analysis, especially meta-analysis across studies. Moreover, even more recent technologies such as next-generation sequencing cannot eliminate batch effects. 9 Therefore, it is crucial to correct batch effects for valid integration across studies.
For microarray data, when the batches are known, a location and scale adjustment method, combat, was developed to adjust for batch effects.
10
The core idea of combat
10
was that the observed measurement 

For real application, an empirical Bayes method was applied for parameter estimation.
When batches were unknown, the surrogate variable analysis (SVA)11,12 was developed. The main idea was to separate the effects caused by covariates of our primary interests from the artifacts not modeled. Parallel to Equation (1), now the raw expression value 
For sequencing data, svaseq, the generalized version of SVA, suggested applying a moderated log transformation to the count data or fragments per kilobase of exon per million fragments mapped (FPKM) first to account for the nature of discrete distributions,
13
thus updating Equation (3) to:


RUV also allowed the use of negative control genes and control samples with details listed in its online methods. 14
Hierarchical Model
Differential expression detection between cancer patients and control samples is usually the first step to screen for risk genes and drug targets. However, as mentioned in the beginning of this section, gene expression microarrays suffer from noisy measurements, especially when only a small number of samples are available. Consequently, it is appealing to pool information across related studies or related cancer types to borrow strength. Specifically, within each study
The simplest method of pooling information is to assume that a gene is either differentially expressed in all studies or none of the studies.
15
However, it fails to allow genes to be differentially expressed in only a subset of studies, thus losing study specificity. A more flexible model EBarrays16–18 included all the possible differential expression patterns into the mixture model and fitted the model with an empirical Bayes approach. The Markov-chain Monte Carlo (MCMC) algorithm was also developed for model fitting along the line.
19
EBarrays performs well when the total number of studies integrated
Ma et al.
22
considered a more general case where a response variable
Despite the refining methods for detecting differential expression from a single sequencing experiment, including DEseq 23 and edgeR,24–26 the sequencing data version of hierarchical models for integration of multiple studies still requires development to address the typical discrete distributions observed for count and FPKM data. Before more fine-tailored methods becoming available, one potential easy approach might be to conduct a moderate log transformation as svaseq 13 and then apply the aforementioned microarray-based methods.
Integration of Multiple Genomic Data Types
Due to the decreasing cost of high-throughput technologies, more and more studies now measure multiple heterogeneous genomic profiles simultaneously for the same set of samples (patients and controls) such as gene expression, gene mutations, copy number alterations, and DNA methylations, where each data type consists of tens of thousands of measurements. A key problem of heterogeneous data type integration is how to characterize the common structure shared by all the data types as well as the individual data-type-specific variation.
In this review, I will focus on the recent statistical methodology development for integrative analyses of cancer data. Meanwhile, many well-developed machine learning algorithms, such as boosting,27,28 random forest,
29
and support vector machine,
30
have also been increasingly applied to cancer data and proven good prediction performance although with less interpretability. Readers may consult the corresponding review papers and the reference therein for details.7,31,32 The recently developed statistical methods can in general be categorized into three classes: matrix factorization, Bayesian models, and network fusion. In many scenarios, sparsity assumptions are also incorporated for regularization purpose to select a more parsimonious set of features. Here, I let {
Matrix Factorization
Matrix factorization aims at decomposing the variation in the datasets with lower rank matrix approximation. Assuming there are a set of “fundamental” common factors 
Here,
Along this line, Ray et al.
38
generalized the above model to the following factorization:

Instead of the same sharing factor loadings 
Denoting
Nonnegative matrix factorization (NMF) attempts to decompose a nonnegative matrix into nonnegative loadings and nonnegative factors, thus describing the non-subtractive patterns in the data.43,44 Zhang et al.
45
generalized the single matrix NMF to integrative analysis of multidimensional genomic data. After transforming the raw data into input data fulfilling the constraints of nonnegativity as Kim et al.
43
, the following squared Euclidean error loss function was optimized
45
:

One drawback of the NMF decomposition lies in the time complexity of the fitting algorithms, which is on the scale of 
As pointed out by the authors, NBS can be further generalized to integrate multiple layers of information 47 ; thus I expect a loss function as a combination of Equations (9) and (10).
A major issue with all the factorization approaches mentioned above is that they require proper normalization across data types. Generally, different data types have different distributions, different variability, and different numbers of genomic features. For instance, without proper scaling, as pointed out by Lock et al.
42
, it is very likely that “the largest data set wins”. JIVE attempted to handle that issue with normalization first across each row and then scaling across data types. On the other hand, as mentioned above, iCluster
33
tried to use different penalty functions to take care of different data features. However, it still failed to distinguish between binary, categorical, and continuous data types. The method proposed by Mo et al.
48
can be viewed as a generalization of iCluster
33
by incorporating different distribution assumptions while still assuming the same common latent factors for all types of data. Specifically, with 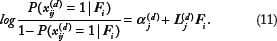
Similarly, for multicategory outcomes, with 
Likelihood for count outcome with Poisson distribution and continuous variables with normal distribution can be derived accordingly. Lasso penalty was also placed on
A potential future research problem would be how to adapt different distribution assumptions into a more flexible factorization framework such as the joint Bayesian factor model
38
and JIVE.
42
Moreover, other than Bayesian framework, how to conduct statistical inference including significance tests and confidence intervals for factor models, especially with penalization methods, would also be an important future research problem. Another problem worth investigation in real application, as pointed out by the referee, is the choice of the number of components or clusters
Bayesian Models
Bayesian hierarchical models are another set of popular tools for integrative analysis of heterogeneous data types. They offer the flexibility to model different data-type-specific distributions as well as various types of correlation among data types.
In multiple dataset integration (MDI),
51
the authors considered the case where multiple genomic data types were measured under a single biological condition for a common set of genomic features. For instance, gene expression data, protein–DNA interaction data, and protein–protein interaction data were measured simultaneously for the same group of genes. The model assumed that each data type followed a
Let 
Here, 1(·) is the indicator function, and
Instead of modeling associations among different data types, Prob_GBM
53
modeled the associations among patients using a patient-similarity network. It first discretized all the genomic features and concatenated them into one vector for each patient. Next, for each patient, it assumed that each genomic feature was generated from a multinomial distribution whose parameters were determined by a
The Bayesian consensus clustering was proposed to model the overall clustering consensus among different data types rather than pairwise associations among data types. Therefore, an overall single clustering can be achieved at patient level, resulting in cancer subtype discoveries.
54
Denoting the overall clustering labels as 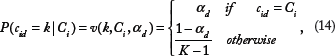
All the above models were embedded into the Bayesian framework. Consequently, one main challenge lies in the computation of the MCMC algorithm for model fitting. Generally speaking, compared to matrix factorization methods, the Bayesian hierarchical model provides more flexibility to model data-type-specific distributions and various dependence structures. Nevertheless, it remains challenging to build models that comprehensively capture the association among different data types, among patients, and among different clusters of genomic features.
Network Fusion
Another emerging approach for identifying cancer subtypes is to construct networks for patients and then conduct clustering according to the obtained network graph. Similarity network fusion (SNF)
55
first constructed a similarity network of patients for each data type, where each node represented a patient and the weight on each edge indicated the similarity between two patients. Then, SNF normalized each network
Instead of building a graph for each type of data, Katenka et al.
57
stacked
SNF lacks a rigorous probabilistic model to fuse multiple graphs; the methods of both Katenka et al.
57
and Kolar et al.
58
required
Integration of Genomic Data with Survival Data
One of the major goals of cancer research is to identify the survival curves for cancer patients. Therefore, statistical methods for studying the relationship between survival data and high-dimensional genomic data are of vital clinical importance. Here, I briefly review recent development in integrating genomic data with survival data.
Let
Variable Selection Methods
The Cox proportional hazard model
67
is one of the most widely used models for survival data. It assumes that the hazard at time 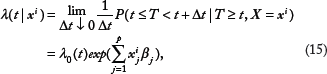
Parallel to the development of methods for linear models moving from high dimension to ultrahigh dimension, defined as the dimensionality growing exponentially with the sample size in Fan and Lv,
75
sure independence screening (SIS) type of methods have also been developed for survival data. Given outcome 
Theoretical justification of the SIS property for the FAST statistics within a class of single-index hazard rate models was provided.
Ensemble Learning
Ensemble learning methods such as random forest
29
and boosting
81
are well known for offering outstanding prediction accuracy. Several methods have attempted to handle the missingness caused by censoring and thus generalized ensemble learning methods to survival data. Hothorn et al.
82
first drew multiple bootstrap samples
83
with replacement and constructed a survival tree for each bootstrap sample. Given a new observation, its survival function is estimated by the Kaplan–Meier curve
84
for all data points in all the trees that belonged to the same leaf node as the new observation. In Hothorn et al.
85
, the authors first log-transformed
Cross-Data-Type Prediction
An ultimate goal of genomics is to demystify the regulation program of different functional genomic profiles. How is DNA methylation related to gene expression? How does transcription factor binding control gene expression? What is the relationship between chromatin status and methylation status? The core problem underlying all these questions is whether we can predict one type of genomic profile from another, where both the response and predictor variables are multivariate with at least tens of thousands of variables. In such scenarios, we surpass simple or multiple linear regressions, penalized approaches such as lasso, and sure independence screening for ultrahigh dimensions in that the response variable itself is also an ultrahigh-dimension vector rather than a scalar one. The small sample size adds another dimension of challenge for inferring the relations between tens of thousands of responses and predictors.
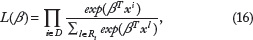
The thresholding singular value decomposition (T_SVD) regression
92
is among the very first to study this problem. T_SVD actually adopted a standard single-layer neural network model to link the high-dimensional predictors 
It can be seen that the cross-data-type prediction will open another new field for statistical methodology and theoretical research, given that both the predictors and the responses can not only be ultrahigh dimensional but also consist of multiple data types.
Conclusions
More and more efforts have been devoted to the development of statistical models and methods for integrative cancer data. Nevertheless, research on integrative analyses for cancer is still in its infancy with many open problems. How can systematic biases such as batch effects be detected and corrected in each new type of high-throughput technology so that meta-analysis across studies can be conducted? How can cancer subtypes be classified according to multiple genomic profiles jointly or determined by only a subset of genomic profiles? How can a single network be constructed with multidimensional genomic profiles? How can networks constructed from different types of data be modeled jointly? How can survival time of cancer patients be predicted by multiple types of ultrahigh-dimensional genomic profiles? How can one ultrahigh-dimensional vector be predicted from another ultrahigh-dimensional vector, one maybe continuous while the other discrete? All these questions are of vital clinical importance for identifying risk factors, drug targets, cancer diagnosis, survival prediction, and therapy selection toward a personalized approach. Naturally, they urge the demand for developing valid statistical methods with outstanding practical performance as well as solid theoretical foundations. I anticipate a wealth of new computationally efficient, interpretable, and robust statistical methods for integrative cancer analyses in the near future, which will thereby significantly promote cancer research and therapeutic development.
Author Contributions
Conceived and designed the experiments: YW. Analyzed the data: YW. Wrote the first draft of the manuscript: YW. Contributed to the writing of the manuscript: YW. Agree with manuscript results and conclusions: YW. Jointly developed the structure and arguments for the paper: YW. Made critical revisions and approved final version: YW. The author reviewed and approved of the final manuscript.
Footnotes
Acknowledgments
I wish to acknowledge the Guest Editor Dr. Hao Wu for help in preparing this manuscript.