
Abstract
Dynamic susceptibility contrast-enhanced magnetic resonance imaging is routinely used to provide hemodynamic assessment of brain tumors as a diagnostic as well as a prognostic tool. Recently, it was shown that the relative cerebral blood volume (rCBV), obtained from the contrast-enhancing as well as -nonenhancing portion of glioblastoma (GBM), is strongly associated with overall survival. In this study, we aim to characterize the genomic correlates (microRNA, messenger RNA, and protein) of this vascular parameter. This study aims to provide a comprehensive radiogenomic and radioproteomic characterization of the hemodynamic phenotype of GBM using publicly available imaging and genomic data from the Cancer Genome Atlas GBM cohort. Based on this analysis, we identified pathways associated with angiogenesis and tumor proliferation underlying this hemodynamic parameter in GBM.
Introduction
Glioblastoma (GBM) is a WHO grade IV tumor with an extremely poor prognosis and a median survival of 12–15 months. Many imaging features are used to characterize GBM, such as structural magnetic resonance imaging (MRI), diffusion MRI, and perfusion MRI.
1
Several of these derived radiology-based image features (denoted
Identification of such noninvasive surrogates of clinical outcome and the associated molecular differences might point to a deeper understanding of the underlying disease state.3,4 Several studies5–7 have demonstrated that imaging phenotypes derived from MRI studies might have the potential to serve as noninvasive proxies of cancer-associated clinical outcomes. In this regard, we follow up on recent studies based on dynamic susceptibility contrast-enhanced MRI (DSC-MRI) that identifies a hemodynamic parameter associated with overall survival. Specifically, these studies5,8 pointed to the association of rCBVmax (maximum relative cerebral blood volume of the contrast-enhancing component of GBM) and rCBVNER (rCBV in the nonenhancing region of the tumor) with patient survival.
The Cancer Genome Atlas (TCGA) 9 contains comprehensive genomic data (spanning expression, copy number, methylation, microRNA (miRNA), etc.). The Cancer Imaging Archive (TCIA) 10 is a publicly available repository of patient-derived images across multiple modalities (single-photon emission computed tomography, computed tomography, and MRI) and multiple tumor types in many of the patients who have corresponding molecular data in TCGA. Using genomic and imaging data from the TCGA-GBM archive, we carried out a bioinformatics analysis to identify molecular correlates of imaging features associated with survival.
Based on the prognostic significance of the hemodynamic parameter (rCBVmax value, we sought to examine the molecular correlates of rCBV via differential expression max rCBVmax via differential expression analysis of messenger RNA (mRNA), miRNA, and protein levels. The intent was to identify molecular entities that are likely regulated across different layers of biological complexity: each modality (mRNA, miRNA, and protein) provides complementary information about the biology of the process of GBM tumorigenesis. Thus, we decided to combine the significantly associated genes (transcriptional correlate), miRNAs (post-transcriptional correlate), and proteins (signal transduction correlate) to identify if there was a concordant biological process (or processes) that could be inferred when these three–omic modalities were combined. Combining entities found associated with tumor hemodynamic response across different biological layers has the potential to illuminate important regulatory processes.
For this purpose, patients were dichotomized based on median rCBVmax value and then examined for differential expression of mRNA, miRNA, and protein levels. A molecular examination of the two phenotypic groups reveals that genes and miRNAs related to the molecular process of angiogenesis underlie this phenotypic transition between low and high rCBVmax groups.
Materials and Methods
Ethics Statement
All patients in this retrospective study had been previously de-identified by TCGA, a publicly available data set that contains no linkage to patient identifiers and is compliant with the Health Insurance Portability and Accountability Act; therefore, a waiver was obtained from the Henry Ford Hospital Institutional Review Board of Henry Ford Hospital, Detroit, MI. This research complied with the principles of the Declaration of Helsinki.
Patient Population
Based on the availability of perfusion (DSC) MRI image data from the TCIA and the corresponding genomic expression from TCGA, 50 GBM cases were identified (19 females, 30 males, and 1 unknown). These cases were selected to ensure consistency in glioma history and treatment profile. Specifically, patients with untreated primary GBM were selected. Clinical data for this population were obtained from the cBioPortal for Cancer Genomics. 11
Image Features
Radiology annotations of the 50 GBM cases and their preoperative images (from TCIA) were obtained from the TCGA Glioma Phenotype Research Group. 10 This Health Insurance Portability and Accountability Act-compliant retrospective study was approved by the Henry Ford Hospital Institutional Review Board (IRB #6381). Patients underwent DSC T2*-weighted MR perfusion studies and had gene expression data available from TCGA. Fifteen cases were imaged in a 3 T scanner, while others were imaged in a 1.5 T scanner. rCBVmax was measured from a region of interest of 10 x 10 voxels 5 placed on the hottest-appearing tumor region based on qualitative perfusion maps.
Genomic Features
Batch-corrected, Level 3 expression data for both mRNA (Affymetrix U133Av2 BI Platform: Affymetrix HT HG U133A) and miRNA (UNC Agilent Human miRNA 8x15K) were downloaded from the UT MD Anderson Genome Data Analysis Center Portal 12 version dated June 18, 2013. Protein expression from reverse-phase protein array (RPPA) was downloaded from the Cancer Proteome Portal. 13 Forty-seven cases had miRNA and mRNA data available, whereas 15 cases had data for all three platforms. Instead of restricting our study to just the 15 common cases for differential expression analysis, we performed analysis of each platform separately and integrated the differential expression results subsequently via pathway analysis.
Defining Classes Based on Median rCBVMax
Based on the prior finding that rCBVmax is associated with survival in a statistical significant manner, 5 we sought to examine the molecular correlates of rCBVmax via differential expression analysis. Median rCBVmax across the entire dataset was used to divide the study population into two groups.
Differential Expression Analysis between Cutpoint-Induced Phenotype Classes
Differential expression analysis for mRNA, miRNA, and protein was done to investigate molecular differences between the median rCBVmax -induced phenotype groups. This was done using a two-sided
Functional Analysis and Integrative Analysis
For relating differentially expressed miRNAs with differentially expressed mRNAs, the miRNA target filter feature (
Integrative Network Analysis of miRNA, mRNA and Protein 141 Entities via Ingenuity Pathway Network Analysis
Core analysis and functional analysis were performed on the differentially expressed gene, protein, and miRNA lists. We explored both “Direct and Indirect Interactions” using “Experimentally Observed OR High Confidence Predictions” in the IPA knowledgebase.
Results
Differential Expression Programs between Phenotypic Classes Reveal the Role for Cell Proliferation and Angiogenesis-Associated Pathways
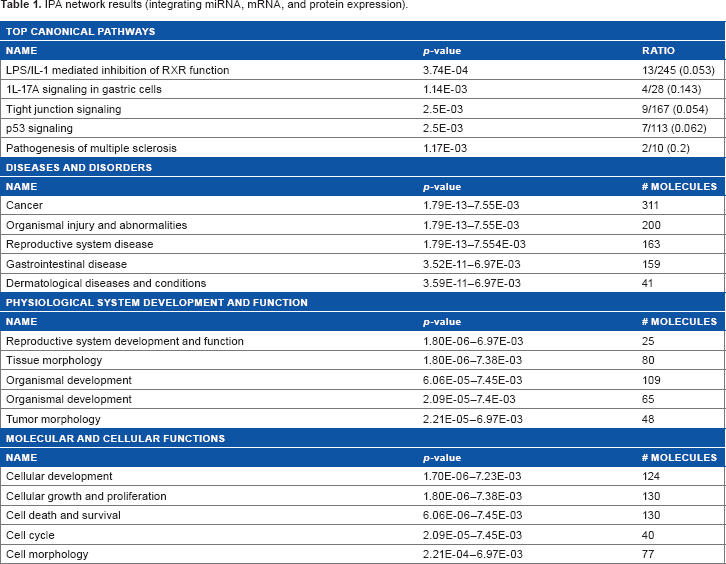
The differential expression analysis procedure on the mRNA, protein, and miRNA data yields 326 genes, 76 miRNAs, and 8 proteins that are differentially expressed between these two phenotype classes. For completeness, the ontological analysis of these genes, miRNAs, and proteins (using the IPA tool) is presented (Table 1). The key pathways activated in this set are related to cellular development, cellular proliferation, cell death, interleukin signaling, and inflammatory response.14,15
IPA network results (integrating miRNA, mRNA, and protein expression).
Integrated miRNA:mRNA Analysis Reveals Multiple Molecules Underlying the Transition of this Perfusion-Associated Phenotype
We reasoned that combining the differentially expressed miRNAs and mRNAs might reveal a robust mechanism underlying the transition between the two phenotypic classes. Using the IPA tool, we combined the miRNA expression results with the mRNA expression results and found that eight differentially expressed miRNAs (miR-29b-3p, miR495–3p, miR30c/30d, miR-26a-5p, miR296-5p, miR128-3p, miR144-3p, and miR214-3p) target several differentially expressed genes (including PTEN, COL15A1, SPARC, ANPEP, CBFB, STRN, and TMED10) while exhibiting concordant expression correlation (the expression levels of the mRNAs are anticorrelated with the miRNA expression levels).
Several of these miRNAs have been shown to play a key role in GBM. miR-26a regulates PTEN and is observed to be amplified in high-grade gliomas in addition to promoting tumorigenesis. 16 miR-29b has been shown to regulate invasion in GBM. 17
Examination of the combined set of mRNAs, proteins, and miRNAs via IPA reveals several networks of potential interest. The primary biological processes (based on Fisher's exact tests for over-representation analysis) are LPS/IL-1-mediated signaling, IL-17A signaling, tight junction signaling, p53 signaling, pathogenesis of multiple sclerosis, etc. (presumably related to angiogenic activity [Table 1]).
Discussion
Perfusion MRI is a promising tool that is now being routinely used to interrogate tumor behavior, such as inflammation and vascularization. It is already being used for treatment monitoring (eg, assessment of changes due to treatment with antiangiogenic therapy). Since it is a much newer tool than conventional MRI, a study of the specific biological processes associated with perfusion imaging is useful to inform the radiologist about what specifically is being assessed using this modality.
Tumor blood volume (rCBVmax) is a measure of total tumor vasculature and angiogenesis. It has been shown to correlate with microvascular density 18 as well as genes related to angiogenesis regulation 19 and hence is a useful prognostic marker.5,8 Our analysis reveals the role of several angiogenesis-related molecules (at the miRNA, mRNA, and protein levels) associated with this vascular parameter. This functional analysis that spans miRNA, mRNA, and protein entities produces several insights that could perhaps clarify the etiology of GBMs as measured via perfusion imaging in addition to possibly generating new hypotheses that could be validated in a laboratory. Specifically, animal models of GBM with overexpressed gene/miRNA levels might inform on the relationships of these molecules with tumor-associated angiogenic activity.
An examination of the IPA-derived pathways reveals roles for several pathways involved in tumorigenesis, tumor growth, and angiogenesis – specifically, IL-17 signaling is key to tumor survival, inflammation, and angiogenic activity.20,21 Further IL-1 signaling has a role in tumor-mediated angiogenesis.22,23 An examination of the molecular and cellular activities in IPA reveals a role for several tumor hallmarks, such as modulation of tumor morphology, cell proliferation, cell cycle, and apoptosis. Another interesting point is that the context of angiogenesis ties in the observations from our gene set analysis with the pathogenesis of multiple sclerosis, again suggesting a role for angiogenesis modulation.24,25
Angiogenesis is one of the key hallmarks of cancer. 26 HER2 signaling and angiogenesis have been shown to be closely linked.27,28 The role of EGFR in GBM is well documented. 29 Moreover, its role in modulation of invasion, angiogenesis, and metastasis has been reported; specifically, EGFR signaling contributes to angiogenesis via upregulation of MMP levels and cytokines such as VEGFA and IL8. 30 BRCA2 is a tumor suppressor, 31 so it is expected that its level goes down in the more extreme rCBV phenotype (suggesting a more aggressive disease). However, its exact relationship with angiogenesis is not clearly characterized, especially in the context of glioma. Several of these proteins have been shown to play a key role in GBM. For example, JNK2 activation correlates strongly with EGFR expression as well as histological grade in GBM. 32 JNK2 has been shown to control cell proliferation and apoptosis and thus been implicated in tumorigenesis.33,34 Furthermore, JNK2 has been shown to an upstream regulator of NFAT activity, which is a critical regulator of angiogenesis.35,36
Among the miRNAs listed in Table 2, miR495 has been shown to inhibit proliferation of GBM cells by downregulating CDK6, and thus is heavily downregulated in higher grade gliomas. 37 miRNA-26a regulates angiogenesis via modulation of the BMP/SMAD1 signaling.38,39 miR-29b suppresses angiogenesis, migration, and invasion by regulating MMP2 levels; thus, it is expected that it would be down-regulated in the high rCBVmax group, suggesting an activation of these tumorigenic hallmarks. miR-30d has been shown to modulate tumor cell proliferation, angiogenesis, and metastasis.40,41 Their specific role in glioma needs to be investigated more thoroughly.
List of differentially expressed miRNA, mRNA, and protein entities.
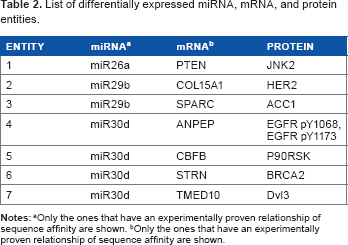
Only the ones that have an experimentally proven relationship of sequence affinity are shown.
Only the ones that have an experimentally proven relationship of sequence affinity are shown.
Conclusions and Future Work
This study reveals the utility of integrating genomic data to dissect the molecular programs underlying the vascular phenotype of the tumor, which is assessed with perfusion imaging. Our hypothesis is that instead of focusing solely on one -omic modality, combining -omic modalities is more likely to illuminate the molecular mechanisms underlying the disease processes. Thus, an integration of mRNA, miRNA, and RPPA data permits the combination of multiple layers of biological complexity: transcriptional, posttranscriptional, and signaling, to infer biological mechanisms underlying this hemodynamic characteristic of GBM.
There are several limitations to address in our study. First, this was a retrospective study performed on a publicly available patient subset, consisting of data acquired on multiple MRI systems with varying protocols. A study that evaluates the robustness of these integrative molecular programs across scanning protocols, scanner resolutions, and a larger sample size is essential to establishing their biological role. A separate dataset with uniformity of treatment regimen is the next step in validating the biological role of these genomic programs. Furthermore, incorporating molecular markers such as IDH mutation status and molecular subtype in a multivariate regression can help to deconvolve the underlying molecular programs underlying the perfusion phenotype in GBM. Also, the top ranking pathways and molecules identified via integrative analysis need to be validated through laboratory studies, possibly via
Author Contributions
Conception and design of research: AR, RJ. Data preparation, analysis and reporting: GM, GR, RJ, AR. All authors reviewed and approved of the final manuscript.
Footnotes
Acknowledgments
The authors would like to thank Dr. Laila Poisson for helpful discussions on this manuscript and Tomiko Fisher for assistance with manuscript editing.