
Abstract
In some cancer clinical studies, researchers have interests to explore the risk factors associated with competing risk outcomes such as recurrence-free survival. We develop a novel recursive partitioning framework on competing risk data for both prognostic and predictive model constructions. We define specific splitting rules, pruning algorithm, and final tree selection algorithm for the competing risk tree models. This methodology is quite flexible that it can corporate both semiparametric method using Cox proportional hazards model and parametric competing risk model. Both prognostic and predictive tree models are developed to adjust for potential confounding factors. Extensive simulations show that our methods have well-controlled type I error and robust power performance. Finally, we apply both Cox proportional hazards model and flexible parametric model for prognostic tree development on a retrospective clinical study on oropharyngeal cancer patients.
Keywords
Introduction
In clinical research, prognostic and predictive models play important roles. Prognostic model is constructed to predict patients’ clinical outcomes, given their demographic, clinical, and genetic characteristics. It is important to define interpretable prognostic classification rules for understanding the nature of patient s’ performance. On the other hand, predictive model is developed for treatment decision-making, such as optimization of treatment strategy for patients with specific characteristics.
In cancer research, researchers usually deal with the time-to-event clinical endpoints, such as standard censored survival outcomes. Typical example is the overall survival. Sometimes the research interests are on more complicated type of data, such as recurrence-free survival, which involves competing risk events (ie, death without tumor recurrence). A competing risk event can preclude the event of interest from occurring. For example, we could not observe tumor recurrence if a patient died without recurrence. There is loss of information if we ignore this type of event. Thus, it is important to pay attention to these complex time-to-event data as a way of understanding
First introduced by Morgan and Sonquist, 1 the tree-based method became widely used due to the work by Breiman et al. 2 , who developed the Classification and Regression Tree algorithm. An attractive feature of the tree-based model is the connection between partitioning a covariate space and a binary decision-making process. The methodology was further developed for both continuous and categorical outcomes, adjusting for the effect of confounders. 3 For standard censored survival data, we have developed a general framework to create prognostic and predictive survival trees for time-to-event outcomes based on recursive partitioning algorithm. 4 This framework also allows for adjusting for possible clinical confounders, which are not of direct interest. The tree-based methods are appealing as the flexibility to detect direct or interactive effects on survival outcomes and select covariates in the presence of high-dimensional data. Simulation results show the well performance of the method and robustness to large-dimensional covariate spaces for time-to-event data. 4 However, currently, little work has been applied on competing risk outcomes for prognostic and predictive model development.
To model competing risk events, the most commonly used method is based on the Cox proportional hazards models. While some argue that in large epidemiological studies, the assumption of proportional hazards is sometime problematic. A flexible parametric model 5 and a parametric mixture model 6 are developed to model the cause-specific hazard function to corporate time-dependent hazards. Another method is developed to model the cumulative incidence function directly based on pseudovalues. 7
Several decision tree models were developed for survival data,8,9 but only few were found for competing risk outcomes. One work on competing risk survival data generates prognostic survival tree only, 10 and all the input covariates are potential splitting variables. It cannot adjust for potential confounders. As we know, there is no existing method that is applicable for predictive tree construction that can deal with treatment interactive effect on competing risk outcomes.
The primary aim of this article is to extend our current survival tree framework to competing risk data for both prognostic and predictive tree constructions. We focus on the semiparametric method using Cox proportional hazards algorithm and use likelihood ratio test (LRT) for the splitting rule. This novel tree framework is quite flexible that it can also corporate parametric competing risk model and overcome the restriction of proportional hazards assumption.
In this article, first we introduce the basic structures of a recursive partitioning algorithm of competing risk decision trees. In addition, we define the splitting rules, pruning algorithm, and methodology to choose the final tree structure on the competing risk outcomes. Extensive simulations are conducted to evaluate the performance of this innovative methodology framework for both prognostic and predictive trees. To deal with time-dependent hazards, we develop a method to combine the flexible parametric model 5 and the semiparametric survival tree framework. Finally, we apply both Cox proportional hazards model and flexible parametric model for prognostic tree construction on an oropharyngeal cancer study.
Method
Algorithm Overview
The tree-based method using a recursive partitioning procedure consists of a splitting rule, a pruning algorithm, and an approach to select the final tree structure. The splitting rule is used to partition covariate space into subgroups representing patient prognosis or prediction.
The partition is represented as a tree
Competing Risk Method Based on Cox Model
Splitting Rule.
Competing risks model are developed when an event can be caused by multiple reasons and interest lies in modeling one particular cause.12,13 There are two key measures in competing risks analysis, cause-specific hazard, and hazard of the subdistribution, which differ in the risk sets by definition. Several regression approaches are applicable to estimate these two quantities. 14 In this article, we focused on modeling cause-specific hazard. For simplicity, in this article, we only consider making binary splits on binary splitting variables.
To partition a node 
Data setup for competing risks model is (
We can also define the cause-specific hazard rate for cause 
Then, the cumulative hazard for cause 
The likelihood involving a specific type of failure is exactly the same as the likelihood obtained by treating all other types of failures as censored observations. Thus, the full likelihood is the product of likelihood of each specific cause failure. Here, we assume

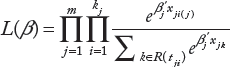
The partial likelihood is
Consider two nested models, 
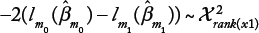
Here,
To specify, let vector
For prognostic tree, the null model is
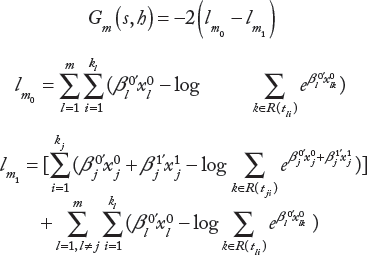
For predictive tree, the null model is

Pruning Algorithm.
The split complexity 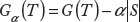

We can interpret
The idea of the pruning algorithm is to cut the branches that have the weakest link to the tree. Statistically, it is the improvement of the overall split complexity. Performing this cut once at a time, a nested sequence of subtrees
Selection Algorithm of Final Tree.
The previous section yields a sequence of optimally pruned subtrees. In this section, we aim to select a final tree structure for decision-making. Since the tree structures are determined by maximizing LRT statistics, the split complexity would be larger than expected with the same training sample.
An effective method to deal with this issue is to randomly split the data into two sets, namely, a training set and a test set, and repeat the process multiple times. To implement this, bootstrap method is applicable. We first grow and prune a tree with the training set and then force test set data into the sequence of the pruned trees. The split complexity
Flexible parametric model
In cancer epidemiological studies, sometimes the proportional hazards assumption is not relevant for each specific cause. This leads us to explore a more general method to overcome this issue. The use of parametric model may have some advantages. Efron 16 and Oakes 17 showed that, under certain circumstances, parametric models result in more efficient parameter estimation than Cox's model. With decreasing sample sizes, parametric models may have better performance in terms of efficiency. When empirical information is sufficient, parametric models can provide some insight into the shape of the baseline hazard. In addition, it does not have the restriction of proportional hazards assumption, thus is easier to deal with time-dependent effects. It gives an estimation of the baseline hazard, and the visualization of the hazard function is much easier. 18 Royston and Parmar 18 also proposed an extension of Weibull and log-logistic model using cubic splines to smooth the baseline log cumulative hazard. Hinchliffe and Lambert 5 further applied this flexible parametric model to competing risk framework. In this article, we incorporate Hinchliffe and Lambert model into our survival tree framework and applied on a real clinical study.
Flexible Parametric Model.
The basic idea of flexible parametric model starts from the Weibull distribution,5,19,20

If we take a complementary log-log transformation, we have
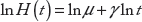
In this setting, ln 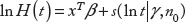
With the estimation of ln 
Likelihood Construction.
Based on flexible parametric survival tree model, we construct a likelihood function to be used as a splitting rule within the survival tree framework to apply to the competing risk data. The likelihood function can be written as the product of 
Time-Dependent Hazards.
The flexible parametric model can be adapted to time-dependent hazards by adding the interaction terms between covariates and the restricted cubic spline function.
5
Suppose there are 
At each splitting time, to select a best splitting covariate, we compare the improvement of the following two models,


By doing this, no matter this potential effect is time dependent or not, there will be an improvement on the test statistics and our algorithm will capture this effect if it is truly related to the outcome.
Simulation Settings
Extensive simulations are conducted for the competing risk tree-based model performance evaluation.
Simulation Parameters.
For the simulation parameters, first, we choose different sets of the sample size and the number of covariates for potential splitting. We assume that all the splitting variables are binary and generated from Bernoulli distributions with parameter,
Parameter settings for different tree models.

Simulate Time to Event.
There are two types of time to event. One is time to event that is of interest
For example, the log hazard ratio for event of interest assumes to be log
Simulate Censoring Time.
Censoring times
Simulated Response Time.
Then, we take the minimum of
After generating the data from above, we then use our tree model to fit the data.
Results
Simulation Results
The simulation results for both prognostic and predictive tree models are presented for this study.
Prognostic Tree.
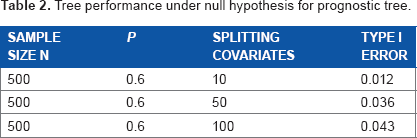
Table 2 shows the model performance under the null model for prognostic tree for type I error evaluation. A total of 500 samples are simulated for each replication, and 1000 replicates have been conducted. The chance of selecting the wrong tree slightly increases as the number of splitting covariates becomes larger, but the model still performs well with only a 1.2%–4.3% chance of having wrong tree.
Tree performance under null hypothesis for prognostic tree.
Tables 3–5 show the power performances under alternative model with different hazard ratios. Increasing the splitting covariates will reduce the chance of selecting the right tree. The model performs better when the effect size is larger. When the hazard ratio is 3.0, the probability of selecting the right tree remains high as the number of potential splits increases. Even for 100 potential splits, the probability of identifying the true tree as an optimal subtree remains 89% and the chance of selecting the correct tree is 66%.
Tree performance under alternative model for prognostic tree HR = 2.0.

Tree performance under alternative model for prognostic tree HR = 2.5.

Tree performance under alternative model for prognostic tree HR = 3.0.
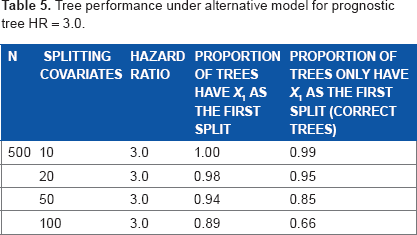
Table 6 shows that the model has better performance when the true splitting variable is more balanced. With proportion of the splitting variable (
Tree performance under alternative hypothesis for prognostic tree.

Predictive Tree.
For predictive tree, Table 7 shows the performance under null hypothesis and Table 8 focuses on the effect of number of splitting covariates and effect size under alternative. Similar patterns can be found as in prognostic tree results. The model performance is better when there are smaller number of split variables and stronger effect size.
Tree performance under null hypothesis for predictive tree.

Tree performance under alternative for predictive (interactive) tree.

When effect size is greater than 2.5, there is over 91% chance of predictive tree model selecting the true tree with 20 potential split variables. If there are only 10 potential split variables, the chance will be increased to over 96%.
Application to Clinical Data
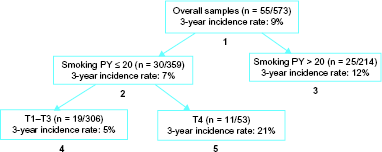
We applied the competing risk tree model on a Human papillomavirus positive (HPV+) oropharyngeal cancer (OPC) study with 573 patients. 21 The endpoint of interest is recurrence-free survival with death without recurrence defined as competing risk. Potential splitting covariates are age, gender, smoking pack-year, alcoholism, T stage, and N stage. For this retrospective data, prognostic tree model is constructed with treatment been adjusted for confounding effect. Appling both Cox-based model and flexible parametric model 22 to this cancer clinical data, we obtain the following tree structures for outcome prognoses, see Figures 1 and 2.

Tree structure using Cox-based method. For each subgroup,
Tree structure using flexible parametric model. For each subgroup,
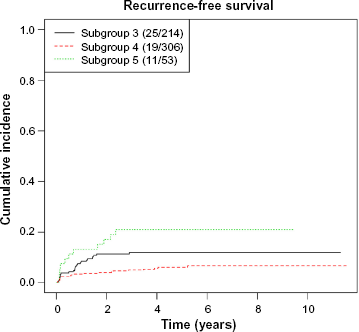
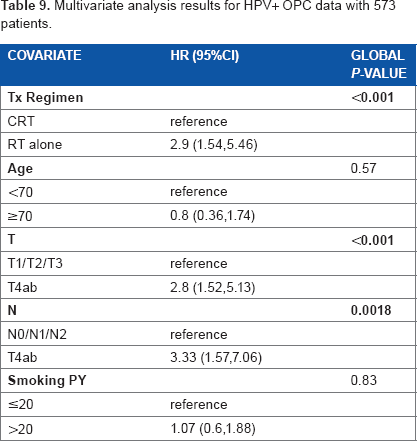
Both methods provide final tree structures after splitting, pruning, and final tree selection. Since the two methods are based on different modeling assumptions, they perform differently on the choice of splitting variables and tree structures selection. However, both of them capture the important factors that are associated with the outcomes. They both provide a good separation of the patients into prognostic groups, see Figures 3 and 4. We also apply multivariable analysis on the splitting covariates. Table 9 shows that tumor size (T stage) and nodal status (N stage) are the important prognostic factors to be significantly related to the competing risk outcome, and smoking is moderately significant. These factors are chosen as splitting covariates in both trees.

Cumulative incidence curves for each subgroup with Cox-based method.
Cumulative incidence curves for each subgroup with flexible parametric model.
Multivariate analysis results for HPV+ OPC data with 573 patients.
Conclusion and Discussion
In this article, we develop a novel survival tree framework on competing risk outcomes. This innovative method can deal with both prognostic and predictive models, which is important for cancer clinical research. This method fills the gap of current tree model development on clinical time-to-event outcomes. We define specific splitting rules, pruning algorithm, and final tree selection algorithm for this competing risk tree model. Both prognostic and predictive tree models are developed to adjust for potential confounding factors.
Extensive simulations show that the performance of our methods is well controlled under the null hypothesis. This performance is quite robust with a large number of potential splitting variables, which is important for many cancer pharmacogenomics research studies with high-dimensional biomarker space. Moreover, we have shown that the interaction survival tree can perform well with the large number of genetic factors often found in personalized medicine research. Once a tree is created and subgroups are identified, summary statistics such as hazard ratios of treatment, Kaplan–Meier curves, and median survival times for each group can be presented to clinicians. The clinicians can make treatment decision based on the predictive tree results.
Simulations have shown that the power of selecting the right tree structure under the alternative hypothesis is usually high. For predictive tree, to have adequate power, there should be a sufficiently large number of events, interactive effect between the split and treatment, and the balance of the potential splits. In addition, adjusting for clinical confounders in the splitting rule seems to have statistical benefits on most of the cancer clinical studies with potential outcome-related clinical factors such as age, tumor stage, and smoking status.
Our methodology is quite flexible that it can corporate both semiparametric method using Cox proportional hazards model and parametric competing risk model. There are several advantages. First, it can deal with cancer clinical studies that the proportional hazards assumption is not relevant for each specific cause. Furthermore, using parametric models sometimes results in more efficient parameter estimation than Cox's model.16,17 In addition, when empirical information is sufficient, parametric models can provide some insight into the shape of the baseline hazard. And it is easier to deal with time-dependent effects. However, our application on the real clinical data shows that, since the two methods are based on different modeling assumptions, their performance can be slightly different on the choice of splitting variables and the tree structures selection. Hence, data exploration and model assumption assessment are critical. We suggest conducting proportional hazards assumption test on the data before applying the competing risk tree methods.
For predictive tree, the current method is applicable to randomized clinical trial data in which the treatment assignment is independent of other risk factors. However, for a large number of cancer retrospective studies, the treatment decisions are based on the characteristics of demographic or clinical factors such as age, physical condition, tumor size, stage, performance score, and metastasis. Further extensions of the predictive survival tree model are needed to deal with this challenge for personalized medicine development.
Author Contributions
Conceived and designed the experiments: WX. Analyzed the data: WX, JC, QK. Wrote the first draft of the manuscript: WX, JC. Contributed to the writing of the manuscript: WX, JC. Agree with manuscript results and conclusions: WX, JC, QK. Jointly developed the structure and arguments for the paper: WX, JC, QK. Made critical revisions and approved final version: WX, JC. All authors reviewed and approved of the final manuscript.