
Abstract
In this paper, we propose a novel multivariate component-wise boosting method for fitting multivariate response regression models under the high-dimension, low sample size setting. Our method is motivated by modeling the association among different biological molecules based on multiple types of high-dimensional genomic data. Particularly, we are interested in two applications: studying the influence of DNA copy number alterations on RNA transcript levels and investigating the association between DNA methylation and gene expression. For this purpose, we model the dependence of the RNA expression levels on DNA copy number alterations and the dependence of gene expression on DNA methylation through multivariate regression models and utilize boosting-type method to handle the high dimensionality as well as model the possible nonlinear associations. The performance of the proposed method is demonstrated through simulation studies. Finally, our multivariate boosting method is applied to two breast cancer studies.
Introduction
High-resolution microarrays and second-generation sequencing platforms are powerful tools to investigate genome-wide alterations in DNA copy number, methylation, and gene expression associated with a disease. An integrated genomic profiling approach measures multiple omics data types simultaneously in the same set of biological samples. As integrated genomic studies emerge, it has become increasingly clear that true oncogenic mechanisms are more visible when combining evidence across patterns of alterations in DNA copy number, methylation, gene expression, and mutational profiles.1,2 Integrative analysis of multiple omic data types can help the search of potential drivers by uncovering genomic features that tend to be dysregulated by multiple mechanisms. 3
This paper is motivated by two specific applications of integrative analysis of cancer genomic data. The first application is to study the influence of DNA copy number alterations (from array comparative genomic hybridization (aCGH)) on RNA transcript (from microarray gene expression experiments) levels. While useful information has been revealed by analyzing expression arrays alone or CGH arrays alone, careful integrative analysis of DNA copy numbers and expression data is necessary as these two types of data provide complimentary information in gene characterization. Specifically, RNA data contain information on genes that are over/underexpressed, whereas DNA copy numbers contain information on gains and losses that are potential drivers of cancer. Therefore, integrating DNA and RNA data may help discern more subtle (yet biologically important) genetic regulatory relationships in cancer cells. 4
The second application is to investigate the association between DNA methylation and gene expression. The advancement of global DNA methylation arrays and next-generation RNA sequencing transcriptome studies now allow scientists to investigate the functional consequence of DNA methylation in various genomic regions, including CpG islands (CGIs), which have been extensively investigated in the literature.5–7 Generally, methylation of regulatory CGIs is thought to downregulate transcription by promoting the formation of heterochromatin and preventing the binding of transcription factors (TFs). 8 In normal cells, CGIs are protected from methylation. However, hypermethylation of promoter CGIs of important genes, ie, tumor suppressor genes (TSGs), is frequently observed in cancer cells. 9 Thus, integrating DNA methylation and RNA data could bring a step closer in unraveling the complex genetic regulatory relationships in cancer cells.
The most straightforward way to model the dependence of RNA levels on DNA copy numbers or the dependence of gene expression on methylation is through a multivariate (multiple-response) regression model with gene expression as responses and the DNA copy numbers or methylation as covariates. Many other important biological problems can be modeled using the multivariate regression model as well. For example, in expression quantitative trait loci (eQTL) mapping, we can treat gene expressions as responses and genomic markers as covariates to identify genomic locations to which expression traits are linked.10,11 In the integrative analysis of gene expression and chromatin immunoprecipitation (chipchip) data, we can treat gene expression as responses and TFs as covariates to identify TFs that are related to cell cycle regulation. 12
While the multivariate linear regression is well studied in statistical literatures, the current problems pose new challenges because of (i) the complicated relationships among response variables, (ii) high dimensionality in terms of both covariates and responses, and (iii) possible nonlinear association between responses and covariates. Because of challenge (i), the naive approach of regressing each response onto the covariates separately is unlikely to produce satisfactory results, as such methods often lead to high variability and overfitting.13,14 For challenge (ii), sparse regularization schemes have been utilized in high-dimensional multivariate regression.15–18 Factor analysis has been considered to reduce the dimensionality as well.19–21 For challenge (iii), most of existing methods are based on linear models and may have inadequate performance when the linear assumption is violated.
Boosting, originally proposed as an ensemble scheme for classification, ie, AdaBoost,
22
has attracted a lot of attention both in the machine learning and statistics literature, mainly because of its flexibility in modeling possible nonlinear association and excellent prediction performance. Friedman et al.
23
demonstrated that the AdaBoost ensemble method can be represented as a stagewise forward additive modeling procedure, which leads to many new versions of boosting. One particular method is component-wise
In this paper, we introduce a novel multivariate component-wise boosting method, which extends the univariate component-wise boosting from the single-response setting to the multiple-response setting. Inherited from the univariate component-wise boosting, the proposed method is not only able to model the nonlinear association between response and covariates when nonlinear base learners are used but also able to avoid overfitting in high-dimensional setting because of the implicit shrinkage in the estimation of the method. By jointly fitting regression models on all responses, the proposed method is able to borrow strength across different responses and is shown to have better performance in both prediction and variable selection than the separate univariate boosting method.
Methods
We start our exposition by assuming that we have 
where
In the remaining of this section, we first review the univariate component-wise boosting method with single response, followed by presenting our multivariate component-wise boosting method with multiple responses.
Univariate component-wise boosting with single response
The component-wise boosting25,26 is a special version of the general boosting method.22–24 It starts from the null model, ie, the model with no covariate, and in each iteration, the model is updated by adding the covariate that yields the greatest improvement in the model fit at the current stage. We summarize the algorithm as follows.
Algorithm: univariate component-wise boosting
Step 1 (Initialization) Set iteration index
Step 2 (Component-wise regression) Compute residuals 
Step 3 (Model update) Select the covariate 
Update
Step 4 (Iteration) Increase iteration index
In Step 2,
The parameter
An advantage of the component-wise boosting method is the computation efficiency, since in each iteration, only univariate models are fitted. This makes the boosting method very suitable for analyzing high-dimensional data.
Multivariate component-wise boosting
We now consider the multiple-response setting. The key of our extension from single-response boosting to multi-response boosting is to modify the way to select the best covariate to update the model to borrow strength across multiple responses. We use the integrative analysis of DNA copy numbers and expression data as an example. Suppose a DNA copy number alteration is associated with several genes, but these individual associations are all relatively weak. If we look at the association between the DNA copy number alteration and gene expressions one by one (single-response regression), we may fail to discover this alteration. However, if we can combine the signal across different genes and consider an overall association between this alteration and all genes, we may have a better chance of identifying the alteration. This enlightens us to consider selecting 
where we adjust the MSE by the square of Euclidean norm of the corresponding residual. This adjustment is shown to work better than the unadjusted method in our numerical analysis. When there is only one response, we can see that the criterion given by (2) is equivalent to the criterion used in the univariate component-wise boosting.
Once the covariate
Algorithm: multivariate component-wise boosting
Step 1 (Initialization) Set iteration index
Step 2 (Component-wise regression) Compute residuals 
Step 3 (Model update) For each covariate 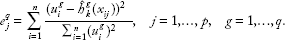
Select the covariate
Step 4 (Iteration) Increase iteration index
The covariate importance can be evaluated using the similar strategy as component-wise boosting with single response described in Section 2.1. For each covariate, the response-specific importance score is calculated by the cumulative adjusted MSE for each response. The overall importance score for a covariate is the summation of its response-specific importance scores. The R code is available upon request.
We would like to point out that Lutz and Buhlmann
30
also proposed a multivariate component-wise
Simulation Study
In this section, we conduct simulation studies to demonstrate the operating characteristics of our multivariate component-wise boosting method. We consider five methods: separate analysis with the lasso method (slasso), multivariate adaptive regression splines (MARS), 31 regularized multivariate regression for identifying master predictors (RemMap), 18 the separate univariate boosting method (sboost), and our multivariate boosting method (mboost). For boosting methods, we consider three base learners: ordinary least square (ols), one-level regression tree (tree), and smoothing spline (spline). The lasso method is implemented using R package glmnet, the MARS method is implemented using R package earth, and the RemMap method is implemented using R package remMap.
Simulation setup
We consider two scenarios: (1) the true model is linear and (2) the true model is nonlinear. In scenario (1), we simulate data for 
where
In scenario (2), we simulate data for 
where
Simulation analysis
For both scenarios, we repeated the simulation for 100 times. All tuning parameters were selected using five-fold cross-validation. To evaluate the variable selection performance of a method, we consider the following two measurements, namely sensitivity and specificity:


where
To evaluate the prediction performance of the model, in each simulation, we generated a test set with 
where
Simulation results
The simulation results are summarized in Table 1. In both linear and nonlinear scenarios, the multivariate boosting method has smaller average MSEs, higher sensitivity, and higher specificity than the separate univariate boosting, no matter which base learner is used. When the true model is linear, the multivariate boosting with OLS as base learner has smaller average MSEs than the other two multivariate regression methods: MARS and RemMap. When the true model is nonlinear, the multivariate boosting with a nonlinear base learner (tree or spline) has a clear advantage in prediction over MARS and RemMap. The multivariate boosting method also has either significantly higher or comparable sensitivity and specificity than MARS and RemMap.
Real Application
In this section, we analyze two publicly available breast cancer datasets from integrative cancer genomic studies.
Integrative analysis of gene expression data and copy number variation data
In this subsection, we analyze a breast cancer dataset described in Sorlie et al. 32 The dataset contains both the microarray gene expression and aCGH profiled for 172 breast cancer specimens. For each specimen, we have expression profiles of 578 genes and 384 copy number alteration intervals (CNAIs). Since variations in DNA copy number play an important role in cancer development through altering the expression levels of cancer-related genes, we would like to identify important genes in aCGH experiment, model the association of RNA transcript level with gene copy number, and predict the RNA transcript levels using DNA copy number variations in aCGH experiments. The details of data preprocessing can be found in Peng et al. 18
Results of simulation studies. In each cell, the number outside the parenthesis is the average value over 100 replications and the number within the parenthesis is the corresponding standard error.

In our analysis, the 172 samples were randomly split into a training set (120 samples) and a test set (52 samples). All methods were applied to training set to build the predictive models. All tuning parameters were selected using five-fold cross-validation. Once an optimal model was obtained, it was used to predict the gene expression profiles for samples in the test set. To evaluate the prediction performance of the model, we calculate the following SAMSE on the test set:

where
The procedure was repeated 100 times, and the results are shown in Table 2. The multivariate boosting method with tree as the base learner has the smallest average MSE among all methods, which suggests a possible nonlinear association between gene expression and copy number alteration. In addition, the multivariate boosting method tends to select a smaller number of CNAIs than the separate univariate boosting method, no matter which base learner is used. When the ordinary least square is used as the base learner, our multivariate boosting methods select a smaller number of CNAIs than the other two methods based on linear model, RemMap and slasso. The performance of MARS method is inadequate. It has the largest AMSE and selects only about four CNAIs in average. This may be because the MARS method selects CNAIs in the all-in-all-out fashion, ie, a CNAI is considered to be associated with either all genes or no gene, but the true relationship pattern is possibly that one CNAI only affects a subset of genes.
We also calculate the average covariate importance scores over 100 replicates for both univariate boosting method and multivariate boosting method. Figure 1 shows the concentration plots of the importance scores. For each concentration plot, the covariate importance scores are sorted from the largest to the smallest. The
Table 3 lists the 10 CNAIs with top average importance scores selected by the multivariate boosting methods. We can see that there is a strong concordance among multivariate boosting methods with three different base learners on selected CNAIs with high important scores. Among the identified CNAIs, loss of heterozygosity on chromosome 19p13 33 has been shown to be one of the most frequent alteration observed in breast cancer, whereas breast cancer-related genes such as PYCARD, IL4R, and PLK1 are located within chromosome 16p13.3–16p11.2.
Results of integrative analysis of expression and copy number alteration on Sørlie's breast cancer dataset. In each cell, the number outside the parenthesis is the average value over 100 replications and the number within the parenthesis is the corresponding standard error.

Integrative analysis of gene expression data and methylation data
In this subsection, we analyze a breast cancer dataset described in The Cancer Genome Atlas (TCGA) Network. 34 The purpose of the analysis is to model the association between gene expression and DNA methylation across CpG sites. In our analysis, we consider a set of 808 cancer-related genes derived from published cancer gene lists. Furthermore, we focus on genes in chromosomes 13 and 17 as these two chromosomes have been shown to exhibit strong implication in breast cancer development,35,36 thus enabling us to better relate our results to known biological findings. Finally, we remove genes whose number of missing values is greater than 10 and remove subjects with any missing values. The final dataset has 333 samples with gene expression profiles of 41 genes and methylation values of 88 CpG sites.

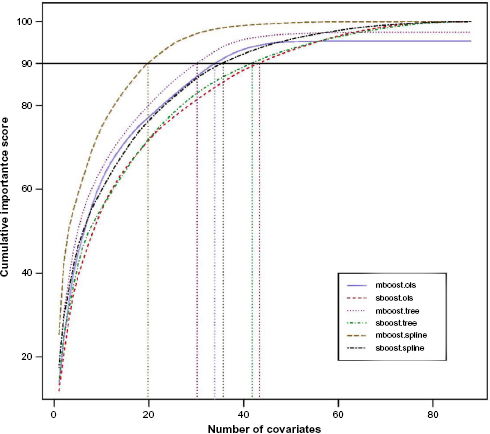
Concentration plots of covariate importance scores for boosting-based methods.
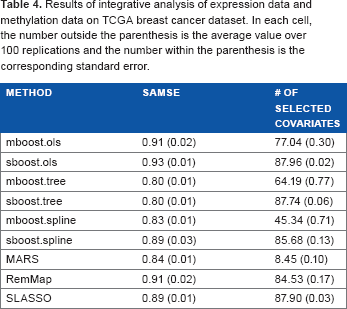
In our analysis, the 333 samples were randomly split into a training set (267 samples) and a test set (66 samples). The data analysis procedures are the same as described in Section 3.1. The results are shown in Table 4. Similar to the results of integrative analysis of gene expression and copy number alterations, the MARS method has an inadequate performance. It has the largest AMSE among five methods and selects only about nine CpG sites in average. This may be because the all-in-all-out selection fashion of MARS does not fit the data well. All methods except MARS have comparable prediction performances; however, our multivariate boosting method has much smaller model size compared to other methods. Figure 2 shows the concentration plots of the average importance scores over 100 replicates. From the plots, we can see that the covariate importance scores given by multivariate boosting method are more concentrated than the importance scores given by separate univariate boosting method. For example, when the smoothing spline is used as the base learner, the top 20 covariates selected by the multivariate boosting method have a cumulative importance score of 90, while the separate univariate boosting method needs approximately 40 covariates to reach the cumulative importance score of 90.
Lists of top 10 CNAIS selected by multivariate boosting methods.
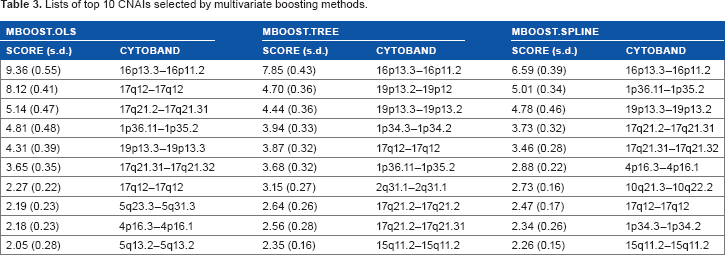
Table 5 lists the 10 CpG sites with top average importance scores selected by the multivariate boosting methods. We can see that there is a strong concordance among multivariate boosting methods with three different base learners on selected CpG sites with high important scores. Among these selected genes, GFAP, GRB7, ALOX12, MFAP4, and HOXB2 are well unknown to be related to breast cancer.
Results of integrative analysis of expression data and methylation data on TCGA breast cancer dataset. In each cell, the number outside the parenthesis is the average value over 100 replications and the number within the parenthesis is the corresponding standard error.
Discussion
In this paper, we propose a novel multivariate component-wise boosting method to fit multivariate regression models. The proposed method is able to model the possible nonlinear associations between responses and covariates. By jointly fitting models across multiple responses, our method identifies important covariates based on their overall effects across responses. The performance of the proposed methods is demonstrated using both simulation studies and real data analysis.
In many important problems, there could be natural grouping structures in responses and/or covariates. For example, in eQTL study, on one hand, genes belonging to the same pathway can be grouped together, and we may expect a single nucleotide polymorphism (SNP) to be associated with many genes within a pathway. On the other hand, SNPs belonging to the same gene can be grouped together, and we may expect several SNPs within a same coding region are associated with the expression of one gene. Integrating these grouping structures in the analysis may help boost the signal-to-noise ratio. 37 Our proposed method can be modified to take into account these grouping information in the analysis as follows.
Suppose that there are 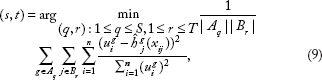
Concentration plots of covariate importance scores for boosting-based methods.
Lists of top 10 CpG sties selected by multivariate boosting methods.

In our current manuscript, we investigate the association between two genomic data sets, one as covariate matrix and the other as response matrix. An interesting future extension of our proposed multivariate boosting method is to consider multiple genomic datasets as covariates and/or responses, each with potentially a different distribution (eg, discrete, categorical, or continuous). Such integrative analysis might bring us a step closer in understanding the complex process of cancer cell development, in collective efforts to realizing the promise of personalized medicine.
Author contributions
Conceived and designed the experiments: PK, SK, SW. Analyzed the data: LX, JT, SK, SW. Wrote the first draft of the manuscript: LX, SW. Contributed to the writing of the manuscript: PK, JT, SK. Agree with manuscript results and conclusions: LX, PK, JT, SK, SW. Jointly developed the structure and arguments for the paper: LX, PK, JT, SK, SW. Made critical revisions and approved final version: PK, SK, SW. All authors reviewed and approved of the final manuscript.