
Abstract
Superparamagnetic iron oxide nanoparticles (MNPs) together with magnetic resonance imaging (MRI) are the preferred tools for monitoring the fate and biodistribution of administered cells in stem cell therapy studies. Commercial MNPs need transfection agents and long incubation times for sufficient cell labeling and further in vivo cell detection. In this work, we have synthesized MNPs coated with pluronic F127 and tetronic 908, and validated their applicability as contrast agents for MRI cell detection on two different cell types: rat mesenchymal stem cells (MSCs) and multipotent neural progenitor cell line from mice (C17.2). No transfection agent was needed for a complete MNP internalization, and the uptake was only dependent on MNP concentration in medium and limited on the incubation time. By combining in vivo MRI and ex vivo histology microscopy, we have demonstrated the MRI signal detected corresponded exclusively to labeled cells and not to free particles. Pluronic F127- and tetronic 908-coated MNPs represent promising contrast agents for stem cell tracking due to their ease of use in preparation, their efficiency for cell labeling, and their high sensitivity for in vivo cell detection.
Keywords
Introduction
Cell transplantation has shown promising results in experimental models of several diseases such as stroke with several types of cells; however, the mechanisms that mediate the recovery are less understood (11,16,52). Integration into host tissue, immunomodulation processes, or growth and trophic factor secretion are possible modes of action; however, fundamental questions related to biodistribution or fate remain partially unanswered (11,44). Cell tracking and imaging can help in bridging these open gaps. In the field of cell imaging, several non-invasive techniques for in vivo studies have been developed; however, magnetic resonance imaging (MRI) combined with contrast agents as superparamagnetic iron oxide nanoparticles (MNPs) has the highest potential to meet the required resolution (2,10,39). Several types of MNPs have been developed in last years, with the aim of finding the best balance between low cytotoxicity, cell detection, and tagging efficiency, the last one mainly being influenced by the coating. Dextran is one of the most commonly used coatings (9,36); however, cellular labeling with dextran-coated nanoparticles requires the use of transfection agents, such as poly-L-lysine or lipofectamine, for an efficient cell tagging, which can result in toxic side effects depending on their concentration (3,27,38,47). The use of MNPs, however, is not only limited to cell tracking but also includes theranostic applications, as shown by use in tumor detection and therapy (24,43), where other polymeric coatings have been used (20–22,51,53). In this regard, MNPs stabilized with block copolymers, such as pluronic F127 (P127) or tetronic 908 (T908), have emerged as efficient formulations for tumor imaging and macrophages labeling (20), but their use for in vivo stem cell tracking remains largely unexplored.
With this purpose, in this study, we synthesized MNPs coated with P127 and T908 and validated their applicability as in vivo contrast agents for MRI cell detection on two different cell types employed in cell therapy: rat mesenchymal stem cells (MSCs) and a multipotent neural progenitor cell (NPC) line from mice (C17.2) after an intraparenchymal administration.
Materials and Methods
Cell Lines
MSCs (Cultrex; Trevigen, Gaithersburg, MD, USA) were cultured in Iscove's modified Dulbecco's medium (IMDM; 78%), fetal bovine serum (FBS; 10%), horse serum (10%), penicillin–streptomycin (1%) (Gibco, Paisley, UK), and amphotericin-B (1%) (Sigma-Aldrich, St. Louis, MO, USA). Cell passage numbers between 7 and 18 were used. C17.2 cells were provided by Dr. Markus Aswendt and Prof. Mathias Hoehn (Max-Planck Institute, Cologne, Germany) and cultured in Dulbecco's modified Eagle's medium (DMEM; 78%), FBS (10%), horse serum (5%), penicillin–streptomycin (1%) (Gibco), and amphotericin-B (1%) (Sigma-Aldrich).
Synthesis and Characterization of P127- and T908-Coated Superparamagnetic Nanoparticles
P127- and T908-coated magnetic nanoparticles were prepared through a two-step procedure following a protocol described elsewhere (21) with several modifications. Briefly, in order to form the magnetic core, aqueous solutions of 0.1 M Fe(III) (Sigma-Aldrich) and 0.1 M Fe(II) (Sigma-Aldrich) in a volume ratio 2:1 were mixed (stirring ratio, 400 rpm) under N2 atmosphere and room temperature (RT). Ammonium hydroxide (5 ml, 5M) (Merck, Darmstadt, Germany) was added dropwise to produce the particles. After 10 min, 46 μl of oleic acid (OA) (Sigma-Aldrich) was added, and the temperature was raised to 80°C and maintained for 20 min under an N2 atmosphere. The solution was cooled down to RT, and the suspension was washed for magnetic separation using distilled water (DW) (pH 9.5). Then 5.5 mg of nanoparticles in 4 ml of chloroform (Sigma-Aldrich) was sonicated for 5 min. This solution was mixed with 40 mg of polymer and stirred for 5 min. After chloroform evaporation, DW was added and the mixture was placed on a shaker for 1 h. MNPs were washed three times with DW and separated using a 0.2-T magnet.
A structural analysis of the magnetic cores was performed by transmission electron microscopy (TEM) and X-ray diffraction (XRD) data. A dried drop of OA-coated MNPs was measured on a TEM microscope (Philips CM-12; Bend, OR, USA) operating at 120 kV and with a Philips powder diffractometer fitted with Philips PW1710 control unit, vertical Philips PW1820/00 goniometer, and FR590 Enraf Nonius generator (Rotterdam, The Netherlands), respectively. Nanoparticle shape was determined by circularity determination of 210 nanoparticles using ImageJ software [http://imagej.nih.gov/ij/; National Institutes of Health (NIH), Bethesda, MD, USA]. The nanoparticle circularity value was defined as 4πA/P2, where A is the particle area and P is its perimeter, and approaches 1 for an ideal circle. Particles with circularities of 0.25 or below may be considered aggregates or artifacts in the size analysis. Magnetic properties of the nanoparticle cores were recorded on a vibrating sample magnetometer (VSM) (Quantum Design Inc., San Diego, CA, USA). The iron content was determined by inductive coupled plasma optical emission spectroscopy (ICP-OES) (Varian Medical Systems, Palo Alto, CA, USA), and the mean hydrodynamic particle size was measured using a dynamic light scattering (DLS) ALV-5000F (ALV-GmbH, Langen, Germany) instrument with vertically polarized incident light (488 nm) supplied by a diode-pumped Nd:YAG solid-state laser (Coherent Inc., Santa Clara, CA, USA). Zeta potentials of polymer-coated MNPs were measured using a Zetasizer Nano ZS instrument (Malvern Instruments Ltd., Malvern, UK) equipped with a red laser (633 nm) in backscatter mode at 25°C. Polymer adsorption onto the cores was confirmed by Fourier transform infrared spectroscopy (FTIR) with a FTIR spectrometer (FTIR 670; Varian Inc.) and quantified by thermal gravimetric analysis (TGA) on a Q5000IR (TA Instruments, New Castle, DE, USA).
Cell Labeling with MNPs
For cell labeling, two different MNP concentrations, 35 and 15 μg/ml, and two cellular incubations times, 24 and 6 h, were studied (n = 6).
Both cell types were labeled following a protocol described elsewhere (48) with slight modifications. After coincubation of MNPs and cells, the MNP-containing medium was removed, and cells were washed three times with 1.5 ml of phosphate-buffered saline (PBS; without Mg2+ and Ca2+; Gibco) to remove nonattached MNPs. After washing, the cells were left for 12 h in 1 ml of fresh label-free medium. Next, medium was removed, cells were washed once with 1.5 ml of PBS, and 0.5 ml of ethylenediaminetetraacetic acid (EDTA)–trypsin (Gibco) was added to detach the cells from the well. The trypsin was neutralized with fresh medium, and the detached cells were collected in a 50-ml tube (BD Falcon, Bedford, MA, USA). After a mild centrifugation (12 × g), the supernatant was discarded and the cells were resuspended in fresh medium.
Cell Labeling with CellTrace™ CFSE
CellTrace CFSE is a stable, well-retained fluorescent label normally used to monitor distinct generations of proliferating cells by dye dilution (41). However, in this study, CFSE enabled the histological detection of administered cells. After labeling with MNPs and 2 h prior to the administration, the cell medium was removed and CFSE labeling was performed by following the manufacturer's protocol (CellTracer CFSE Cell Proliferation Kit for flow cytometry; Invitrogen, Paisley, UK). In short, cells were incubated with 2 μl of CFSE in 2 ml of 37°C PBS for 15 min. Then PBS was removed, and fresh medium was added for a further incubation of 45 min.
Cell Count Determination
To determine the influence of the labeling on the cellular proliferation, total cell count was performed with trypan blue staining (STEMCELL Technologies, Grenoble, France) and a Neubauer counting chamber (Blaubrand; Sigma-Aldrich). Samples were diluted 1:5 with PBS and 1:2 with trypan blue. Cell count was performed by using an inverted microscope (Olympus IX51; Tokyo, Japan).
Cell Viability Assay
For assessing the viability of the cells after labeling, supernatants from the last 12-h incubation step were collected, including a negative control of lysed cells. Cell viability was determined by means of a lactate dehydrogenase assay (LDH) (Sigma-Aldrich), following the manufacturer's protocol. In brief, supernatants were centrifuged at 12 × g for 5 min and further incubated with LDH reagents for 20 min. Next, the plate was read in a Synergy2 microplate reader (Biotek Instruments, Winooski, VT, USA) at 490 nm, and the viability rate was calculated with respect to control and lysates values.
Intracellular Iron Determination
Iron uptake per cell was quantified by dissolving 100,000 cells in 1 ml of HCl 37% extra pure (Merck). DW was added to reach a total volume of 5 ml. Iron concentration was determined by ICP-OES (Varian Inc.). The intensity of the emission line at 238.204 nm was measured for iron and compared to a standard solution.
Prussian Blue Staining
Prussian blue staining was performed to demonstrate the uptake of the MNPs by the cells. Labeled cells were plated and after 8 h were washed with PBS and incubated for 20 min with a mixure of equal part of aqueous solution of 20% HCl 37% extra pure and aqueous solution of 10% potassium ferrocyanidetrihydrate [KFe(CN)6·3H2O, FW 422.2; Sigma-Aldrich]. After incubation, cells were washed three times with PBS, and images were taken using an inverted microscope (Olympus IX51).
Transmission Electron Microscopy
To assess the localization of the MNPs in the cell, TEM images of the cells were taken. Fixation and postfixation of 5 × 10⁵ cells were performed in 2% glutaraldehyde (Sigma-Aldrich) and in 1% osmium tetroxide (OsO4) (Sigma-Aldrich), in sodium cacodylate buffer (Sigma-Aldrich), respectively. Inclusion was done in Spurr's epoxy resin (Sigma-Aldrich). Semithin sections (0.5 μm) were stained with toluidine blue (Sigma-Aldrich), and ultrathin sections (100 nm) were stained with uranyl acetate (Sigma-Aldrich) and lead citrate (Sigma-Aldrich).
Animal Studies
All experimental protocols involving the use of research animals were approved by the institutional ethics committee of the Hospital Clínico Universitario of Santiago de Compostela and were performed according to the guidelines of the Animal Welfare Committee of the Hospital Clínico Universitario of Santiago de Compostela and in accordance with applicable legislation of the European Union (86/609/EEC, 2003/65/EC, 2010/63/EU, RD 1201/2005, and RD 53/2013).
A total of two male Sprague–Dawley rats (Harlan Laboratories, Barcelona, Spain) weighing 285 and 300 g, respectively, were used in this study. Animals were kept in a controlled environment at 22 ± 1°C and 60 ± 5% humidity, with 12:12-h light/darkness cycles. Animals were fed ad libitum with standard diet pellets and tap water. All surgical procedures and MRI studies were conducted under sevofluorane (Abbott Laboratories, Lake Bluff, IL, USA) anesthesia (3–4%) using a carrier 65:35 gas mixture of N2O/O2. To study the in vivo contrast introduced by the designed MNPs in the rat brain, intraparenchymal injections of 10 μl of 50,000 P-MNP- or T-MNP-labeled MSCs in PBS were performed through a hole drilled into the skull of the animals. MRI scans were performed immediately after cell injections.
Briefly, rats were placed in a stereotaxic frame (Stoelting Co., Wood Dale, IL, USA) under sevoflurane anesthesia. A 1-cm-long midline incision was made in the scalp, beginning midway between the eyes and terminating behind the lambda. A cotton swab was used to clear away the soft tissue covering the skull. A Hamilton syringe (10 μl; Hamilton, Reno, NV, USA) was filled with 10 μl of 50,000 P-MNP- or T-MNP-labeled MSCs and mounted onto the injection pump, and the needle was positioned directly over the bregma. The x, y, and z axis coordinates were all set to zero. The needle was then positioned at the entry point, +0.6 mm anterior and −2.9 mm lateral of the bregma to the right. A small cranial burr hole was drilled through the skull at the entry point. The needle was slowly inserted into the basal ganglia to a depth of 5.5 mm below the surface of the skull, and labeled cells were injected at a rate of 0.1 μl/min over 10 min. The needle was left in place for 10 min and then removed at a rate of 1 mm/min to prevent the reflux of cells and blood. The burr hole was filled with bone wax (Ethicon, Somerville, NJ, USA), and the scalp incision was closed.
Magnetic Resonance Imaging
MRI studies were conducted on a 9.4-T MR system (Bruker Biospin, Ettlingen, Germany) with 440 mT/m gradients. A quadrature radiofrequency transmit–receive resonator was used for data acquisition.
For P-MNP and T-MNP MRI and further relaxivity determinations, agar phantoms were made following a procedure described elsewhere (48) with different concentrations of P-MNPs (0.36, 0.18, 0.09, and 0.04 mM) and T-MNPs (0.45, 0.22, 0.11, and 0.06 mM). T2 weighting was achieved by using a multislice multiecho spin-echo (MSME) sequence with the following acquisition parameters: field-of-view (FOV) of 7.5 cm × 7.5 cm, echo time of 7.32 ms, repetition time of 5.4 s, 16 echoes (incremented by 7.32 ms), 14 slices, and 1 average. Postprocessing using ImageJ software (http://imagej.nih.gov/ij/; NIH) enabled the calculation of relaxation time (T2), relaxation rate (R2), and relaxivity (r2) determination.
For MRI of labeled cells, agar phantoms with 100,000 cells per condition were scanned. T2*-weighted MRIs were acquired using a multigradient echo (MGE) sequence with a 4.44-ms echo time, 6.75-ms echo spacing, 1.8-s repetition time, 16 echoes, 14 slices, 2 averages, FOV of 7.5 cm × 7.5 cm, and matrix size of 256 × 256. Postprocessing was performed using ImageJ software (http://imagej.nih.gov/ij/; NIH) For in vivo cell detection, MRIs were acquired using a cross-coil setup, consisting of a linear birdcage resonator of 7-cm diameter, for transmission, and a 2 × 2 arrayed surface coil for signal detection (both from Bruker Biospin). T2*-weighted MRIs were acquired with the same parameters as for the phantom study. Postprocessing was performed using ImageJ software (http://imagej.nih.gov/ij/; NIH).
Ex Vivo Analysis
Animals were deeply anesthetized and transcardially perfused with 100 ml of PBS (0.1 M, pH 7.4) and 150 ml of 4% formaldehyde (VWR Chemicals, Leuven, Belgium) immediately after MRI studies. Brains were carefully removed from the skull and sectioned in 2-mm slices in a matrix. Slices were postfixed by immersion in 4% formaldehyde overnight, dehydrated, and embedded in 4% paraffin (VWR International a/s, Albertslund, Denmark). Prussian blue staining was performed to detect MNP-labeled cells in brain parenchyma, and fluorescence microscopy images were taken to determine the CFSE-labeled cell localization (Olympus IX51).
Statistical Analysis
Results were expressed as mean ± standard deviation (SD). Statistical analyses were performed using a Student's t-test or one-way analysis of variance (ANOVA) followed by Bonferroni post hoc test to compare cell count and viability between groups. A valued of p < 0.05 was considered statistically significant. The statistical analysis was conducted using PASW Statistics 18 for Mac (IBM, Armonk, NY, USA).
Results
Pl127- and T908-Coated Superparamagnetic Nanoparticle Characterization
Magnetic cores coated with OA were obtained through the chemical coprecipitation method, with a mean circularity of 0.87 ± 0.17 and core size of 8.6 ± 1.4-nm diameter as determined by TEM (Fig. 1A), of 7.7 ± 0.8-nm diameter as determined by XRD spectroscopy (Fig. 1B), and of 7.3 ± 0.8-nm diameter as determined by DLS. The core crystal structure determination using the XRD spectrum showed peaks at 2θ positions of 30.2°, 35.6°, 43.2°, 57.1°, and 62.7°, corresponding to the 220, 311, 400, 511, and 440 planes of magnetite, respectively, with a lattice parameter of 8.361 ± 0.004 Å (Fig. 1B). Data obtained through VSM measurements showed that the cores exhibited superparamagnetic behavior at RT (Fig. 1C). For further nanoparticle surface functionalization, the presence of attached OA was evaluated through TGA. Two peaks were observed at 180°C and slightly above 200°C, corresponding to a mass loss percentage of 18% of OA. The main peak was observed at ca. 350°C with a 26 wt% of mass loss percentage corresponding to block copolymers (Fig. 1D1).

P-MNP and T-MNP characterization. (A) TEM image of MNP spherical-shaped cores synthesized through chemical coprecipitation. Scale bar: 50 nm. (B) X-ray diffraction (XRD) spectrum of magnetic nanoparticle cores synthesized through chemical coprecipitation method. (C) Magnetization versus magnetic field plots for magnetic cores of superparamagnetic nanoparticles. The absence of hysteresis loop at 300K indicates that synthesized MNPs have a superparamagnetic behavior at RT. While at 5K the particles behaved as ferrimagnets, as revealed by the hysteresis loop, showing coercivity field and remnant magnetization, as can be noted in the inset graph. (D1) TGA of oleic acid (OA)-coated MNPs, (D2) TGA of P-MNPs, and (D3) TGA of T-MNPS. (E1) FTIR of oleic acid (OA)-coated MNPs, (E2) FTIR of P-MNPs, and (E3) FTIR of T-MNPS. Abbreviations: MNPs, superparamagnetic nanoparticles; P-MNPs, pluronic F127-coated superparamagnetic nanoparticles T-MNPs, tetronic 908-coated superparamagnetic nanoparticles; TEM, transmission electron microscopy; XRD, X-ray diffraction analysis; TGA, thermogravimetric analysis; FTIR, Fourier transform infrared spectroscopy.
Polymer coating was performed, and the hydrodynamic size measured by DLS was 154 ± 6 nm with a polydispersity index of 0.076 nm for pluronic-coated nanoparticles, and 180 ± 6 nm with a polydispersity index of 0.015 nm for tetronic-coated nanoparticles, respectively. The Z potential of these coated particles dispersed in DW was negative for both, being −18 ± 3 and −24 ± 3 mV, respectively. TGA of pluronic-coated iron oxide nanoparticles showed the presence of the polymer and the OA (Fig. 1D2). Two peaks were observed at about 260°C (20 wt%) and 310°C (35 wt%), close to OA and pure P127 boiling points, respectively. For T908-coated nanoparticles, the behavior was similar (Fig. 1D3), the first peak at about 260°C (26%) corresponding to OA and the second peak at 310°C (42 wt%) corresponding to pure T908 were detected. Polymer FTIR spectroscopy confirmed the adsorption of each block copolymers to the MNP surface (Fig. 1E1–1E3). Two broad peaks at approximately 440 and 610 cm−1 corresponded to Fe-O vibration modes (8) and ca. 1,430 and 1,600 cm−1 specific for symmetric and asymmetric stretching vibrations of COO–, respectively (50). It was also possible to identify the asymmetric CH2 and the symmetric CH2 stretching bands at 2,850 and 2,920 cm−1, respectively. The main difference between the polymer coated and uncoated nanoparticles in FTIR data was the peak at 1,100 cm−1, typical for symmetric stretching vibrations of C–O–C bonds (19). MRI contrast in T2-weighted images of the four different concentrations were measured. The relaxation rate (R2) was plotted versus iron concentrations, and a linear relationship was found between R2 and the MNP concentration, resulting in a transverse relaxivity (r2) of 398 ± 12 mM−1 s−1 for P127 and 330 ± 20 mM−1 s−1 for T908.
In vitro Validation of P127- and T908-Coated Superparamagnetic Nanoparticles: Cellular Internalization of P-MNPs and T-MNPs in MSCs and C17.2
For investigating the labeling capacities of P127- and T908-coated superparamagnetic nanoparticles (P-MNPs and T-MNPs, respectively), two concentrations of nanoparticles and two incubation times were evaluated in two different cell types. Cell labeling without the use of transfection agents was assessed by Prussian blue staining (Fig. 2). The tagging and the full cellular internalization of the nanoparticles were assessed by TEM for all experimental conditions (Fig. 3). P-MNPs and T-MNPs were found encapsulated in endosomal structures distributed throughout the cytoplasm in both cell types.
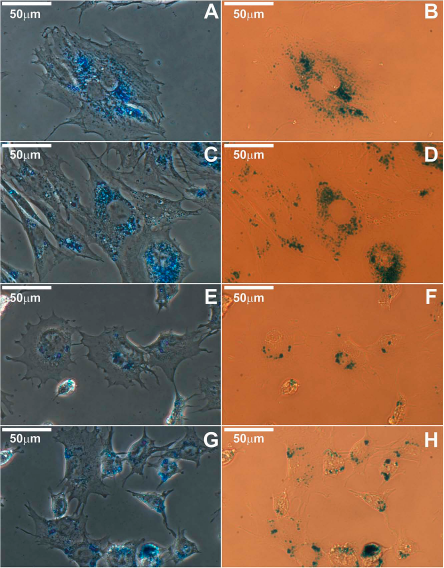
Prussian blue staining of MSCs and C17.2 cells. (A) Phase-contrast microscopy of P-MNP (35 μg/ml, 24 h)-labeled MSCs. (B) Bright-field microscopy of P-MNP (35 μg/ml, 24 h)-labeled MSCs. (C) Phase-contrast microscopy of T-MNP (35 μg/ml, 24 h)-labeled MSCs. (D) Bright-field microscopy of T-MNP (35 μg/ml, 24 h)-labeled MSCs. (E) Phase-contrast microscopy of P-MNP (35 μg/ml, 24 h)-labeled C17.2. (F) Bright-field microscopy of P-MNP (35 μg/ml, 24 h)-labeled C17.2. (G) Phase-contrast microscopy of T-MNP (35 μg/ml, 24 h)-labeled C17.2. (H) Bright-field microscopy of T-MNP (35 μg/ml, 24 h)-labeled C17.2. Scale bar: 50 μm. Abbreviations: MSCs, mesenchymal stem cells; C17.2, multipotent neural progenitor cell line from mice; MNPs, superparamagnetic nanoparticles; P-MNPs, pluronic F127-coated superparamagnetic nanoparticles; T-MNPs, tetronic 908-coated superparamagnetic nanoparticles.

Transmission electron microscopy (TEM) images of labeled MSCs. (A) MSCs labeled with P-MNPs (35 μg/ml, 24 h). (B) C17.2 labeled with P-MNPs (35 μg/ml, 24 h). (C) MSCs labeled with T-MNPs (35 μg/ml, 24 h). (D) C17.2 labeled with T-MNPs (35 μg/ml, 24 h). Black arrows indicate organelles filled with MNPs. Abbreviations: MSCs, mesenchymal stem cells; C17.2, multipotent neural progenitor cell line from mice; P-MNPs, pluronic F127-coated superparamagnetic nanoparticles; T-MNPs, tetronic 908-coated superparamagnetic nanoparticles.
Quantitatively, iron content, as determined by ICP-OES (Table 1 and Fig. 4A and B), showed that the internalized iron per incubation condition, as being between 36–39 pg Fe/cell and 9–16 pg Fe/cell for 24- and 6-h incubation times, respectively, for MSCs and between 17–39 pg Fe/cell and 8–14 pg Fe/cell for 24- and 6-h incubation times, respectively, for C17.2. On the basis of the TEM images and the iron internalization data, the MRI signal of labeled cells corresponded exclusively to internalized MNPs. Relaxation rates R2* were calculated from T2* maps as R2* = 1/T2*, resulting in relaxation rates R2* between 50 and 100 s−1 for all conditions (Fig. 4C and D). Signal changes for the first echo of MR T2*-weighted images can be easily observed in Figure 4E. Quantitative T2* maps were calculated by fitting pixel intensities of the MGE images to a monoexponential decay curve, on a pixel-by-pixel basis (Fig. 5).

Cellular iron internalization and MRI signal generated. (A) Intracellular iron determined by ICP-OES after different labeling conditions in MSCs (**p < 0.001 with respect to control cells). (B) Intracellular iron determined by ICP-OES after different labeling conditions in C17.2 (**p < 0.001 with respect to control cells). (C) Relaxation rates R2* of MSCs after different labeling conditions (*p < 0.05 respect to control cells). (D) Relaxation rates R2* of C17.2 after different labeling conditions (**p < 0.001 with respect to control cells). (E) Magnetic resonance (MR) T2*-weighted images of labeled MSC s and C17.2 embedded in a phantom for cell detection. All conditions show the presence of hypointense spots of labeled MSCs and C17.2, respectively, in the first echo of MGE T2*-weighted scans with a cell density of 500 cells/μl. Abbreviations: MRI, magnetic resonance imaging; ICP-OES, inductive coupled plasma optical emission spectroscopy; MSCs, mesenchymal stem cells; C17.2, multipotent neural progenitor cell line from mice; MGE, multigradient echo sequence.

MGE-MRI signal decay for phantoms loaded with MSCs after 35 μg/ml and 15 μg/ml P-MNP incubation for 24 h. T2* maps were calculated by fitting pixel intensities of the multigradient echo images to a monoexponential decay curve on a pixel-by-pixel basis.
Iron Content per Cell (pg) Deter mined by ICP-OES After Labeling Compared With Control

Values are mean with SD in parentheses. Two incubation times (6 h and 24 h) and two concentrations of MNPs in medium (35 μg/ml and 15 μg/ml) were studied. ICP-OEs, inductive coupled plasma optical emission spectroscopy; MNPs, superparamagnetic nanoparticles; P-MNPs, pluronic F127-coated superparamagnetic nanoparticles; T-MNPs, tetronic 908-coated superparamagnetic nanoparticles.
The well-being of labeled cells with respect to control cells was evaluated by comparing the cell count and the viability using the LDH assay (Fig. 6). A significant reduction in proliferation was observed for the longest incubation time (24 h) combined with the highest concentrations of MNPs. Compared to the control, no significant differences in cellular viability were observed; only 15 μg/ml of P-MNPs incubated for 6 h was found to be slightly reduced (p < 0.05).
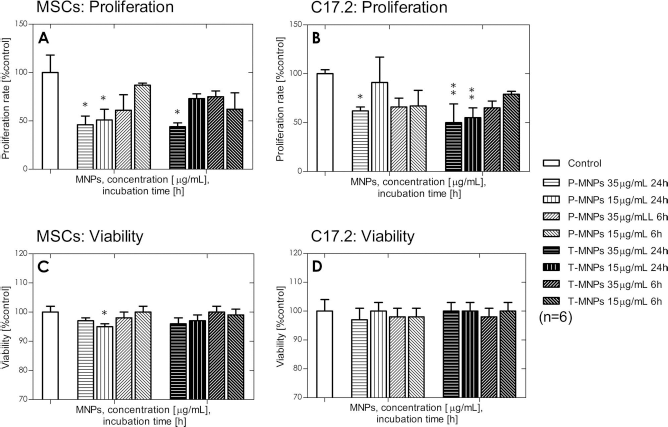
Cellular well-being after labeling. (A) MSC proliferation after labeling compared to control calculated through cell count. (B) C17.2 proliferation after labeling compared to control. (C) MSC viability determined by LDH after labeling compared to control. (D) C17.2 viability determined by LDH after labeling compared to control. *p < 0.05; **p < 0.01; ***p < 0.001. Abbreviations: MSCs, mesenchymal stem cells; C17.2, multipotent neural progenitor cell line from mice; P-MNPs, pluronic F127-coated superparamagnetic nanoparticles; T-MNPs, tetronic 908-coated superparamagnetic nanoparticles; LDH, lactate dehydrogenase assay.
In Vivo Validation of P127- and T908-Coated Superparamagnetic Nanoparticles for Cell Detection
On the basis of the excellent in vitro MRI detection capabilities of labeled cells, we assessed the in vivo detection after transplantation of P-MNP- and T-MNP-tagged and nontagged MSCs cells in the rat brain following an intraparenchymal administration. No MRI signal was detected for 5 × 10⁴ unlabeled cells in either animal (Figs. 7A and 8A); however, the needle trace can be observed after the delivery of P-MNP-labeled MSCs (red asterisk in Fig. 7A). On the other hand, the hypointensity observed in the right hemispheres corresponded to 5 × 10⁴ labeled MSCs (Figs. 7A and 8A). Immunofluorescence of brains after cell transplantation was performed to assess the colocalization of labeled MSCs and the generated MRI hypointensity, observed by CFSE fluorescence microscopy, Prussian blue staining, and T2*-weighted images, respectively (Figs. 7 and 8). CFSE-labeled MSCs were found in both hemispheres (Figs. 7D and E and 8D and E), but positive staining for Prussian blue was only observed for P-MNP- and T-MNP-labeled cells (Figs. 7C and 8C), evidencing the colocalization of MSCs, P-MNPs, or T-MNPs and MR T2* contrast generated.
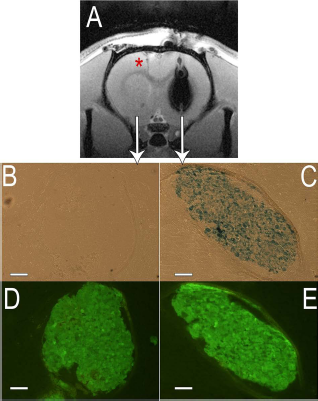
In vivo and ex vivo analysis of rat brain after an intraparenchymal administration of CFSE-labeled and P-MNP-CFSE labeled MSCs. (A) First echo of T2*-weighted images of a rat brain slice after intraparenchymal administration of CFSE-labeled MSCs in the left hemisphere and CFSE- and P-MNP-labeled MSCs in the right hemisphere. (B) Phase-contrast optical microscopy of a brain section after Prussian blue staining of CFSE-labeled MSCs. (C) Phase-contrast optical microscopy of a brain section after Prussian blue staining of CFSE- and P-MNP-labeled MSCs. (D) Fluorescent microscopy of same brain section as (B). (E) Fluorescence microscopy of a brain section after Prussian blue staining of CFSE- and P-MNP-labeled MSCs. Fluorescence microscopy of same brain section as (C). Scale bars: 100 μm. Abbreviations: MSCs, mesenchymal stem cells; P-MNPs, pluronic F127-coated superparamagnetic nanoparticles; CFSE, CellTracer CFSE Cell Proliferation Kit for flow cytometry.

In vivo and ex vivo analysis of rat brain after an intraparenchymal administration of CFSE-labeled and T-MNP-CFSE labeled MSCs. (A) First echo of T2*-weighted images of a rat brain slice after intraparenchymal administration of CFSE-labeled MSCs in the left hemisphere and CFSE- and T-MNP-labeled MSCs in the right hemisphere. (B) Phase contrast optical microscopy of a brain section after Prussian blue staining of CFSE-labeled MSCs. (C) Phase contrast optical microscopy of a brain section after Prussian blue staining of CFSE- and T-MNP-labeled MSCs. (D) Fluorescent microscopy of same brain section as (B). (E) Fluorescence microscopy of a brain section after Prussian blue staining of CFSE- and T-MNP-labeled MSCs, Fluorescence microscopy of same brain section as (C). Scale bar 100 μm. Abbreviations: MSCs, mesenchymal stem cells; T-MNPs, tetronic 908-coated superparamagnetic nanoparticles; CFSE, CellTracer CFSE Cell Proliferation Kit for flow cytometry.
Discussion
MRI combined with superparamagnetic nanoparticles is a powerful tool for studying the biodistribution of transplanted cells. The sensitivity of cell detection is mainly determined by two parameters: (i) composition of the core of the MNPs and (ii) the amount of MNPs internalized. This last factor is governed by size (6) and shape of the particles (14), but also by their surface functionalization (46), which largely regulates the interactions between the nanoparticles and the cells; nevertheless, special care must be taken to preserve the cellular functions of the labeled cells, since the migration of the administered cells remains interesting from a therapeutic point of view. MNP internalization is not a trivial issue, and therefore several strategies such as the use of transfection agents (1,4,23,28,42), cationic lipids (46), specific peptide functionalization (33), or electroporation (13,49) have been explored to increase the cellular uptake. In this work, we have refrained from using the above-mentioned methods and assessed the cell-labeling efficacies of P127- and T908-coated superparamagnetic nanoparticles (MNPs).
P-MNPs and T-MNPs were synthesized following a procedure described by Jain et al. (21), who initially developed P-MNPs as potential drug carrier systems for anticancer agents. The chemical coprecipitation method used for the magnetic nanoparticle synthesis is considered the easiest method to produce superparamagnetic nanoparticles. The main limitations of this method are the influences of several parameters such as temperature, pH, presence of oxygen in the reaction, stirring speed, Fe3+/Fe2+ molar ratio, and ammonium hydroxide addition process on the final particle size (31). The MNP cores obtained in this work are spherical shaped with a circularity of 0.87, a value close to 1, which represents a perfect circle. This value together with stable core sizes (about 8 nm) determined by three different techniques (TEM, XRD, and DLS) and with numerical values consistent with previous studies (21,34) makes this synthesis a reliable and easy procedure for obtaining MNPs. The XRD analysis exhibited typical magnetite peaks, indicating that the black-colored suspension obtained are magnetite nanoparticles, and VSM results showed their superparamagnetic behavior at RT. Within the synthesis, OA was added to create a hydrophobic OA shell surrounding the nanoparticle core, which will be used as an anchor for further polymer functionalization. The interaction between the OA and the iron oxide core can be classified in three fundamental structures (34) depending on the wave number separation (Δv0) between the vas(COO–) and the vs(COO–) from FTIR. In the present study, this value was 170 cm−1, which indicated the existence of a bidentate structure and confirmed that the OA was chemisorbed onto the core as a surfactant; however, the FTIR peak for polymer-coated MNPs was in 1100 cm−1. This demonstrated the presence of the copolymers in the coated-stabilized MNPs (12,21). The differences in size from the core (8 nm) and the coated nanoparticles (154 nm for pluronic-coated MNPs and 180 nm for tetronic-coated MNPs) could indicate that there are no single cores coated. To assess the transverse relaxivity measured by MRI and their suitability as MRI contrast agents, T2 maps were calculated. Our r2 [398 ± 12 mM−1 s−1 (P127) and 330 ± 20 mM−1 s−1 (T908)] are higher than similar commercial nanoparticles such as Resovist or Endorem, which dispersed in water and have r2 values from 54 to 185 L/mmol−1 s−1, depending on the magnetic field (0.47–4.7 T) (40). The difference between these commercial nanoparticles and our MNPs could be due only to the different medium in which the NPs were dissolved or the different magnetic field used for the analysis. Considering their size, composition, and dispersion stability in water, P-MNPs and T-MNPs were found to be suitable candidates for biological applications such as being used to tag cells for further MRI detection.
Cell tagging with P-MNPs and T-MNPs was performed by simple incubation of the particles with the target cells, MSCs and C17.2, and the selection of our MNP incubation times and concentrations was based on previous calibration tests (data not shown).
After MNP incubation, the cellular uptake must be complete, with all MNPs fully internalized (in contrast to membrane-bound MNPs), to obtain an unequivocal MRI signal from labeled cells and not from free particles or host macrophages that have internalized the MNPs (15,17). For this, a previously described internalization procedure (48) was followed, and TEM images of labeled cells demonstrated a complete internalization for all conditions studied. This easy incubation procedure for cell labeling was concentration dependent for P-MNPs and T-MNPs, but not incubation time dependent after 6 h, as reflected by the ICP-OES data. This dependence helps in the understanding of the internalization mechanism. The interaction between the MNPs and the cells could be mediated by gravitational forces (sedimentation) instead of surface attraction (5). In this way, after 6 h of incubation, P-MNPs and T-MNPs could be deposited onto the cell surface, facilitating the labeling; extending the incubation for 18 h more would not result in any difference regarding the amount of MNPs internalized. It is important to note that the aforementioned sedimentation did not lead to MNP aggregation during incubation since non-MNP conglomeration was observed in any case. The same concentrations of MNPs incubated for 6 or 24 h with MSCs or C17.2 showed similar values of iron internalization, about 30–40 pg/cell, which is in concert with previous reports, showing an increase in iron uptake up until 8 h (45). These values of internalized MNPs are significantly higher than published data of commercial nanoparticles Endorem, combined with transfection agents (poly-L-lysine) in MSCs, being less than 20 pg/cell for MNP incubation medium (from 50 to 200 μg/ml) and 24-h labeling time (28,39,48). However, a direct comparison between P-MNPs and T-MNPs with ferumoxides (Endorem) and ferucarbotran (Resovist), under the same experimental conditions, was not possible since they are not produced anymore by the pharmaceutical industry (29). Labeled cells were visualized in MRI phantoms at a density of 500 cells/μl to compare the results to those of other studies (28,48). Moreover, labeled cells can be visualized by MRI due to their effect on the local magnetic field, subsequently reducing the intensity of the signal in MGE sequences. Differences in gray scale could be observed and correlated to internalized iron; however, quantitative differences in R2* values were marginal due to the already strong contrast generated by low amounts of MNP-labeled cells. Therefore, the signal on the second echo MRI signal was almost fully eliminated, hampering a quantitative R2* estimation, as can be noted in Figure 5. In brief, a cell incubation with 35 μg of P-MNPs or T-MNPs, not longer than 6 h, was enough to obtain an efficient cell labeling, which demonstrates the efficacy of the protocol described.
Looking at the effect of P-MNPs and T-MNPs on cell behavior, longer incubation times and a greater amount of particles in medium did show a reduction in the cell count after the coincubation, which was not reflected by a decrease in viability. Cell count of MSCs and C17.2 was reduced, but cell death was not increased, as demonstrated by the LDH results. Previous studies have found that MNPs can interfere with cell viability assays, such as LDH or 3-(4,5-dimethylthiazol-2-yl)-2,5-diphenyltetrazolium bromide (MTT) (18,30). To avoid this interaction, in this study, the supernatants from labeled and nonlabeled cells after 12-h incubation with fresh medium were centrifuged, and pellets were discarded. In addition to this viability determination, no morphological or structural changes were observed by TEM. Moreover, labeled and unlabeled cells were harvested several times to perform Prussian blue staining. No differences in cell adhesion or morphological changes were detected after 8 h between groups, confirming the well-being of MNP-labeled cells despite a decrease in the cell count after incubation. Our work shows a promising labeling technique for the study of the in vivo biodistribution of stem cells without side effects; however, for a further therapeutic study with these tagged cells, it will be necessary to address the viability beyond 36 h. Otherwise, we have to understand the use of nanoparticles for cell tracking as an experimental tool to characterize the in vivo cell distribution and not as a clinical technique. Therefore, potential interaction between nanoparticles and cells on differentiation or proliferation long term is not relevant in this stage.
So far, we showed that P-MNPs and T-MNPs can be successfully used for in vitro cell tagging and detection in agar phantoms for MRI. Therefore, in a final step of P-MNP and T-MNP characterization as contrast agents for cell detection by MRI, an in vivo intraparenchymal delivery of MNP-labeled and unlabeled cells was performed. Intraparenchymal delivery route has been one of the most commonly used administration routes for several pathologies such as glioma (35), stroke (7,25,32), Parkinson's disease (37), etc., and the monitoring possibilities of injected cells would contribute to establishing the relationship between cellular biodistribution, migration, and outcome (26). Thus, MNP-labeled cells were administered in the right hemisphere, and MRI hypointensity was observed in T2*-weighted images, where a strong R2* effect due to the iron presence was noted. In the contralateral hemisphere, unlabeled but an identical number of cells was administered. No signal differences were observed for unlabeled cells compared to normal brain tissue. It should be noted that the needle trace can be easily observed in the cortex, assessing the correct administration localization.
To correlate the in vivo MRI results with the presence of MNP-labeled cells and unlabeled cells, ex vivo analysis of brain tissue was performed by Prussian blue staining for MNP detection and fluorescence microscopy examination of CFSE-labeled cells. MRI hypointense signals were observed in T2*-weighted MR images in the right hemisphere of the brain, which corresponded with positive Prussian blue staining and positive CFSE labeling, confirming that the P-MNPs and T-MNPs were still compartmentalized in the cells several hours after the administration. The cells without MNP labeling did not exhibit any contrast in T2*-weighted MRI nor in Prussian blue staining. However, the needle trace and CFSE-positive signal were observed, confirming their correct administration. The in vivo detection of labeled cells following an intraparenchymal injection in healthy animals was successfully addressed in this study, and it was confirmed that P-MNPs and T-MNPs are contrast agent complexes that can be used to assess the biodistribution of therapeutic cells after an intraparenchymal injection with high sensitivity. A further study of biodistribution following intravenous or intra-arterial administration routes in animal models of ischemic stroke or Alzheimer disease, for example, would help in elucidating the promising therapeutic effects that stem cells offer.
Conclusion
The present study assessed the use of P-MNPs and T-MNPs as contrast agents for MRI cell tracking in vivo. Cell tagging was performed by a simple coincubation of MNPs with the target cells, leading to an efficient and full MNP internalization without the need for transfection agents or other sophisticated approaches. The uptake was dependent up MNP concentration, and the cell labeling was performed with short incubation time periods. This may reduce possible side effects of excessive preculture, thus making this technique accessible for preclinical studies. In addition, we validated the in vivo detection of transplanted cells after an intraparenchymal administration in T2*-weighted MR images and correlated it to ex vivo cellular and MNP detection, evidencing that the contrast generated in MRI corresponds to labeled cells and not to free particles. P-MNPs and T-MNPs are easy-to-use labels for enabling MRI tracking of transplanted therapeutic cells in the brain, but their use could also be extended to other organs or tissues.
Footnotes
Acknowledgments
This study has been partially supported by grants from Instituto de Salud Carlos III (PI13/00292 and PI14/01879), Spanish Research Network on Cerebrovascular Diseases RETICS-INVICTUS (RD12/0014), Xunta de Galicia (Consellería Educación GRC2014/027), and the European Union program FEDER. Furthermore, this study was also cofunded within the POCTEP (Operational Programme for Cross-border Cooperation Spain–Portugal) program (0681_INVENNTA_1_E), cofinanced by the ERDF (European Regional Development Fund). T. Sobrino (CP12/03121) and F. Campos (CP14/00154) are recipients of a research contract from Miguel Servet Program of Instituto de Salud Carlos III. Finally, P. Taboada thanks Mineco and Xunta de Galicia for funding through projects MAT2013-40971-R and EM2013-046, respectively. J. Trekker is a recipient of a research grant from the IWT-Vlaanderen. The funders had no role in the study design, data collection and analysis, decision to publish, or preparation of the manuscript. The authors declare no conflicts of interest.