
Abstract
Recent advances in stem cell research have shown the promising nature of mesenchymal stem cells as plausible candidates for cell-based regenerative medicine. Many studies reported the use of human dental pulp stem cells (hDPSCs), which possess self-renewal capacity, high proliferation potential, and the ability to undergo multilineage differentiation. Together with this therapeutic approach, development of effective, noninvasive and nontoxic imaging techniques for visualizing and tracking the cells in vivo is crucial for the evaluation and improvement of stem cell therapy. Magnetic resonance imaging (MRI) is one of the most powerful diagnostic imaging techniques currently available for in vivo diagnosis and has been proposed as the most attractive modality for monitoring stem cell migration. The aim of this study was to investigate the labeling efficiency of hDPSCs using superparamagnetic iron oxide (SPIO) particles in order to allow visualization using in vitro and in vivo MRI without influencing cellular metabolism. MRI and transmission electron microscopy (TEM) showed optimal uptake with low SPIO concentrations of 15 μg/ml in combination with 0.75 μg/ml poly-l-lysine (PLL) resulting in more than 13 pg iron/cell and an in vitro detection limit of 50 labeled cells/μl. Very low SPIO concentrations in the culture medium resulted in extremely high labeling efficiency not reported before. For these conditions, tetrazolium salt assays showed no adverse effects on cell viability. Furthermore, in vivo MRI was performed to detect labeled hDPSCs transplanted into the brain of Rag 2-γ C immune-deficient mice. Transplanted cells did not show any signs of tumorgenecity or teratoma formation during the studied time course. We have reported on a labeling and imaging strategy to visualize human dental pulp stem cells in vivo using MRI. These data provide a solid base to allow cell tracking in future regenerative studies in the brain longitudinally.
Keywords
Introduction
Stem cells, with the capacity to differentiate into different cell types, raise the hope for future cell-based regenerative therapies. Especially, adult mesenchymal stem cells (MSCs), which have been described to be present in almost every organ, are gaining more interest because of their ease of isolation and elaborate differentiation potential and plasticity. This allows them to differentiate into the classical mesodermal lineages and even across the germ layers towards neural or myocardial cell fates (34, 47, 51, 52). In addition to this multilineage differentiation potential, MSCs exhibit other therapeutically interesting and relevant features. They were found to have a hypoimmunogenic phenotype together with strong immunosuppressive properties (7, 20, 35, 46). Furthermore, it has been proposed that these cells migrate to sites of tissue damage and inflammation, thereby producing growth factors and cytokines that might induce or facilitate repair of injured tissue (22). It has been shown that MSCs also have a tropism for wounding and tumor microenvironments, but the mechanisms underlying this recruitment are not yet fully understood (24).
Up to now, bone marrow is the most commonly used source of MSCs in biomedical research (12, 27). However, when considering future clinical applications, bone marrow isolation comprises a rather invasive technique with considerable risk of donor site morbidity, thereby creating discomfort to the patient. Moreover, only a limited number of MSCs can be isolated from the collected tissue, and it has already been shown that the number and differentiation potential of human bone marrow-derived MSCs significantly decreases with age (30, 42). Therefore, the search for alternative MSC sources is of significant value. Recent studies already described a novel population of cells with MSC characteristics, which can be isolated from the dental pulp of human third molar teeth (14). These cells have been described to possess self-renewal capacity, high proliferation potential, and the ability to undergo multilineage differentiation (13). The tissue regeneration potential of these dental pulp-derived mesenchymal stem cells (hDPSCs) has been demonstrated in vivo by their capacity to generate a dentin–pulp-like complex composed of tubular mineralized matrix with odontoblasts and fibrous tissue containing blood vessels, similar to the arrangement of the dentin–pulp complex found in vivo (3, 13, 14). Ultrastructural analysis of the extracellular matrix that is formed in vitro following multilineage differentiation showed a high similarity with the in vivo situation (44). Other studies reported strong angiogenic and neurogenic potential, the latter demonstrating that the differentiation potential of hDPSCs is not restricted to the mesodermal germ layer (18, 31). Recently, several studies described the migratory capacity of DPSCs in response to chemotactic cytokines in vitro (17, 45). Furthermore, it has been shown that neuronally predifferentiated DPSCs actively integrate into rat brain in vivo (25). Taken together, these studies provide sufficient evidence to regard hDPSCs as a promising alternative source of MSCs for future cell-based clinical applications.
Along with this therapeutic approach, development of effective, noninvasive, and nontoxic imaging techniques for visualizing and tracking the cells in vivo is crucial for the evaluation and improvement of stem cell therapy. Magnetic resonance imaging (MRI) is one of the most powerful diagnostic imaging techniques currently available for in vivo diagnosis and has been proposed as the most attractive modality for monitoring stem cell migration (4, 49). To allow MRI detection, however, the transplanted stem cells need to be labeled with MRI contrast agents. Generally, one can distinguish between superparamagnetic particles, paramagnetic compounds containing lanthanide chelates or other paramagnetic ions like Mn2+, and contrast agents that contain MR detectable nuclei other than hydrogen (1, 5, 6). The most widely used labeling approach makes use of superparamagnetic iron oxide (SPIO) nanoparticles (15). Because the large magnetic moment of SPIOs influences the magnetic field beyond the actual size of the particles, even small amounts of SPIO-labeled cells are detectible in MR images in vivo (5, 16). To increase magnetic labeling for efficient MRI, a variety of techniques—including particle conjugation to transfection agents (2) or a HIV transactivator of transcription (tat) peptide (28) as well as surface modifications of SPIO nanoparticles (19, 21, 37)—have been reported to improve cellular internalization of SPIO nanoparticles. In this study, clinical approved SPIOs (Endorem®) were selected because of their proven safety (FDA) for use in humans. Although SPIO cell labeling is regarded as an interesting cellular imaging modality, this method also has some limitations regarding selectivity and specificity of contrast, which have also been discussed in this paper.
The aim of this study was threefold: firstly, to investigate the efficacy by which hDPSCs can be labeled with SPIO nanoparticles (Endorem®) conjugated to poly-l-lysine (PLL) (atomic absorption spectroscopy and in vitro MRI); secondly, to assess the effect of this labeling technique on the differentiation potential, cell morphology (transmission electron microscopy), and the cellular metabolism {tetrazolium salt [3-(4,5-dimethylthiazol-2-yl)-2,5-diphenyltetrazolium bromide; MTT] assays}; and thirdly, to determine optimal labeling conditions for in vivo detection of hDPSCs transplanted into the brain of recombination activating gene 2 interleukin 2 receptor common-γ chain (Rag 2-γ C) immune-deficient mice (in vivo MRI).
Materials and Methods
Cell Culture Media and Chemicals
Minimal essential medium Eagle with α-modification (α-MEM), penicillin (P), streptomycin (S), fungizone (F), and l-glutamine were obtained from GIBCO Invitrogen Corp. (Paisley, Scotland, UK). Fetal bovine serum (FBS) was obtained from Biochrom AG (Berlin, Germany). All other chemicals unless stated otherwise were purchased from Sigma Chemical Co. (St. Louis, MO, USA).
Isolation and Culture of Human Dental Pulp Stem Cells (hDPSCs)
Dental pulp stem cells were isolated as previously described by Struys et al. (44). Briefly, human third molars that were extracted for therapeutic or orthodontic reasons with the patient's informed consent were used (n = 10; age = 16–19 years old; sex = both female and male). Immediately after extraction, the teeth were fractured mechanically, and the pulp tissue was removed by means of forceps. Tissue was collected in α-MEM supplemented with 10% heat-inactivated FBS, 2 mM l-glutamine, 50 μg/ml ascorbic acid, 1% P, 1% S, and 0.2% F and transferred to the laboratory for cell isolation. After washing in the same medium to remove any contaminating blood, the pulp tissue was minced into small fragments. These explants were transferred to six-well plates (Greiner Bio-One, Frickenhausen, Germany) containing the same medium as described above. The explants were left undisturbed for 14 days to allow migration of cells from the explants. Cells were cultured at 37°C in a humidified atmosphere containing 5% CO2 and medium was changed every 2 days. After 2 weeks, the explants were discarded from the culture dish, and the resulting cell population was serially passaged and refed every 2 days. The resulting cell population was characterized (data not shown) and could be regarded as an MSC subtype according to the criteria listed by the Stem Cell Committee of the International Society for Cell Therapy (10).
Labeling of hDPSCs with Poly-l-Lysine (PLL)-Conjugated Endorem®
The seeding density of hDPSCs prior to labeling with PLL conjugated Endorem® varied for the various techniques used in this study and will therefore be mentioned in the respective sections. PLL was used as a transfection agent to facilitate the uptake of the iron particles by adherent hDPSCs. The SPIOs were provided as a solution with an iron concentration of 11.2 mg/ml (Endorem®; Guerbet, Villepinte, France). SPIO–PLL mixtures were made by mixing different amounts of SPIO particles and PLL (MW > 300,000; Sigma-Aldrich, Bel gium) in culture medium on a rotating shaker for 60 min at room temperature. An equal volume of SPIO–PLL complexes was added to the hDPSC culture. The final concentrations of iron and PLL varied between 0–50 μg/ml and 0–1.5 μg/ml, respectively. Cells were incubated at 37°C for 24 h with the SPIO–PLL complexes and washed three times with phosphate-buffered saline (PBS) before they were immersed in normal culture medium for another 24–72 h.
Magnetic Resonance Imaging of Poly-l-Lysine/Endorem®-Labeled hDPSCs
To evaluate MRI-based cell visualization, labeled cells were trypsinized (exposure of cells to 0.05% trypsin-EDTA during 2 min at 37°C to allow cell detachment from the culture substrate), pelleted at 300 × g, and resuspended in standard culture medium. After counting, the cells were pelleted at 300 × g and resuspended in PBS. Using a 1:1 ratio of 200 μl PBS containing 500 cells/μl and 200 μl of 0.5% agar in distilled water (Sigma Aldrich, St. Louis, USA), a cell suspension of 250 cells/μl was transferred to a 0.5-ml Eppendorf tube (VWR, Heverlee, Belgium) 1/3 prefilled with solidified agar. After hardening of the agar/cell mixture, the Eppendorf tube was entirely filled with agar. After solidification, the different Eppendorf tubes were placed in a purpose-built Teflon holder and placed in a plastic cup. Subsequently, the holder was completely immersed in agar and capped. Those phantoms were imaged using an experimental animal MRI scanner operating at a field strength of 9.4 T (BioSpec, Bruker BioSpin, Ettlingen, Germany) and equipped with an actively shielded gradient set of 600 mT m−1. For radio-frequency irradiation and detection, a 7.2-cm quadrature resonator (Bruker BioSpin) was used. After acquisition of localizer images, T2 maps were acquired using a multislice– multiecho protocol (MSME, spin echo sequence) with the following parameters: repetition time (TR) = 3,000 ms and 16 echo time (TE) increments of 10 ms, 2562 matrix, field of view 5.5 × 5.5 cm, six slices of 0.35 cm thickness. Highresolution 3D T2*-weighted MR images were acquired using a gradient echo sequence [Fast Low Angle SHot (FLASH), TR = 200 ms, TE = 15 ms, flip angle 27°]. The field of view was 5.5 × 5.5 × 1.6 cm, and the isotropic resolution was 125 μm. Image processing and analysis was performed with Paravision 5.0 (Bruker BioSpin).
Differentation Procedures
Adipogenic and osteogenic differentiation potential of SPIO-labeled hDPSCs was tested by incubating them in differentiation media from the hMSC Functional Identification Kit (SC006, R&D Systems, Abingdon, Oxfordshire, UK) and were compared with unlabeled hDPSCs.
Adipogenic Differentiation Protocol
Following trypsinization, hDPSCs were seeded onto 12-mmø glass coverslips (VWR) for light microscopy or onto plastic coverslips (Thermanox®, Electron Microscopy Sciences, Hatfield, PA, USA) for electron microscopy at a density of 3.7 × 10⁴ cells per well in α-MEM supplemented with 10% FBS, + 1% P, 1% S, 0.2% F, and 2 mM l-glutamine. Cells were cultured at 37°C in a humidified atmosphere containing 5% CO2. When confluence was reached, medium was changed to the adipogenic differentiation medium (R&D Systems) containing hydrocortisone, isobutylmethylxanthine, and indomethacin. Medium was changed every 3 days. After 3 weeks, cells seeded on glass coverslips were washed with PBS and fixed with 4% formaldehyde (Unifix, Duiven, The Netherlands) for 20 min at room temperature. Cells seeded on plastic coverslips were fixed with 2% glutaraldehyde in 0.05 M cacodylate buffer (pH 7.3) overnight at 4°C.
Osteogenic Differentiation Protocol
Following trypsinization, hDPSCs were seeded onto 12-mmø glass coverslips for light microscopy or onto plastic coverslips (Thermanox®) for electron microscopy coated with fibronectin (R&D Systems) with a density of 7.4 × 10³ cells per well in α-MEM supplemented with 10% FBS, + 1% P, 1% S, 0.2% F, and 2 mM l-glutamine. Cells were cultured at 37°C in a humidified atmosphere containing 5% CO2. When 50–70% confluence was reached, medium was changed to the osteogenic differentiation medium (R&D Systems) containing dexamethasone, ascorbic acid 2-phosphate, and β-glycerophosphate. Medium was changed every 3 days. After 3 weeks, cells seeded on glass coverslips were washed with PBS and fixed with 4% formaldehyde for 20 min at room temperature. Cells seeded on plastic coverslips were fixed with 2% glutaraldehyde (Laborimpex, Brussels, Belgium) in 0.05 M sodium cacodylate buffer (Aurion, Wageningen, The Netherlands; pH 7.3) overnight at 4°C.
Histochemical Stainings
Differentiation of cells into the adipogenic and osteogenic lineages was determined using different histological staining techniques. Adipogenic differentiation was evaluated using Oil Red O (ORO) to reveal lipid droplet accumulation in the cell cytoplasm. Osteogenic differentiation was demonstrated using Alizarin Red S staining to detect calcified deposits in the cell cultures. Stained cells were examined using a phase contrast microscope.
Microscopic Analysis of Labeled hDPSCs
For confirmation of cellular iron uptake (Prussian blue staining), cells were fixed with Unifix® for 15 min at 4°C, washed with PBS, and incubated for 2 h with a mixture of 2% potassium ferrocyanide and 2% hydrochloric acid. Afterwards, the cells were counterstained with hematoxylin.
For transmission electron microscope (TEM) analysis, cells were seeded at a density of 5,000 cells/cm2 on plastic Thermanox® coverslips. After labeling, the cells were fixed with 2% glutaraldehyde in 0.05 M sodium cacodylate buffer (pH 7.3) at 4°C. Following fixation, the samples were washed twice for 5 min with 0.05 M sodium cacodylate (pH 7.3) and 0.15 M saccharose at 4°C. Postfixation was achieved by treating the samples with 2% osmium tetroxide (Aurion) in 0.05 M sodium cacodylate buffer (pH 7.3) for 1 h at 4°C. Dehydration of the samples was performed by exposing them to ascending concentrations of aceton. The dehydrated sample was impregnated overnight in a 1:1 mixture of aceton and araldite epoxy resin (Aurion) at room temperature. After impregnation, the sample was embedded in araldite epoxy resin at 60°C. After application of the pop-off method, the embedded samples were cut into sections of 40–60 nm, using a Leica EM UC6 microtome (Leica, Groot Bijgaarden, Belgium). Sections were then transferred to 50-μm mesh copper grids (Aurion) coated with 0.7% formvar. The samples were automatically stained using a Leica EM AC20 (Leica) with 0.5% uranyl acetate and a stabilized solution of lead citrate (both from Laurylab, Saint Fons, France). TEM analysis was performed with a Philips EM208 S electron microscope (Philips, Eindhoven, The Netherlands). The microscope was provided with a Morada Soft Imaging System camera (Olympus SIS, Münster, Germany) to acquire high-resolution images of the evaluated samples. The images were processed digitally with iTEM-FEI software (Olympus).
Determination of Cellular Iron Uptake After Labeling with PLL-Conjugated Endorem®
Cells from each sample were seeded at a density of 50 × 103 cells/cm2 in a six-well plate. After 24 h, the cells were subjected to the appropriate labeling conditions as stated above. One day after incubating the cells with the loading medium, this medium was removed and cells were subsequently cultured under standard culture conditions for two more days. Afterwards, the cells were trypsinized, pelleted at 300 × g, and resuspended in nitric acid to dissolve the cells and free all iron content.
The iron concentration in labeled cells was determined by atomic absorption spectroscopy (AAS) using a Perkin-Elmer 1100B atomic absorption spectrometer (PerkinElmer, Waltham, MA, USA). The sample was firstly vaporized and subsequently atomized with an acetyleneoxygen-driven flame. An Fe-selective hollow cathode emitting light at 248.3 nm was used as an excitation source for the iron particles in the sample.
MTT Cell Viability Assay of hDPSCs Labeled with PLL-Conjugated Endorem®
Cells from each sample were seeded at a density of 15 × 103 cells/cm2 in a 96-well plate (Nunc™, Roskilde, Denmark). After incubating the seeded cells for 24 h (37°C; 5% CO2 in humidified air), the cells were labeled with PLL-Endorem® under various conditions. Each labeling condition was studied in triplicates for all individual samples. Duration of cell labeling was 24 h, and thereafter, the SPIO-containing medium was removed and cells were rinsed with PBS before normal culture medium was added to remove any remaining iron particles. Cells were then kept in culture for 2 more days, after which the 3-(4,5-dimethylthiazol-2-Yl)-2,5-diphenyltetrazolium bromide (MTT) assay was performed in order to evaluate cell viability/metabolic activity after 3 days of exposure to the Endorem® particles. Culture medium containing 10% dimethyl sulfoxide (DMSO; Sigma-Aldrich Chemie, Steinheim, Germany) was used to induce cell death serving as a negative control for the MTT test.
In order to analyze the cells, the medium was removed and replaced with a solution containing 5% MTT (working solution: 5 mg/ml; Sigma-Aldrich, Bornem, Belgium), after which the cells were incubated for 4 h (37°C; 5% CO2 in humidified air). Secondly, the MTT solution was removed and replaced with 175 μl of a mixture containing 14% glycine (0.1 M) in DMSO. The 540-nm wave length of light absorpation in every well was determined with an iMark” Microplate Reader (BIO-RAD, Nazareth, Belgium).
Stereotaxic Engraftment of hDPSCs
Prior to surgery, hDPSCs were trypsinized and resuspended at a concentration of 300,000 cells/5 μl PBS. Herewith, different cell fractions (0, 100, 500, 1,000, 5,000, 10,000, 50,000, 100,000, and 300,000 cells) were labeled according to the method described above.
The animal studies conformed to the US National Institutes of Health guidelines for the care and use of laboratory animals and were approved by the Institutional Animal Care Commission and Ethical Committee of the Katholieke Universiteit Leuven, in accordance with international standards on animal welfare. Care was taken to minimize pain and discomfort to the animals. Four Rag 2-γ C immune-deficient mice (generated in house) were anesthetized by intraperitoneal injection of a mixture of 50–75 mg/kg ketamine and 0.5–1.0 mg/kg medetomidine. Subsequently, they were placed in a stereotaxic device, and the skull was exposed. After defining bregma, the Hamilton needle (Hamilton, Reno, NV, USA) was shifted 0.2 mm lateral and 0.05 mm anterior according to bregma. At this location, the skull bone was removed by means of a bur, thereby exposing the dura mater. Then, the needle was placed on top of the dura, and subsequently, the needle was allowed to penetrate the brain tissue from that point for 0.3 mm. After 1 min, 300,000 cells were injected at a controlled rate of 0.5 μl/min. After 10 min, the needle was left in place for another 5 min to allow sagging of the stem cells at the injection site. Subsequently, the needle was retracted, and the skin was closed and disinfected. Anesthetics were reversed by intraperitoneal injection of 1–2.5 mg/kg atipamezole. The whole procedure was carried out in a sterile laminar air flow cabinet.
In Vivo Magnetic Resonance Imaging of hDPSCs
MR images were recorded on the 9.4 T Biospec small animal MR system (Bruker Biospin) using a 7-cm linearly polarized resonator for transmission and an actively decoupled dedicated mouse brain surface coil for receiving (Rapid Biomedical, Rimpar, Germany). For localization purposes, two-dimensional axial T2-weighted images (spin echo, TEeff = 48 ms, TR = 3,500 ms) were obtained. For evaluation of cell labeling and cell localization, T2 maps (MSME, TR = 1,500 ms, 16 TE increments of 10 ms; in plane resolution of 100 μm, one slice of 300 μm thickness positioned at the location of the cell engraftment) and 3D high-resolution T2*-weighted MR images (FLASH, TR = 100 ms, TE = 12 ms, 59 μm isotropic resolution) were recorded. Image processing and analysis was performed with Paravision 5.0 (Bruker BioSpin).
Statistical Analysis
Statistical analysis was performed using Graphpad Prism 5 software (Graphpad, San Diego, CA, USA). Significant differences between experimental groups were determined using the one-way analysis of variance (ANOVA) test with a Bonferroni or Tukey post hoc test after controlling for normality with a D'Agostino and Pearson test or normalizing the data. Data were represented as mean ± standard error of the mean (SEM). Values of p ≤ 0.05 were considered statistically significant at the 5% significance level.
Results
MRI Analysis of Labeled hDPSCs
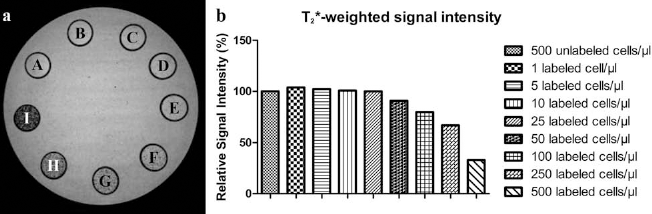
Phantoms containing hDPSCs labeled under the various conditions were studied by MRI to determine detectability limits. The relative signal intensities on T2*-weighted MR images were compared between the different loading conditions both 24 h (n = 4) and 3 days (n = 2) after labeling (Fig. 1a, b, respectively). In both cases, MR images reveal a gradual increase in contrast (decrease of T2 values and signal intensity in T2/T2*-weighted MRI) with increasing SPIO concentration in absence of PLL (Fig. 1a, b, A–D). Addition of 0.75 μg/ml PLL, however, caused a larger loss of the signal intensity in T2*-weighted MR images even when combined with the lowest SPIO concentration (Fig. 1a, b, F). Further increase of both PLL and/or SPIO concentrations did not result in a more pronounced contrast for the used cell densities when visually examined (Fig. 1a, b, G–K).

MRI of hDPSCs after cell labeling with various concentrations of SPIO and/or PLL. 3D T2*-weighted magnetic resonance (MR) images of human dental pulp stem cells (hDPSCs) 24 h (a) and 3 days after (b) cell labeling (250 cells/μl). Respective signal intensities in T2*-weighted MRI are shown in (c) and (d). MR images show a similar outcome between both time points. The addition of poly-l-lysine (PLL) alone did not alter cellular MRI contrast (E,I) compared to the control condition (A). A stepwise increase of the iron content from 15 to 50 μg/ml superparamagnetic iron oxide (SPIO) without the addition of PLL gradually decreases the observed signal intensity (B–D). However, the addition of 0.75 μg/ml PLL to 15 μg/ml SPIO (F) causes a drastic loss of signal. Further increments in iron content or PLL do not lead to lower observed signal intensities (G,H,J–L). Relative signal intensities in T2*-weighted MRI 24 h (c) and 3 days (d) after PLL-conjugated SPIO labeling of hDPSCs decrease with increasing SPIO concentrations. Addition of PLL causes a significant decrease in relative signal intensity. No mutual significant differences could be detected between the conditions in which PLL was conjugated to SPIO. Data were analyzed with a one-way ANOVA test and a Bonferroni multiple comparison post hoc test. Data are represented as mean ± SEM. ***p ≤ 0.001.
The relative signal intensities in the T2*-weighted MR images were calculated and plotted in Figure 1c and d. Data were normalized by defining the control condition of unlabeled cells as 100% relative signal intensity. Figure 1c shows the relative T2* signal intensities 24 h after labeling. No significant changes in T2* signal intensities could be detected when adding PLL alone to the loading medium. Addition of SPIOs alone caused a gradual decrease of the T2* signal intensities with increasing concentrations. The conjugation of PLL to the SPIOs caused a significant decrease of the T2 values and signal intensity in T2*-weighted MR images. The combination of the lowest PLL and SPIO concentrations (0.75 μg/ml PLL and 15 μg/ml SPIO) resulted already in sufficient iron uptake to cause complete signal quench. No mutual significant differences could be detected between the different combinations of PLL and SPIO. Even after continued proliferation (doubling time of 37 h) for 3 days in SPIO free medium and subsequent intracellular dilution of the particles, those low concentrations were sufficient for a significant decrease in MRI signal intensity when compared to unlabeled cells (p ≤ 0.001) (Fig. 1d). To avoid potential adverse effects on cell biology due to the contrast media, those conditions using relatively low concentrations (0.75 μg/ml PLL and 15 μg/ml SPIO) were considered sufficient for MRI and used for subsequent in vivo experiments.
The minimum cell density that is still detectable under those conditions was determined in MRI experiments where phantoms were loaded with decreasing cell numbers (Fig. 2a). Hypointense contrast in T2*-weighted MRI was markedly modulated compared to unlabeled controls starting from 50 labeled cells/μl (Fig. 2b). Increasing the amount of labeled cells/μl resulted in a further decrease in signal intensity.
MRI of increasing numbers of hDPSCs labeled with 15 μg/ml SPIO and 0.75 μg/ml PLL. 3D T2*-weighted MR images (a) of hDPSCs labeled with 15 μg/ml SPIO and 0.75 μg/ml PLL (A, 500 unlabeled cells/μl; B–I, 1, 5, 10, 25, 50, 100, 250, and 500 labeled cells/μl, respectively). Relative signal intensities are shown in (b). Fifty labeled cells per microliter provides enough contrast to induce a decrease in T2* signal intensity. Increasing amounts of labeled cells lead to more hypointense T2* signals.
Evaluation of SPIO Location in Labeled hDPSCs
Prussian blue staining of hDPSCs incubated for 24 h with PLL and SPIO is depicted in Figure 3. Numerous iron-containing intracytoplasmatic deposits are observed (black arrows), providing proof of SPIO uptake. When compared to unlabeled cells, cell morphology seems not affected by the labeling procedure (data not shown).

Intracellular SPIO stained with Prussian blue. Prussian blue staining showing iron deposits (black arrows) in 0.75 μg/ ml PLL–15 μg/ml SPIO-labeled DPSCs. Iron oxide particles are seen as bright blue dots. Scale bar: 50 μm.
To further assess the potential effects of the labeling procedure on hDPSCs and in particular their morphology, TEM analyses were performed. It was a further aim of the study to select ratios of PLL/SPIO that resulted in a homogenous intracellular distribution of the contrast agent.
Figure 4 clearly demonstrates that particle ingestion occurs by means of endocytosis. Cellular extensions called pseudopodia (black arrows) surround the SPIO particles that accumulate along the cell membrane prior to engulfment (Fig. 4a). The resulting endosomes (Fig. 4b, black arrows) are abundantly present underneath the plasma membrane and subsequently migrate towards the central cytoplasm. There, an association with lysosomes was often observed (Fig. 4c, black arrows). The SPIO-containing endosomes are membrane-bounded (Fig. 4d).

Ultrastructural aspects of cellular SPIO uptake. Depicted here is the optimal loading condition with 15 μg/ml SPIO and 0.75 μg/ ml PLL, 24 h after labeling. (a) Black arrows, pseudopodia: cellular processes that extend into the extracellular space to engulf SPIO particles accumulated along the cell membrane. (b) Black arrow, endosomes: vesicles containing foreign material that is taken up by the cell. (c) Black arrows, lysosomes. (d) Higher magnification of an endosome illustrating that these structures are surrounded by a membrane inhibiting free diffusion of the contrast medium throughout the cytoplasm. Scale bars: 1 μm (a–c) and 500 nm (d).
Surface modification of SPIO particles by using transfection agents is often used to improve cellular uptake. The hereby enhanced electrostatic interactions with the cell membrane resulted in an increased cell encapsulation and endosome formation, which in turn improved cell labeling.
When cells were loaded with SPIO particles alone, increasing the concentration resulted in a better uptake as illustrated in Figure 5. However, it was noticed that these particles tended to cluster in the intracellular space, thereby forming multiple “rod-like” structures (Fig. 5d, h, black arrows). Following cell division, these dense accumulations of iron oxide particles might hinder homogeneous distribution of the contrast agent over the two daughter cells. Therefore, this labeling option was excluded for further studies.

TEM analysis of SPIO-labeled hDPSCs. Transmission electron microscope (TEM) analysis of SPIO-labeled hDPSCs after 24 h without addition of PLL (a, b: 0 μg/ml SPIO; c, d: 15 μg/ml SPIO; e, f: 25 μg/ml SPIO; g, h: 50 μg/ml SPIO). Increasing concentrations of SPIO particles result in improved cellular uptake. Nevertheless, the absence of PLL allows intracellular clustering of the particles resulting in the presence of “rod-like” structures (black arrows). Scale bars: 10 μm (a, c, g), 5 μm (e), 2 μm (d, h), and 1 μm (f).
The combination of low concentrations of PLL and SPIO resulted in a more monodisperse intracellular distribution of the particles (Fig. 6a, b). Moreover, the external part of the cell membrane was found to be devoid of any SPIO remnants that were not internalized. Although PLL addition induced better particle uptake, the ratio between PLL and SPIO was found to be a crucial factor in determining the homogeneity of the endosomal content. Higher ratios than the optimal ratio (0.75 μg/ml PLL and 15 μg/ml SPIO) resulted in an intracellular clustering of the particles that was similar to that observed when loading the cells with SPIOs alone (Fig. 6c–h). In other cases, SPIO accumulation on the external side of the cell membrane was noticed (Fig. 6e, g), which might result in misleading interpretations of in vivo MRI if those extracellular SPIOs are taken up by host cells. Based on these results, labeling conditions using 50 μg/ml SPIO or more lead to ubiquitous intracellular clustering and were therefore not considered for subsequent experiments.

TEM analysis of hDPSCs labeled with varying concentrations of SPIO and/or PLL. TEM analysis of SPIO-labeled hDPSCs after 24 h (a, b: 0.75 μg/ml PLL + 15 μg/ml SPIO; c, d: 1.5 μg/ml PLL + 15 μg/ml SPIO; e: 0.75 μg/ml PLL + 25 μg/ml SPIO; f: 1.5 μg/ ml PLL + 25 μg/ml SPIO; g: 0.75 μg/ml PLL + 50 μg/ml SPIO; h: 1.5 μg/ml PLL + 50 μg/ml SPIO). The optimal ratio between SPIO (15 μg/ml) and PLL (0.75 μg/ml) resulted in a homogeneous uptake (a, b). Other combinations often resulted in the accumulation of dense intracellular SPIO clusters (black arrows in c, d; also seen in e-h). In case of high SPIO concentrations, extracellular binding of particles to the cell membrane was observed (black arrows in e, g). Sale bars: 5 μm (a, c, e-h) and 2 μm (b, d).
Evaluation of Differentiation Potential of SPIO-Labeled hDPSCs
Following adipogenic differentiation, SPIO-labeled hDPSCs acquired a round or more cuboidal cell shape and retracted their cellular extensions. Oil Red O staining revealed the intracellular accumulation of lipid droplets (Fig. 7a, black arrow) as well as SPIO particles (Fig. 7a, dotted arrow). This was confirmed at the ultrastructural level using TEM (Fig. 7b, c). The cytoplasm of differentiated cells was packed with multisized lipid droplets (black arrows) together with endosomes containing SPIO particles (dotted arrows).
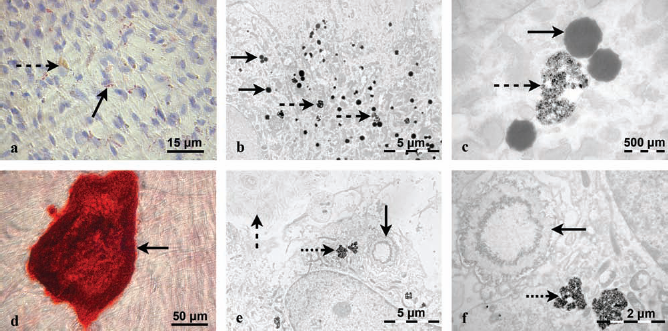
Adipogenic and osteogenic differentiation of SPIO-labeled hDPSCs. (a) Oil Red O staining indicating production of cytoplasmatic lipid droplets (black arrow) and SPIO particles (dotted arrow). (b, c) TEM analysis confirmed the transformation to adipocytes, which contained lipid droplets (black arrows) and SPIO particles enclosed in endosomes (dotted arrows). (d) Alizarin Red S staining indicating deposition of calcified matrix. (e, f) TEM analysis showed the presence of an extracellular matrix containing cross-banded collagen fibers (dashed arrow), multiple mineralization nuclei (black arrows), and endosomes containing SPIO particles (dotted arrows). Scale bars: 50 μm (a, c), 5 μm (b, d), 2 μm (f), and 500 nm (c).
Osteogenic induction resulted in the extracellular deposition of calcified matrix, which could be visualized using an Alizarin Red S staining (Fig. 7d). Ultrastructural examination confirmed the presence of an extracellular matrix containing typical cross-banded collagen microfibrils (dashed arrow) and multiple mineralization nuclei (black arrows) (Fig. 7e, f). Higher magnifications of the mineralization nuclei showed a globular secretion pattern and individual hydroxyapatite needles (Fig. 7f). The differentiated cells secreting the extracellular matrix also still contained endosomes filled with SPIO particles (dotted arrows).
Intracellular Iron Content Determination of Labeled hDPSCs
Cellular SPIO uptake was determined using AAS 3 days after labeling. Data are presented in Figure 8. Within groups with the same PLL concentration but increasing SPIO concentrations, a dose-dependent response was seen. However, within groups with the same SPIO concentration, the iron uptake could not be further increased by increasing PLL concentrations, indicating saturation. With higher concentrations of SPIO, this effect is less pronounced. Again, these data show that the ratio between PLL and SPIO is a crucial factor in determining cellular uptake. Abundant presence of PLL seems to result in a less efficient uptake of the conjugated particles. From MRI and TEM data, we could already conclude that the combination of 0.75 μg/ ml PLL and 15 μg/ml SPIO resulted in sufficient cell labeling that allowed MRI visualization. Even after 3 days of additional incubation in iron-free medium, an intra-cellular iron concentration of 13.4 pg/cell (SD = 2.5) was achieved (Fig. 8), indicating that even strong dilution of the initially achieved iron uptake will not hinder MRI detectability.
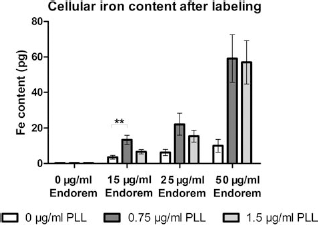
Intracellular iron content determination with AAS 3 days after labeling DPSCs with PLL/SPIO. Data were analyzed with one-way ANOVA with a Bonferroni multiple comparison post hoc test after normalizing the data. Data are represented as mean ± SEM; **p ≤ 0.01; ***p ≤ 0.001. AAS, atomic absorption spectroscopy.
Toxicity Assessment for Poly-l-Lysine/SPIO-Labeled hDPSCs
MTT assays were used to monitor potential adverse effects of the labeling procedure on cell metabolism using different ratios of PLL and SPIO (see Fig. 9). All data are compared with unlabeled control cells, which were defined as 100% concerning their metabolic activity. For comparison, 10% DMSO was used as a positive control for cell death. The addition of PLL in 0.75 or 1.5 μg/ml does not significantly alter metabolic activity, nor does the addition of 15 or 25 μg/ml SPIO in the absence of PLL. However, combining 0.75 μg/ml PLL with 15 μg/ml SPIO does significantly increase relative metabolic activity. This increased metabolic activity is no direct indication of toxicity. Increasing the iron content in the 0.75 μg/ml PLL condition does not lead to any significant changes in metabolic activity compared to the lowest SPIO concentration used. Increasing the PLL concentration does not result in further alterations in cell metabolism. Taken together, these data clearly demonstrate that no adverse effect on cell viability/metabolism could be detected following cell labeling.

MTT assay results after PLL/SPIO labeling of hDPSCs. Relative metabolic activity is defined by comparing different experimental groups with the unlabeled cells (control), which are defined as 100% metabolic activity. Data were analyzed with one-way ANOVA followed by a Tukey post hoc test and are represented as mean ± SEM; *p ≤ 0.05; **p ≤ 0.01; ***p ≤ 0.001. DMSO, dimethyl sulfoxide; MTT, 3-(4,5-dimethylthiazol-2-yl)-2,5-diphenyltetrazolium bromide.
In Vivo Monitoring of Transplanted hDPSCs
Anatomical MRI as well as histological analysis of brains with engrafted cells showed no signs of tumorgenicity, teratoma formation, or nonspecific migration of the transplanted cells (Fig. 10a, b). Transplantation of different amount of labeled cells into the brain of immune-deficient mice resulted in a substantial increase in MRI contrast and decrease of T2 relaxation time (Fig. 11a–d). Cells were monitored for 5 weeks, and no significant difference in signal intensities could be observed. To optimize in vivo imaging of hDPSCs, different fractions of 300,000 cells were labeled. T2*-weighted MR images were acquired for localization purposes and are shown in Figure 11. The volume of hypointense areas were calculated and plotted in Figure 11e. T2 relaxation times were calculated from T2 maps, visualized in Figure 12a–d, and plotted in Figure 12e. Results show a dose–response relationship between decreasing T2 relaxation times and increments in the amount of labeled cells. Even a low fraction of labeled cells (500 of 300,000 cells suspended in 5 μl) was clearly distinguishable from unlabeled cells (control condition). Following engraftment, the volume of labeled cells was monitored during a follow-up period of 2 weeks (one representative animal is shown in Fig. 13). Figure 13a and b shows the 3D T2*-weighted MR images of 1 day (a) and 2 weeks (b) following engraftment. Figure 13c clearly indicates that the volume of labeled cells only shows minor differences when monitored 1 day (timepoint a), 1 week (timepoint b), and 2 weeks (timepoint c) following engraftment.

Masson's trichrome staining revealing the presence of SPIO-labeled hDPSCs. Coronal low- and high-power images of a rat brain after transplantation of SPIO-labeled hDPSCs. (a, b) Neither signs of unspecific label uptake nor any signs of uncontrolled cell divisions were observed.

MRI of rat brain following transplantation with varying numbers of SPIO-labeled hDPSCs. 3D T2*-weighted MR images with (from left to right) 0/100 (a), 500/1,000 (b), 5,000/10,000 (c), and 50,000/100,000 (d) labeled cells in a total volume of 5 μl containing 300,000 cells. Volume calculations based on the hypointense areas seen in 3D T2*-weighted MR images for different labeled cell fractions in a total volume of 5 μl containing 300,000 cells (e).

Color-coded MSME MRI of rat brain following transplantation with varying numbers of SPIO-labeled hDPSCs. Color-coded T2 maps [multislice–multiecho protocol (MSME) MRI] with (from left to right) 0 (left), 100 (right) (a); 500 (left), 1,000 (right) (b); 5,000 (left), 10,000 (right) (c); and 50,000 (left), 100,000 (right) (d) labeled cells in a total volume of 5 μl containing 300,000 cells (1 day following engraftment). T2 relaxation times calculated from the cell grafts seen as hypointense areas in MR images for different labeled cell fractions in a total volume of 5 μl containing 300,000 cells (e).

Time course of one representative animal in which the volume of labeled cells was monitored over time. 3D T2*-weighted MR images of 1 day (a) and 2 weeks (b) following engraftment. Volume calculations (c) based on the hypointense areas seen in 3D T2*-weighted MR images for different time points (timepoint a, 1 day; timepoint b, 1 week; and timepoint c, 2 weeks following engraftment). Results show only minor decrease of the volume over time.
Discussion
Recent studies proposed hDPSCs as an alternative source of MSCs that possess the necessary characteris tics for future clinical applications (18, 31, 44). These cells were first described by Gronthos et al. and isolated using an enzymatic treatment of pulp tissue (14). Since that time, multiple attempts were made to optimize the isolation procedure. It has already been described that hDPSCs isolated with the explant culture method showed improved proliferation and differentiation potential (41). Furthermore, Kerkis and Caplan recently showed that the explant culture method resulted in a more homogenous cell population when compared to the traditionally used enzymatic digestion method (23). Therefore, we used explant-derived hDPSCs in this study, which were previously shown to possess all features to be categorized as a subtype of MSCs (44).
Tissue replacement by hDPSC transplantation is one of the possible applications in stem cell research. Others include modulation of the microenvironment immunologically or by the release of several (neuro)trophic factors (20, 35). The use of MSCs for cell-based therapies relies on the capacity of these cells to home and engraft long term into the appropriate target tissue. It has already been shown that MSCs have a tropism for wounding and tumor microenvironments, but the precise mechanism underlying this recruitment are not yet fully understood, although it has been suggested that chemokines and their receptors are involved (24, 40). Therefore, modulating this MSC homing capacity might offer a potential strategy for tissue engineering and development of new therapeutic applications.
Along with this therapeutic approach, location and longitudinal observation of the fate of the transplanted stem cells is an important question to be addressed in preclinical but also clinical research. At present, the most common solution to visualize these cells is to tag them in vitro prior to their transplantation. Cell transfection with reporter genes such as green fluorescent protein, selecting male donors and female recipients to use the Y chromosome as a marker or using cyanine dyes such as DiI are some of the tagging methods that are currently used. However, major drawbacks of these techniques are the utilization of transgenic cells not suitable for later clinical applications and their invasive character requiring removal of the tissue of interest and subsequent histological processing, which prevents longitudinal monitoring of individual animals. MR imaging overcomes this limitation, offering a noninvasive and dynamic imaging method with a long imaging time window, high spatial resolution and excellent soft tissue contrast without application of ionic radiation (15). Among MR contrast agents, SPIOs have been found to be the most suited to track cells in vivo (9, 15). Moreover, nanoparticles such as the clinically approved SPIOs are found to be biodegradable and can be metabolized and integrated into the serum iron pool (50). In this way, they show no toxic side effects and are safely cleared from the organism. Due to their strong effect on local magnetic field homogeneity and spin–spin relaxation times (decreasing T2/T2* relaxation times), iron oxide-based contrast agents can be readily detected as signal voids on T2/T2*-weighted MR images (2, 4, 15).
The present study investigated the labeling capacity of human dental pulp stem cells (hDPSCs) and its effect on cell viability. Based on MR imaging, ultrastructural analysis, and AAS, our results demonstrated efficient hDPSC labeling by combining SPIO with PLL as a transfection agent. The role of PLL lies in enhancing the electrostatic interaction between the cell membrane and SPIO particles, thereby ameliorating cellular uptake (2, 11). Although most nonphagocytotic cells do not endocytose SPIO particles efficiently or require very high amounts of contrast particles in culture, the current study indicates that with a relative low concentration of SPIO (i.e., 15 μg/ml SPIO) and PLL (i.e., 0.75 μg/ml) in culture medium, efficient cellular labeling can be accomplished. The minimum suggested concentration for in vivo cell visualization of 2–5 pg per cell (9, 32) was hereby exceeded by almost an order of magnitude even after prolonged cell proliferation in SPIO free medium, which results in substantial dilution of the initial label (higher than 13 pg per cell). Although less relevant for most in vivo applications, as no cell proliferation is expected after engraftment, continued cell incubation in SPIO-free medium has the advantage to increase the homogeneity of cell labeling (measured by the standard deviation of intracellular iron content) (32). With the labeling protocol suggested in this study, this is achievable without compromising on the in vivo cell visualization. To our knowledge, this is one of the highest intracellular iron concentrations reported for stem cell labeling using such low SPIO concentrations in the culture medium. Considering the large variability of iron content reported for different cell types labeled with SPIO under similar conditions (9, 26), it is highly likely that not only the label conditions (tranfection agent, type of nanoparticle) but also cell characteristics (e.g., membrane constitution or cell volume) play an important role to achieve those high iron concentrations.
After incubating hDPSCs for 24 h with SPIO/PLL mixtures, high amounts of intracytoplasmatic iron-containing endosomes could be detected by TEM. However, when SPIO was used in absence of PLL or when high concentrations of SPIO were used (≥ 50 μg/ml), intracellular “rod-like” aggregates were detected by TEM. This suggests that the dextran coating of the SPIO particles might be altered upon internalization, which induces clustering of the SPIO particles. PLL instead might have an inhibitory effect on this phenomenon by modulating uptake mechanisms.
The labeling procedure suggested in this study seemed to have no effect on cell morphology. Previous studies on neural progenitor cells also reported no effect of Endorem® on cytoskeletal conformation following labeling with concentrations exceeding 100 μg/ml (38, 39).
Differentiation experiments with SPIO-labeled hDPSCs showed no adverse effect on their differentiation potential. Adipogenic and osteogenic differentiation were not affected and showed high resemblance to the differentiation of nonlabeled hDPSCs, which was previously reported by our group (44). These results are in accordance with previous reports on different stem cell types indicating no negative effects of MRI contrast agents on the stem cell phenotype using iron concentrations exceeding 100 μg/ml (9, 39).
It was shown that the SPIO and transfection agent concentrations used in this study did not have any immediate adverse effect on cell viability. This might partially be due to the relatively low iron concentrations in the labeling medium when compared to other studies (2, 4, 9, 11, 19, 26, 36–39). However, MTT results indicated an increase of the cell metabolism after SPIO loading. An increase in mitochondrial activity might be responsible for the increase in metabolic activity as supported by several studies that assign this increase in metabolic activity to the production of reactive oxygen species (ROS) (38, 39). These studies suggest that labeling cells with dextran-coated ferumoxides leads to an increased intracellular ROS concentration, affecting the metabolic activity in the mitochondria of viable cells. This altered metabolic activity might influence the outcome and interpretation of the MTT assay. However, studies using rat macrophages and iron oxide-based nanoparticles describe this effect to be transient and not affecting cell viability, as also found in our study (8, 36, 43). Taken together, MTT results show no short-term effect on cell viability and metabolism. However, long-term effect of the SPIO labeling on possible induction of apoptosis in hDPSCs has not yet been assessed. Although some studies already showed an increased rate of apoptosis in maturated cell types including endothelial cells and macrophages (29, 54), most studies focused on progenitor or stem cells reported no increased apoptosis in iron oxide-labeled cells (2, 33, 48, 53). Nevertheless, when considering using hDPSCs as therapeutic agents in preclinical studies, this might be an important issue to cover.
Although the results described in present study favor SPIO cell labeling as an interesting cellular imaging modality, caution must be taken with regard to selectivity and sensitivity. Upon cell death of SPIO-labeled cells, nonspecific uptake of released SPIO particles by tissue macrophages might cause misinterpretation of MRI hypointensities. In the same way, extracellular binding of SPIOs, as seen in our highest loading concentrations, might result in transfer of SPIOs to the host cells thereby creating nonspecific hypointense MR signals. This extracellular binding was inhibited by additional culture in iron-free medium and also applied before implantation in vivo. Fusion of transplanted DPSCs with host cells might be another mechanism for nonspecific label transfer in vivo.
Furthermore, SPIO particles might also be subjected to degradation in the lysosomal compartments of the cells leading to the reduction of the hypointense MR signal. Therefore, in vivo transplantation of labeled hDPSCs was carried out and 3D T2*-weighted MRI of labeled hDPSCs engrafted into the brain of immune-deficient mice confirmed the phantom experiments in vivo. The injection of 300,000 labeled cells resulted in strong disruptions of the local magnetic field homogeneity, which induced signal quenching that allows detection of SPIO-labeled cells as hypointense areas in the T2- and T2*-weighted MR images. Postmortem histological analysis of the transplantation site showed a clear delineated labeled cell mass surrounded by normal brain tissue. No SPIO particles could be noticed in cells surrounding the transplantation site, therefore suggesting optimal retention of the contrast agent in hDPSCs. Furthermore, no signs of tumorgenecity were noticed. A major disadvantage of the large T2* effect is the fact that the signal quench is not only limited to the close proximity of the site of engraftment but also beyond (volume effect), making visualization of potential cell migration over short distances almost impossible. On the other hand, this volume effect can be used to our advantage. As the large magnetic moment of SPIO particles influences the magnetic field beyond the actual size of the particles, several studies already demonstrated that even small numbers of SPIO-labeled cells can be detected in vivo (15). Labeling of different fractions of 300,000 cells showed that the volume of hypointense areas in T2*-weighted images and the T2 relaxation times are dependent on the amount of labeled cells. Our results suggest that a labeled fraction of 0.17% hDPSCs already allows in vivo visualization in the brain. Volume calculations of the engrafted cells during a follow-up period of 2 weeks indicated neither dilution nor substantial degradation of the intracellular SPIOs.
In conclusion, this study provides evidence that hDPSCs can be successfully labeled with SPIO particles when combined with PLL as a transfection agent resulting in relatively high intracellular iron concentrations with exposure to only low concentrations in the medium. SPIO labeling was not found to be deleterious to hDPSCs and offers a powerful method to elucidate migration mechanisms of hDPSCs by means of MRI. First, in vivo data provide promising results regarding long-time in vivo detection of SPIO-labeled hDPSCS showing perfect label retention and no signs of tumorgenicity, which is a prerequisite for future noninvasive monitoring of cell therapy in disease models and clinical studies.
Footnotes
Acknowledgments
The skillful technical assistance of Mr. Marc Jans, Mrs. Jeanine Santermans, Mrs. Magda Ieven, and Mrs. Ann Van Santvoort is gratefully acknowledged. We are thankful to Guerbet, Roissy, France, for the generous gift of Endorem®. This work was financially supported by the European commission for EC-FP7 network ENCITE (2008-201842), the Flemish government for the SBO-IWT-80017 “iMAGiNe” and SBO-IWT-060838 “BRAINSTIM,” the “Fonds Wetenschappelijk Onderzoek (FWO)” Flanders, and by the K. U. Leuven Program Financing “IMIR.” The authors declare no conflicts of interest.