
Abstract
Cardiac cell therapy with mesenchymal stem cells (MSCs) represents a promising treatment approach for endstage heart failure. However, little is known about the underlying mechanisms and the fate of the transplanted cells. The objective of the presented work is to determine the feasibility of magnetic resonance imaging (MRI) and in vivo monitoring after transplantation into infarcted mouse hearts using a clinical 3.0 T MRI device. The labeling procedure of bone marrow-derived MSCs with micron-sized paramagnetic iron oxide particles (MPIOs) did not affect the viability of the cells and their cell type-defining properties when compared to unlabeled cells. Using a clinical 3.0 T MRI scanner equipped with a dedicated small animal solenoid coil, 105 labeled MSCs could be detected and localized in the mouse hearts for up to 4 weeks after intramyocardial transplantation. Weekly ECG-gated scans using T1-weighted sequences were performed, and left ventricular function was assessed. Histological analysis of hearts confirmed the survival of labeled MSCs in the target area up to 4 weeks after transplantation. In conclusion, in vivo tracking of labeled MSCs using a clinical 3.0 T MRI scanner is feasible. In combination with assessment of heart function, this technology allows the monitoring of the therapeutic efficacy of regenerative therapies in a small animal model.
Keywords
Introduction
Heart failure is the major cause of death in industrial countries and represents a significant health problem throughout the world (21,34). Myocardial infarction and ischemic heart disease lead to irreversible loss of myocardium, formation of scar tissue, and, in turn, deterioration of cardiac pump function. Since the heart has poor regeneration capabilities, it fails to reconstitute necrotic tissue (27,30). Thus, heart transplantation or mechanical assist devices represent the only therapeutic option for end-stage heart failure (4).
Cardiac cell therapy is an emerging and promising approach for the regeneration of the heart (35). In contrast to pharmacological and surgical approaches, cell-based therapies potentially may improve the myocardial regeneration (i.e., after myocardial infarction). In clinical trials, predominantly bone marrow-derived cells have been applied, showing encouraging results (23). Within the bone marrow-derived cell populations, mesenchymal stem cells (MSCs) have emerged as a promising subpopulation (17) with specific therapeutically effective properties (6). MSCs migrate to the site of tissue injury (16,38) and induce paracrine effects [i.e., immunomodulation (36,40) and angiogenesis induction (14,15)]. However, there is only limited information regarding the underlying mechanisms and the fate of the transplanted cells. Therefore, there is an essential need for noninvasive methods to localize transplanted cells in vivo.
In the present study, we sought to determine the fate of transplanted bone marrow-derived MSCs and assess the changes in cardiac function in a cryoinjury-induced murine model of cardiac infarction applying a clinical 3.0 T magnetic resonance imaging (MRI) scanner.
Materials and Methods
Animal Care
All animals received humane care in compliance with the National Institutes of Health and National Society of Medical Research guidelines.
Isolation and Expansion of Murine Mesenchymal Stem Cells
MSCs were isolated based on protocols described previously (28,37). Briefly, nucleated bone marrow cells (BMCs) were obtained from 8-week-old C57BL/6 mice (bred in house) by flushing the long bones with phosphate-buffered saline (PBS, Invitrogen, Carlsbad, CA, USA). Total BMC yield was quantified after red blood cell lysis with a commercially available solution (Miltenyi Biotec, Bergisch-Gladbach, Germany) using a hemacytometer (Roth, Karlsruhe, Germany) and then cultured at a density of 1.5 × 10⁶ BMCs/cm2, with a custom-made MSC culture media (PAN Biotech, Aidenach, Germany) supplemented with 2.5 ng/ml human basic fibroblast growth factor (bFGF, R&D Systems, Wiesbaden, Germany), 100 U/ml penicillin, and 100 μg/ml streptomycin (both Invitrogen). The cultures were incubated at 37°C and 5% CO2 in a humidified incubator. MSCs were further cultured for 6–8 weeks and continuously passaged at a confluence of 80% using trypsin (0.5 g/L) and ethylenediaminetetraacetic acid (EDTA, 0.2 g/L, both Invitrogen) until a proliferative, homogenous MSC population was achieved.
In Vitro Differentiation Assays
In order to confirm the presence of MSCs, the cells were further differentiated in vitro into adipo-, chondro-, and osteogeneic cell lines.
For adipogenesis, MSCs were cultured in adipogenesis differentiation medium composed of low-glucose Dulbecco's modified Eagle's medium (DMEM, Invitrogen), fetal bovine serum (10%, Lonza, Basel, Switzerland), dexamethasone (1 μM, Sigma-Aldrich, Steinheim, Germany), 3-isobutyl-1-methylxanthine (IBMX, 0.5 mM, Sigma-Aldrich), insulin (10 μg/ml, Roche, Grenzach-Whylen, Germany), and indomethacin (100 μm, Sigma-Aldrich). After 21 days, the cells were stained with Oil Red (Sigma-Aldrich) to visualize the lipid vesicles.
To induce chondrogeneic differentiation, MSCs were centrifuged for 15 min at 150×g, and chondrogeneic differentiation medium (StemPro, Invitrogen) was used according to the manufacturer's protocol. The small cluster that was formed from the pelleted cells was cryosectioned and stained with Alcian blue (Roth) to visualize chondrogeneic extracellular deposits of hyaluronic acids.
Osteogeneic differentiation was induced by culturing MSCs for 15 days in osteogenesis differentiation medium, composed of low-glucose DMEM, fetal bovine serum (10%, Lonza), dexamethasone (0.1 μM, Sigma-Aldrich), ascorbic acid 2-phosphate (0.2 mM, Sigma-Aldrich), glycerol 2-phosphate (10 mM, Roth), and l-glutamine (2 mM). Differentiation medium was changed twice per week. After 15 days, cells were stained with silver nitrate (Roth) following the von Kossa protocol. The calcium deposits were visualized by treatment with 1% pyrogallol (Roth) and 5% sodium thiosulfate (Roth).
Fluorescence-Activated Cell Sorting (FACS): Surface Antigen Expression
The expression of MSC surface marker antigens was analyzed by FACS. Cells at 106 per sample were stained with fluorescently labeled anti-cluster of differentiation 45 (CD45; fluorescein isothiocyanate, FITC), anti-stem cell antigen 1 (Sca-1; phycoerythrin, PE), anti-CD44 (phycoerythrin/cyanine 7, PE/Cy7), and anti-CD11b (PE/Cy7)-specific antibodies (all BD, Heidelberg, Germany) at a concentration of 0.125 μg/ml for 10 min at 4°C. Matching isotypes were used as controls (BD). A minimum of 5 × 10⁵ cells was analyzed using a FACS-Calibur cytometer and Cellquest Pro v6 software (BD).
Cell Labeling
MSCs were labeled with Micron-sized iron oxide particle (MPIO) microspheres (product No. MC03F/9781, Bangs Laboratories, Fishers, IN, USA), serving as MRI contrast agent and histologicalmarker. These MPIOs were 0.9 μm in diameter and composed of polystyrene with 62% (w/w) iron oxide and labeled with a red fluorescent dye (Flash Red). For the establishment of optimal labeling conditions for MSCs decreasing amounts of MPIOs from 1.8 × 10⁸ to 0.7 × 10⁶ MPIOs per cm2 of cell culture surface area were used, corresponding to 100 μl to 0.4 μl MPIO suspension per mlmedium. In order to detect transplanted, surviving MSCs containing MPIOs, MSCs were colabeled with the fluorescent vital cell stain Vybrant 1,1′-dioctadecyl-3,3,3′,3′-tetramethylindocarbocyanine perchlorate (DiI; Invitrogen).
Proliferation Assay
Proliferation of MSCs was assessed using the 2,3-bis(2-methoxy-4-nitro-5-sulfophenyl)-5-((phenylamino) carbonyl)-2H-tetrazoliumhydroxide (XTT) assay (Applichem, Darmstadt, Germany) following the manufacturer's instructions. Briefly, cells were seeded at 500 cells per cavity on a 96-well plate (BD). At defined time points, the medium was replaced by 100 μl medium plus 50 μl XTT working solution and incubated for 3 h. The absorbance of orange XTT reduced formazan compounds was measured in a spectrophotometer (Tecan Sunrise, Crailsheim, Germany) at 450 nm with a reference measurement at 620 nm. The correlation of absorbance and number of viable cells was determined by a standard curve from serial dilutions of defined cell numbers.
Animal Disease Model/Intramyocardial Transplantation
The myocardial injury was induced by cryoinfarction in male, 8- to 10-week-old C57BL/6 mice. After induction of general anesthesia with 5% isoflurane (Abbott, Abbott Park, IL, USA) and O2/N2O (1:1), the animals were intubated, and anesthesia was maintained with 1.5% isoflurane. A liquid nitrogen cooled probe was placed on the left ventricle thrice for 5 s through a left-sided thoracotomy. Immediately after cryoinfarct induction, 105 labeled MSCs in 10 μl PBS were transplanted by a single intramyocardial injection into the peri-infarct area (n = 5) using a 25-μl syringe (Hamilton, Bonaduz, Switzerland) with a 27-gauge cannula (BD). Sham animals (n = 5) received 10 μl PBS only. After cell injection, the chest was closed and the thoracic cavity was evacuated. Animals without any surgical treatment (n = 5) were used as healthy controls.
MR Image Acquisition
Transplanted MSCs were identified, and the cardiac function was assessed in vivo using a clinical 3.0 T MRI scanner (80 mT/m max strength, slew rate: 200 mT×ms/m, Intera Achieva, Phillips Medical Systems, Best, Netherlands) as described previously (2,11,22). To enhance signal-to-noise-ratio, the MRI device was equipped with a dedicated experimental small animal solenoid coil (Phillips Medical Systems, Best, Netherlands). For electrocardiography (ECG) gating, MRI-compatible pediatric ECG electrodes (blue sensor BR/BRS, Ambu A/S, Baltorpbakken, Denmark) were attached to the animals' paws. Serial MRI scans of transplanted hearts were performed weekly for 4 weeks after infarct induction. Mice were anesthetized with 1.25% isoflurane (1 L/min O2). Long-axis images of the left ventricle were obtained by ECG-gated sagittal scans of six slices with six cardiac phases to localize the MPIO-labeled MSCs. Cardiac function was assessed by ECG-gated acquisition of transversal images of six slices with 12 cardiac phases of the left ventricle between the end-systolic and end-diastolic state. Setup of MRI was as follows: T1-weighted fast gradient echo single-shot sequence, repetition time (TR) = 15 ms, echo time (TE) = 4 ms, flip angle = 15°, field of view (FOV) = 80 × 80 mm, acquisition (ACQ) voxel resolution = 0.30 × 0.30 × 1.00 mm, reconstruction (REC) voxel resolution = 0.16 × 0.16 × 1.00 mm, matrix = 268 × 267, six contiguous slices at 1-mm slice thickness. Acquisition time for localization and cardiac function per animal was about 40–45 min. Normothermia of the mice was maintained by a heating system integrated in the solenoid coil.
MRI Image Analysis
For documentation of MSC localization, long-axis images of the left ventricle were analyzed for signal voids within the ventricular wall (which were not present in sham operated animals) and saved as image files using visualization software DICOM viewer R2.5 v1.1 (Philips). Transversal MRI images covering the complete left ventricle were used for semiautomatical assessment of endocardial and epicardial contours. Left ventricular end-systolic (LVES) and end-diastolic (LVED) volumes were calculated using image analysis software Segment v1.8 (Medviso, Lund, Sweden). Left ventricular ejection fraction (LVEF) was calculated from LVES and LVED volumes. Data were analyzed independently by three experienced researchers.
Sagittal images showing signal voids in the left ventricular walls were analyzed for assessment of signal void areas and signal void intensities by ImageJ software v1.42q (http://rsbweb.nih.gov/ij/). Background signal void intensities were determined from septum areas. The threshold for specific signal void intensity was defined as less than 50% signal intensity of background. Each slice was scanned for areas with signal intensities below the threshold level. Signal voids in the left ventricular wall were then quantified for area size and mean signal intensity.
Histochemistry
Mice were euthanized after the final MRI assessment, hearts were excised, flushed with PBS, and immediately cryopreserved using Tissue-Tek O.C.T. (Sakura Finetek, Staufen, Germany). Hearts were cryosectioned (10 μm) and analyzed by histochemistry. Masson's trichrome staining (MTC, Roth, Karlsruhe, Germany) was performed to confirm the myocardial infarction area. The presence of MPIO-labeled MSCs was confirmed by fluorescence detection (Flash Red) and iron oxide-specific Prussian blue staining (Roth). Microphotographic documentation was performed using an inverted Nikon Eclipse Ti-U microscope (Nikon, Düsseldorf, Germany).
Statistical Analysis
All data were expressed as mean±1 standard deviation. Comparison of groups was performed using oneway analysis of variance (ANOVA) followed by post hoc Bonferroni test. A value of p ≤ 0.05 was considered statistically significant. The statistical analysis was performed using IBM SPSS Statistics software package, release 19 (IBM Corp., Somers, NY, USA).
Results
Murine Bone Marrow MSC Isolation
Mesenchymal stem cells could be successfully isolated from bone marrow of C57BL/6 mice. In order to reproducibly achieve proliferative MSC cultures, a minimum of 106/cm2 BMCs were seeded in specifically optimized medium. The first culture media change was performed after 48 h, followed by media changes every 3 days, resulting in a confluent monocell layer of plastic adherent cells. After 6–8 weeks and at passages 3–4, a morphologically homogeneous, proliferative population of spindle-shaped cells was the predominant cell type and was used for subsequent characterization and transplantation experiments. Following this protocol, a typical MSC isolation, starting with bone marrow from three 6-week-old mice, yielded a total MSC number of at least 30 × 106 cells at passage 5.
Labeling of MSCs with Paramagnetic MPIOs
In order to track transplanted intramyocardial cells in vivo in a murine model using a clinical MRI scanner, the MSCs were labeled with paramagnetic fluorescent MPIOs. The ratio of labeled cells and the labeling intensity for MSCs incubated with decreasing amounts of MPIOs were assessed by flow cytometry in order to establish optimal labeling conditions. MPIOs at 0.7 × 10⁶/cm2 resulted in about 80% MSC labeling efficiency, which could be further increased up 99% (11.2 × 10⁶/cm2) (Fig. 1).

Labeling of murine MSCs with paramagnetic micron-sized iron oxide particles (MPIOs). (A–D) Morphology of mesenchymal stem cells (MSCs) and cytoplasmic distribution of MPIOs. Microphotographs of unlabeled MSCs (A) and MSCs labeled with 5.6 × 10⁶ (B), 11.2 × 10⁶ (C), and 22.5 × 10⁶ (D) MPIOs/cm2. Flash Red fluorescent MPIOs are shown as rough, uneven staining. Nuclei stained with DAPI are shown as smooth, even staining. Scale bar: 50 μm. (E) Labeling efficiency. Ratios of MPIO-labeled MSCs determined by fluorescence-activated cell sorting (FACS) analysis of Flash Red-positive cells. (F) Labeling intensity. Mean fluorescence intensities of labeled MSCs determined by FACS analysis of Flash Red-positive cells. (G) Proliferation. Cells numbers were measured daily for 1 week for unlabeled and labeled MSCs using the XTT proliferation assay.
The cell-labeling intensity was determined by the mean fluorescence intensity of the labeled fraction of the MSCs. Here, a 20-fold increase in intensity could be observed between the lowest and highest MPIO concentration (Fig. 1). Thus, populations of MSCs can be efficiently and completely labeled with moderate amounts of MPIOs with the option of gradually enhancing the intensity of the labeling by increasing the amount of MPIOs applied.
Characterization and In Vitro Differentiation of Labeled MSC
In order to assess the effects of MPIO labeling of MSCs, cells from passage 6 were labeled with 11.2 × 10⁶ MPIOs/cm2. The morphology of the MSCs was not affected by the MPIO labeling conditions and the cells remained in spindle shape (Fig. 1A–D). The viability of unlabeled and labeled MSCs was compared by assessing their proliferation rates, which showed no significant difference (Fig. 1G). Both cell populations doubled approximately every 36 h.
Additionally, the MSCs were analyzed for the consensual MSC surface marker expression profile by FACS. There was no significant difference between both groups, which were negative for CD11b and CD45 and positive for MSC-specific markers CD44 (63.4±15.2% vs. 64.1±4.1%, p = 0.92) and Sca-1 (98.0±0.9% vs. 97.8±0.8%, p = 0.77).
The MPIO labeling had no negative effect on the in vitro differentiation potential of MSCs (Fig. 2A–C). Labeled MSCs also showed a proper differentiation along adipogeneic, chondrogeneic and osteogeneic lineages when labeled with 11.2 × 10⁶ MPIOs/cm2 (Fig. 2D–F).

In vitro differentiation potential of murine MSCs labeled with paramagnetic MPIOs Unlabeled MSCs (A–C) and MSCs labeled with 11.2 × 10⁶ microspheres/cm2 (D–F) were submitted to specific cell culture conditions inducing adipogenic (A, D), chondrogenic (B, E), and osteogenic (C, F) differentiation. (A, D) Lipid vacuoles of adipocytes were stained with Oil Red. (B, E) Chondrogenic deposits of hyaluronic acids were stained with Alcian blue. (C, F) Osteogenic deposits of calcium were stained black by van Kossa staining. Scale bars: 100 μm (A, D) and 50 μm (B, C, E, F).
Histochemistry
The myocardial infarct region was detected by MTC staining and confirmed a significant transmural myocardial cryoinjury (Fig. 3A, B). Sections of hearts explanted 4 weeks after transplantation were screened for MPIO-labeled MSCs after Prussian blue staining and confirmed by colocalized detection of Flash Red fluorescence (Fig. 3C, D). Transplanted MSCs could be detected in the myocardium in three of five animals. In two hearts, we found MPIOs in the peri-infarct region continuously over 80 and 50 sections (10 μm thickness), respectively. In both hearts, MPIOs could also be detected within the fibrotic tissue of the infarct scar. Furthermore, in both cases, a connecting trail of signal between the large signal areas in the peri-infarct region and the smaller area within the fibrotic infarct region could be detected (Fig. 3B–D). In one animal, the cells were localized also in the septum far from the infarct region. The detection of viable MPIO-labeled MSCs was confirmed by colocalization of two markers, Flash Red fluorescent MPIOs and vital stain Vybrant DiI, up to 4 weeks after transplantation (Fig. 3E–G).
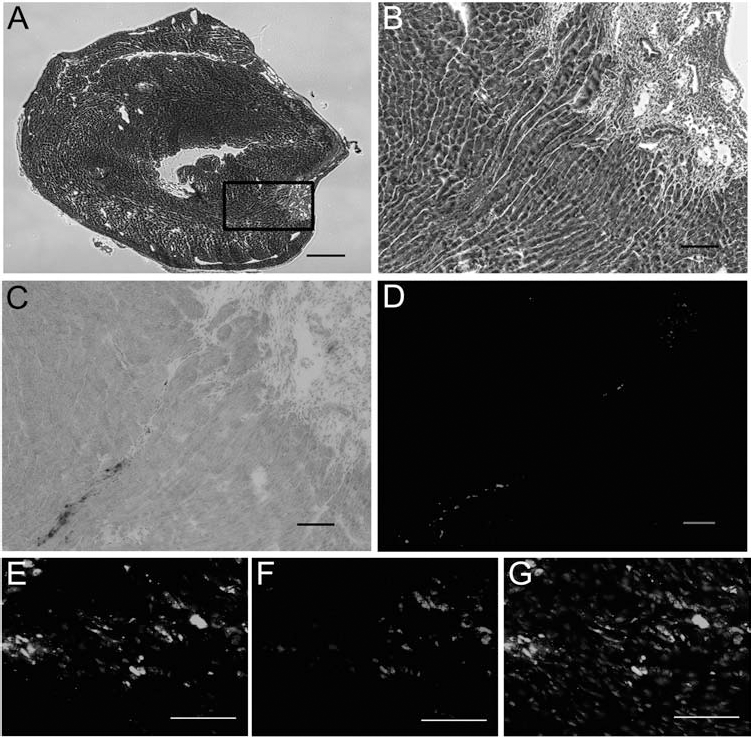
Histological analysis of MSC-transplanted hearts. (A, B) Representative sections of a heart explanted 4 weeks after cryoinfarction and intramyocardial transplantation of 105 labeled MSCs. Masson's trichrome (MTC) staining showing myocardial cells (dark staining) and fibrotic tissue (light staining) from scarring at the site of infarction on the left ventricular wall. (A) The maximum infarction area of a representative heart. (B) Site of cell injection (100 μm apart from A; scale bars: 500 μm). (C, D) Detailed views from inset in (A) (rotated 90° counterclockwise): MPIOs were detected by Prussian blue staining (dark staining, C) and colocalization by Flash Red fluorescence signal (light staining, D). Scale bars: 100 μm. (E–G) Representative section of a heart explanted 4 weeks after cryoinfarction and intramyocardial transplantation of 105 MSCs labeled with MPIOs and Vybrant DiI: (E) fluorescent signal from DiI, (F) fluorescent signal from Flash Red, (G) merged images E and F (nuclei: staining not evident). Vital-labeled MSCs were confirmed by colocalization of Vybrant DiI and MPIOs. Scale bar: 50 μm.
In Vivo Tracking of Transplanted, Labeled MSC
The T1-weighted image acquisition resulted in a high spatial resolution while the detectability of hypointense signal voids was not compromised (data not shown). Signal voids from MPIOs, shown as darker areas compared to the background tissue signal, could be detected in four of five MSC-transplanted animals over the course of 4 weeks (Fig. 4A, B), whereas no signal voids were observed in sham-transplanted animals. MRI images of sham-transplanted mice did not show signal voids in the ventricular wall. In transplanted animals, the signal voids were detectable on two to three sagittal slices and three to four transversal slices (1 mm slice thickness without gaps) and were located in the cryoinfarction region in the anterior left ventricular wall. The location of the signal void remained constant over the observational period of 4 weeks. An approach to quantify the detectable signal void was performed in order to compare changes over time and among experiments. Quantitative analysis of scans from animals with signal voids accessible for analysis (n = 3) showed a tendency for reduction of signal void area and increase of signal void intensity over 4 weeks, but without significant differences between time points (Fig. 4C).

In vivo cell tracking by MRI. (A, B) Representative images from sagittal (A) and transversal (B) cine data sets from MSC-transplanted mice after myocardial cryoinfarction. Signal voids are clearly visible in the left ventricular wall. Magnetic resonance imaging (MRI) measurements were performed on a weekly basis for 4 weeks (1w–4w) after transplantation using a 3.0 T MRI scanner. (C) Quantitative analysis of signal voids. Images from MRI measurements over 4 weeks after transplantation of labeled cells were quantitatively analyzed for signal voids of the left ventricular wall and normalized to values of the first measurement on week 1. Size and average signal intensity of signal voids were assessed by densitometry. Data are shown as mean±1 standard deviation from three independent measurements. CNR, contrast-to-noise ratio.
Cardiac Function
When compared to healthy control mice, which had not received any surgical intervention, the LVEF of cryoinfarcted mice with sham injection was significantly reduced throughout the entire observational period of 4 weeks (healthy: 65.2±4.7%; sham animals: 1 week after transplantation: 48.9±4.5%, week 2: 44.8±3.4%, week 3: 47.0±4.9%, week 4: 49.4±6.0%) (Fig. 5). Cryoinfarcted mice with MSC transplantation showed a trend to better LVEF compared to the sham-treated animals without reaching statistical significance. LVEF was significantly lower in the MSC-transplanted group compared to healthy controls over the first 3 weeks, but not at week 4 (MSC-transplanted animals: 1 week after transplantation: 49.4±3.7%, week 2: 49.5±3.3%, week 3: 52.7±3.9%, week 4: 54.3±6.5%) (Fig. 5).

Time course of cardiac function after cryoinfarction and cell transplantation. The left ventricular ejection fraction (LVEF) was determined by analysis of short-axis MR images. While the LVEF of MSC-transplanted animals showed a trend for an increased LVEF, the improvement did not reach statistical significance. LVEF of transplanted mice differed significantly (*p < 0.05) compared to healthy control animals (65.2±4.7%) for all time points, except for the MSC group 4 weeks after transplantation. Data are shown as mean±1 standard deviation; all groups are n = 5.
Discussion
In the present study we demonstrated the following:
MSCs could be labeled efficiently with paramagnetic MPIOs without impairing MSC specific features (i.e., proliferation capacity, surface antigen expression and in vitro differentiation potential).
Labeled cells were localized after intramyocardial transplantation to a murine model and parameters relevant for heart function were assessed using a clinical 3.0 T MRI device.
The MRI-based localization of MPIO-labeled MSCs in the myocardium could be confirmed and analyzed histologically.
MSC Isolation
The isolation and expansion of homogeneous populations of murine MSCs is known to be challenging. Mouse strain-related variances, differences in methods of isolation, and cell culture conditions make results hard to reproduce and to compare (29,32). The original method to isolate murine MSCs from bone marrow is based on their ability to adhere to plastic surfaces (10). In contrast to published methods (37), we established an MSC isolation protocol, plating bone marrow aspirate cell suspensions at high MSC densities, without further selection procedures like density gradient centrifugation (12) and immune-magnetic enrichment or depletion (1,31). This resulted in a reproducibly improved yield of MSCs, independent of the strain and gender of the donor animals used.
MSC Labeling
In order to track and study the fate of transplanted cells in vivo by MRI, the target cells were labeled with paramagnetic MPIOs. MSCs showed a highly efficient uptake of MPIOs by phagocytosis, omitting the need of transfection procedures (9,24,41). There were no detrimental effects on viability or cell type-specific properties, including viability, proliferation rate, surface markers expression, and in vitro differentiation potential.
An alternative method for in vivo cell tracking is the detection of luciferase activity by bioluminescence imaging (BLI). Since this approach is based on genetic modification of the cells, the clinical perspective remains questionable. But at least for experimental approaches, the analysis of cell survival is more feasible by BLI than by MRI (5), despite disadvantages including lower sensitivity and tissue penetration. MRI provides anatomical details in high resolution, allowing three-dimensional localization of transplanted cells in the anatomical context of the host tissue. Additionally, cine sequences can be acquired for the analysis of cardiac function. For the purpose of this study, MRI proved its superiority with regard to BLI, since it focused on the localization of transplanted cells and the determination of changes of cardiac function over time.
Cell Tracking
Most of the published works focusing on in vivo cell tracking either applied clinical 3.0 T MRI devices in large animal models (13,19) or experimental high Tesla MRI devices optimized for small animals (i.e., mice and rats) (3,7,8). The aim of this study was to establish a broadly accessible setup for in vivo cell tracking and the evaluation of cardiac function for small animal models using a clinical 3.0 T MRI device.
The MRI scanner used in this study was able to detect a minimum of 104 labeled MSCs injected into the hind limb of mice using T1-weighted sequences (data not shown). T1-weighted sequences were chosen, despite the fact that T2*-weighted sequences have a superior sensitivity for iron oxide (42), since they display higher anatomical detail, necessary for the accurate analysis of cardiac function, while maintaining sufficient sensitivity for cell tracking. We transplanted 105 labeled MSCs into infarcted mouse myocardium and were able to detect signal voids in the left ventricular wall over a time span of 4 weeks in vivo. Whole-body scans for the detection of transplanted MSC in other regions and organs have not been performed. Organ-specific optimized MRI sequences would be necessary in order to differentiate microsphere generated signal voids from tissue background. The necessary scan time to assess all potential target organs would have exceeded the duration of general anesthesia in mice. Nevertheless, Muller-Ehmsen and coworkers already demonstrated the early translocation of intramyocardially transplanted MSCs to other organs, that is, spleen, lungs, and kidneys by polymerase chain reaction (26).
Using sagittal slices from MRI, the LVEF was assessed on a weekly basis for 4 weeks after transplantation. When comparing the development of LVEF of MSC-transplanted versus sham-transplanted mice, there was no significant difference between the groups at 4 weeks.
In most cardiac cell therapy studies, high numbers of cells were transplanted in order to maximize the regenerative efficacy (20,25,33). Since the aim of this study was to establish the use of a clinical 3.0 T MRI scanner for cell tracking in mice and to determine the detection threshold for transplanted cells, the number of transplanted cells was significantly lower than the proposed therapeutically efficient cell dosage resulting only in minor functional effects, as expected.
The quantitative assessment of the signal voids showed decreasing size of the void area, while the intensity increased, suggesting that the transplanted cells condense in the host tissue. Histological analysis confirmed the localization of MPIOs within the targeted peri-infarct region of the left ventricular wall. Furthermore, we found trails of MPIOs from the injection site to the infarction area, indicating a migration of labeled MSCs towards the site of injury, as described previously (18).
In two of five animals receiving labeled MSCs, we were not able to detect cells by histochemistry. In one of these two animals, specific signal voids in the ventricular wall were also not detectable by MRI. Intramyocardial injections into murine hearts are known to be technically challenging. The retention and survival of the transplanted cells is low due to mechanical loss, wash-out, and apoptosis (43). Multiple injections, the monitoring of transplanted cells immediately after injection by bioluminiscene and the addition of gelling substances to the cell suspensions are options to improve the quality of intramyocardial cell transplantation.
One major limitation of in vivo MR imaging using MPIOs as a contrast agent is the inability to distinguish whether the contrast agent remains internalized within the labeled cell or is released and either deposited in the tissue or reinternalized by other cells (i.e., macrophages) (39). Histological analysis of sections from hearts explanted 4 weeks after transplantation of 105 MSCs labeled with MPIOs and the vital stain Vybrant DiI showed a colocalization of both stains confirming the retention of MPIOs within vital MSCs. Nevertheless, the histochemistry-based assessment does not allow quantitative analysis. A periodical analysis, that is, on a weekly basis, may provide interesting information about the cell retention kinetics of MPIO-labeled MSCs without quantitative evidence.
In summary, the presented work provides a simple and highly efficient protocol for labeling, transplantation, and MR imaging of murine MSCs, allowing simultaneous cell tracking and evaluation of cardiac function in a small animal model using a clinical MRI device.
Footnotes
Acknowledgments
The authors would like to thank Jan Kleimann, Samira Karavidic, and Laura Wilden for excellent technical assistance. This work was funded in parts by the