
Abstract
Type 1 diabetes mellitus (T1DM) is the most common type of diabetes in children and adolescents. Diabetic subjects are more likely to experience a myocardial infarction compared to nondiabetic subjects. In recent years, induced pluripotent stem cells (iPSCs) have received increasing attention from basic scientists and clinicians and hold promise for myocardial regeneration due to their unlimited proliferation potential and differentiation capacity. However, cardiomyogenesis of type 1 diabetic donor-derived iPSCs (TIDM-iPSCs) has not been investigated yet. The aim of the study was to comparatively analyze cardiomyocyte (CM) differentiation capacity of nondiabetic donor-derived iPSCs (N-iPSCs) and TIDM-iPSCs. The differentiated CMs were confirmed by both expression of cardiac-specific markers and presence of cardiac action potential. Since mitochondrial bioenergetics is vital to every aspect of CM function, extracellular acidification rates and oxygen consumption rates were measured using Seahorse extracellular flux analyzer. The results showed that N-iPSCs and T1DM-iPSCs demonstrated similar capacity of differentiation into spontaneously contracting CMs exhibiting nodal-, atrial-, or ventricular-like action potentials. Differentiation efficiency was up to 90%. In addition, the CMs differentiated from N-iPSCs and T1DM-iPSCs (N-iPSC-CMs and T1DM-iPSC-CMs, respectively) showed 1) well-regulated glucose utilization at the level of glycolysis and mitochondrial oxidative phosphorylation and 2) the ability to switch metabolic pathways independent of extracellular glucose concentration. Collectively, we demonstrate for the first time that T1DM-iPSCs can differentiate into functional CMs with well-regulated glucose utilization as shown in N-iPSCs, suggesting that T1DM-iPSC-CMs might be a promising autologous cell source for myocardial regeneration in type 1 diabetes patients.
Introduction
Despite advances in traditional pharmacological therapies for heart disease, myocardial infarction (MI) is still a leading cause of mortality worldwide. Type 1 diabetes mellitus (T1DM) accounts for 5% to 10% of the total cases of diabetes and is the most common type of diabetes in children and adolescents (18). Diabetes mellitus is a major risk factor for coronary artery disease and is associated with a higher incidence of MI (8,9,12,23). Currently, heart transplantation is the only effective treatment of end-stage ischemic heart disease. Unfortunately, the insufficient number of available donor hearts and immunorejection limit the use of transplantation. Given this limitation, new therapeutic approaches for MI are required. In recent years, stem cells have received increasing attention from basic scientists and clinicians and hold great promise for myocardial regeneration (3,11,15,16,24).
Different adult stem cells (e.g., adipose tissue-derived stem cells and bone marrow-derived stem cells) have been shown to improve cardiac function in preclinical animal models. The therapeutic effect was largely derived from the proteins secreted by injected cells (3,5,10). However, cardiac function improvement was modest, partially due to very low efficiency of cardiomyocyte (CM) differentiation from adult stem cells. For instance, Bai et al. intramyocardially injected adipose tissue-derived stem cells into mice with MI. Four weeks after transplantation, only fewer than 3% of injected ASCs differentiated into CMs. In comparison with adult stem cells, embryonic stem cells (ESCs) derived from the inner cell mass of a blastocyst, an early stage preimplantation embryo, exhibit stronger proliferation and differentiation potential both in vitro and in vivo (22,27). However, several major issues, including ethical concerns and potential immunorejection, limit the practical use of ESCs.
Induced pluripotent stem cells (iPSCs) are generated from somatic cells (e.g., skin fibroblasts) through ectopic expression of defined reprogramming factors (30,32). The reprogrammed iPSCs can escape cellular senescence and appear almost identical to ESCs in cell morphology, proliferation, and differentiation potential. iPSCs are capable of propagating indefinitely and differentiating into all types of cells carrying the genetic background of patients (20,21). Unlike the use of ESCs, application of patient-derived iPSCs does not come with ethical issues and immunorejection. Since diabetes mellitus is associated with a higher incidence of MI, transplantation of CMs differentiated from type 1 diabetic donor-derived iPSCs hold great promise for autologous transplantation for myocardial regeneration. It is not clear whether functional cardiomyocytes can be generated from iPSCs reprogrammed from T1DM patient-derived fibroblasts.
Cardiomyogenesis of iPSCs can be characterized by the presence of cardiac-specific proteins and spontaneous contraction in iPSC-CMs. Mitochondrial bioenergetics is also vital to every aspect of CM function. Currently, little is known about the cardiomyogenesis of type 1 diabetic donor-derived iPSCs (TIDM-iPSCs) and mitochondrial bioenergetics of differentiated CMs from T1DM-iPSCs. Thus, the aim of the study was to comparatively analyze 1) cardiomyogenesis of nondiabetic donor-derived iPSCs (N-iPSCs) and T1DM-iPSCs and 2) mitochondrial bioenergetics of the CMs differentiated from N-iPSCs and T1DM-iPSCs (referred to as N-iPSC-CMs and T1DM-iPSC-CMs, respectively).
Materials and Methods
Human iPSC Culture
The N-iPSCs were generated in the laboratory of Dr. Stephen Duncan, (Professor, Vice Chairman in the Department of Cell Biology, Medical College of Wisconsin). The T1DM-iPSCs were generated in the laboratory of Dr. Douglas Melton (Professor, Department of Stem Cell and Regenerative Biology, Harvard University). N-iPSCs and T1DM-iPSCs were generated from dermal fibroblasts isolated from a nondiabetic donor and a type 1 diabetic donor, respectively (19,28,29). iPSCs were cultured according to a previously described protocol (32), which is briefly described as follows. Mitotically inactivated mouse embryonic fibroblasts (MEFs) by mitomycin C (Sigma-Aldrich, St. Louis, MO, USA) were used as feeder cells to support the growth and maintenance of iPSCs. Inactivated MEFs were plated in 0.1% gelatin-coated 60-mm culture dishes containing Dulbecco's modified Eagle's medium (DMEM) supplemented with 10% fetal bovine serum (Life Technologies, Grand Island, NY, USA) in a humidified incubator under normoxic conditions (20% O2, 5% CO2) at 37°C. On the following day, iPSCs were plated on MEFs and cultured in a hypoxic incubator (4% O2, 5% CO2). iPSC culture medium consisted of DMEM/F12 supplemented with 20% knockout serum replacement (Life Technologies), 1% nonessential amino acids (Millipore, Billerica, MA, USA), 1% penicillin–streptomycin (Life Technologies), 1 mM L-glutamine (Millipore), 0.1 mM β-mercaptoethanol (Sigma-Aldrich), and 4 ng/ml human recombinant basic fibroblast growth factor (bFGF; Life Technologies). The medium was changed daily. iPSCs were passaged every 5-7 days using Accutase (Innovative Cell Technologies, San Diego, CA, USA) when they reached 70% to 80% confluence.
Cell Growth Assay
iPSCs were seeded at a density of 2.0 × 10⁵ cells/well with reduced growth factor Matrigel (BD Biosciences, San Jose, CA, USA)-coated six-well plates and cultured in mTeSR1 medium (STEMCELL Technologies, Vancouver, BC, Canada). Each well was washed with phosphate-buffered saline (PBS; Life Technologies) twice, and digested with Accutase every 24 h for 4 days. The number of cells per well was evaluated by counting with a hemocytometer. Results were obtained from three independently passaged samples.
Differentiation of iPSCs Into CMs
Cardiac differentiation was performed as described previously (17). Briefly, colonies of iPSCs were plated onto dishes precoated with Matrigel and cultured in mTeSR1 medium in a hypoxic incubator (4% O2, 5% CO2). Before starting cardiac differentiation, iPSCs were singularized with Accutase and seeded on a Matrigel-coated plate at the density of 100,000 cells/cm2 in mTeSR1 medium supplemented with 10 μM ROCK inhibitor Y-27632 (EMD Millipore). The medium was changed daily. When the cells reached 100% confluence (the day was referred to as day 0), the medium was replaced with RPMI/B27 without insulin (Life Technologies) supplemented with 12 μM CHIR-99021 (Selleck Chemicals, Houston, TX, USA), and the cells were cultured in a normoxic incubator (20% O2, 5% CO2). After 24 h, the culture medium was switched to RPMI/B27 without insulin and changed daily. On day 3, 5 μM Wnt Inhibitor IWP-2 (Stemgent, Cambridge, MA, USA) was added to the medium, and cells were cultured for 48 h. On day 5, the culture medium was switched to RPMI/B27 without insulin and changed daily. On day 7, the culture medium was switched to RPMI/B27 with insulin (Life Technologies) and changed every 2 days. Daily microscopic observations were conducted to detect the appearance of contracting cells.
Single Cell Dissociation
Spontaneously contracting cells were treated with 0.25% trypsin–EDTA (Life Technologies) supplemented with 5% chicken serum (Sigma-Aldrich) for 10-15 min at 37°C. The trypsin was inactivated with DMEM containing 10% fetal bovine serum. Dissociated cells were collected by centrifugation (1,000 rpm, 3 min), resuspended in RPMI/B27, and plated onto Matrigel-coated plates or dishes with or without glass coverslips. Dissociated cells were incubated for 5-7 days before being used for the experiments. In order to exclude the effect of CM proliferation on the following experiments, we used spontaneously contracting CMs at 60 days after differentiation. It has been shown that iPSC-CMs barely proliferated after 60-day differentiation (33).
Immunofluorescence Staining
Cells cultured on Matrigel-coated coverslips were fixed with 1% paraformaldehyde (Sigma-Aldrich) for 30 min. Cells were then washed three times with PBS alone or PBS containing 0.5% Triton X-100 (Sigma-Aldrich) and then blocked with 10% donkey serum (Sigma-Aldrich) for 30 min at room temperature. Next, cells were incubated with primary antibodies in a moist chamber for 1 h at 37°C. The primary antibodies were mouse anti-stage-specific embryonic antigen 4 (SSEA4, 1:100 dilution; Abcam, Cambridge, MA, USA) and rabbit anti-Oct4 (1:100 dilution; Abcam) for the staining of the pluripotent stem cell markers, mouse anti-sarcomeric α-actinin (1:100 dilution; Sigma-Aldrich), and rabbit anti-cardiac troponin T (1:100 dilution; Thermo Scientific, Waltham, MA, USA) for the staining of cardiac-specific markers or rabbit IgG and mouse IgG isotype controls (1:50 dilution; Santa Cruz, Dallas, TX, USA) of primary antibodies in order to exclude nonspecific staining of secondary antibodies. After two wash cycles, cells were incubated with Alexa Fluor 594 donkey anti-mouse IgG (1:1,000 dilution; Life Technologies) for 1 h at room temperature. Cell nuclei were stained with Hoechst 33342 (1:1,000 dilution; Life Technologies). The coverslips were then mounted onto the slides and observed under a laser-scanning confocal microscope (Nikon Eclipse TE2000-U, C1 Plus; Nikon Instruments Inc., Melville, NY, USA). Obtained images were analyzed by ImageJ software (National Institutes of Health, Bethesda, MD, USA). Cardiac differentiation efficiency was determined by calculating the percentage of cardiac troponin T-positive cells over the total Hoechst 33342-positive cells counted on three fields taken from each coverslip. Results were obtained from three independently differentiated cell samples.
Characterization of Electrophysiological Properties of Differentiated CMs
Contracting clusters of iPSC-CMs were replated onto Matrigel-coated coverslips and were maintained in RPMI/B27 medium to allow full attachment before intracellular recording of action potentials. Microelectrodes were pulled from borosilicate glass in a 37°C bath continuously perfused with extracellular solution containing (mM): 128 NaCl, 3.5 KCl, 2.8 CaCl2, 1.2 MgCl2, 1.2 NaHPO4, 24 NaHCO3, 11 glucose (Sigma-Aldrich), maintained at pH7.4 by bubbling 5% CO2 and 95% O2. Pipettes were filled with 2 M K+ acetate buffered with 10 mM HEPES (Sigma-Aldrich), with a resulting resistance of 60-90 MΩ. Cells were impaled under microscopic guidance. Membrane potentials were recorded using an active bridge amplifier (Axoclamp 2B; Molecular Devices, Sunnyvale, CA, USA). Voltage recordings were filtered at 10 kHz, digitized at 40 kHz (Digidata 1322A; Molecular devices), and analyzed off-line using AxoGraph X 1.3.5 (AxoGraph Scientific, Sydney, Australia) for measuring action potential (AP) duration at 90% and 50% repolarization from the AP peak (APD90, APD50, respectively), maximum rate of rise of AP upstroke (dV/dt), and maximum diastolic potential (MDP).
Assessing the Response of iPSC-CMs to β-Adrenergic Stimulant Isoproterenol
Contracting clusters of iPSC-CMs were replated onto Matrigel-coated coverslips and were maintained in RPMI/B27 medium to allow full attachment before recording. The basal contracting rate was recorded for 1 min under microscopic observation. The stage of the microscope was warmed at 37°C. β-Adrenergic response was then assessed by adding a final concentration of 500 nM isoproterenol (Sigma-Aldrich) into the culture media. The contracting rate was assessed for another 1 min.
Mitochondrial Bioenergetics Analysis
Oxygen consumption rate (OCR) and extracellular acidification rate (ECAR) were assessed simultaneously using a XF24 Extracellular Flux Analyzer (Seahorse Bioscience, North Billerica, MA, USA). iPSC-CMs were seeded at a density of 5,000, 10,000, and 20,000 in each well to determine the optimum cell number for the experiment. The density of 10,000 iPSC-CMs per well was chosen to conduct the experiments because this cell number formed a uniform monolayer in the wells and the OCR and ECAR of 10,000 were linear. Prior to analysis, cells were incubated for 1 h in the unbuffered DMEM (Life Technologies) containing either 5.5 mM glucose or 25 mM D-glucose supplemented with 100 nM insulin (Sigma-Aldrich). iPSC-CMs were equilibrated in 675 μl unbuffered DMEM in respective glucose concentration for 60 min at 37°C prior to assay. OCR and ECAR were obtained from the slope of change in oxygen and H+ concentration over time. After measurements of baseline OCR and ECAR, measurements were made following sequential automatic injections of a final concentration of 10 μM oligomycin (an ATP synthase inhibitor) (Sigma-Aldrich), 2 μM carbonyl cyanide p-[trifluoromethoxy]-ohenylhydrazone (FCCP, a mitochondrial uncoupler) (Sigma-Aldrich), 10 μM antimycin A (mitochondrial electron transport chain complex III inhibitor) (Sigma-Aldrich). All values for OCR and ECAR were normalized to protein content. OCR values were then subtracted by the values after antimycin A injection, which represents nonmitochondrial oxygen consumption. The effect of 0.1% (30% more than actually added) ethanol, the solvent for inhibitors and uncoupler, on OCR and ECAR was tested in control experiments. Respiratory parameters were calculated as described previously (7) and expressed as percent of baseline respiration for each recording. OCR related to ATP production was determined as baseline OCR minus OCR in the presence of oligomycin. OCR related to proton leak was determined as OCR in the presence of oligomycin. Maximal OCR was determined by OCR in the presence of FCCP, and reserved capacity was determined as maximal OCR minus baseline OCR (Fig. 4A). In order to assess the response of mitochondria in the differentiated CMs to an acute increase in glucose concentration, sequential automatic injections of glucose and 2-deoxyglucose at a final concentration of 25 mM and 20 mM, respectively, were applied after measurements of baseline OCR and ECAR in 5.5 mM glucose.
Quantification of Protein Content
After measurements of mitochondrial bioenergetics, medium was aspirated from each well. Cells were lysed in 50 μl of 2% sodium dodecyl sulfate (Bio-Rad, Hercules, CA, USA). Protein assay was conducted using Bio-Rad DC protein assay kit (Bio-Rad) according to the company's protocol.
Statistical Analysis
Reported values were expressed as the means ± SEM. Statistical analysis was conducted using Graph Pad Prism version 5.04 (GraphPad Software, San Diego, CA, USA). The statistically significant differences of raw data among two groups within the same cell line were tested by paired t-test. Unpaired t-test was used for the comparison between the two cell lines. One-way analysis of variance and Tukey's post hoc test were used for testing multiple groups. A level of p < 0.05 was considered to be statistically significant.
Results
N-iPSCs and T1DM-iPSCs Express Pluripotent Stem Cell Markers and Show Similar Proliferation Capacity
Both N-iPSCs and TIDM-iPSCs cultured on MEFs grew as colonies with clear boundaries distinguished from surrounding MEFs (Fig. 1A). The colonies were composed of a densely packed homogenous cell population. These colonies with typical iPSC morphology were positively stained with pluripotent marker SSEA4 and Oct4 (Fig. 1B-a to d). In order to exclude the nonspecific staining of secondary antibodies during immunofluorescent staining, we stained iPSCs with rabbit IgG or mouse IgG as isotype controls of primary antibodies (rabbit anti-Oct4 or mouse anti-SSEA4) instead of the primary antibodies. The images showed that there were no fluorescent signals except blue nuclei in both N-iPSCs and TIDM-iPSCs stained with either rabbit IgG or mouse IgG (Fig. 1B-e to h), suggesting that the fluorescent signals from the respective primary antibody (rabbit anti-Oct4 or mouse anti-SSEA4) staining are specific in Figures 1B-a to d. N-iPSCs and TIDM-iPSCs showed the similar proliferation capacity. The doubling times calculated from the growth curve of N-iPSCs and TIDM-iPSCs were around 22 h (Fig. 1C).

Phenotypic characterization of iPSCs derived from a nondiabetic individual and a patient with T1DM (N-iPSCs and TIDM-iPSCs, respectively). (A) Bright field images of undifferentiated iPSC colonies cultured on MEF feeder layer. iPSCs exhibited dense and compact colonies. Scale bar: 500 μm. (B) Confocal fluorescent images of iPSCs after immunostaining. Both N-iPSCs and TIDM-iPSCs expressed pluripotent markers Oct4 in the nuclei and SSEA4 in cell membranes (red signals). Nuclei were stained blue with Hoechst 33342 (a-d). However, the images of cells stained with either rabbit IgG or mouse IgG as isotype controls of the primary antibodies (rabbit anti-Oct4 and mouse anti-SSEA4) did not show any red fluorescent signals (e-h). Scale bar: 20 μm. (C) Growth curve of iPSCs. Total cell number was counted at 24-h intervals to generate a growth curve. N-iPSCs and TIDM-iPSCs exhibited similar proliferation capacity (n = 3 independent passages).
Both N-iPSCs and TIDM-iPSCs Differentiate Into Spontaneously Contracting CMs
After the induction of cardiac differentiation, cells were monitored daily. Spontaneously contracting cells were observed as early as postdifferentiation day 9. The contracting cells, replated as a monolayer, maintained spontaneous synchronized contraction. The individual contracting cells were diverse in size, shape, and number of nuclei (Fig. 2A, B). Over 90% of the contracting cells from both cell lines were positive for CM-specific marker troponin T (Fig. 2C, D, and I). The organized patterns of striation were observed under higher magnification of the cells stained for troponin T (Fig. 2E, F) and sarcomeric α-actinin (Fig. 2G, H). However, there were no fluorescent signals except blue nuclei in both N-iPSC-CMs and T1DM-iPSC-CMs stained with either rabbit IgG or mouse IgG as isotype controls of primary antibodies (rabbit anti-troponin T or mouse anti-sarcomeric α-actinin) instead of the primary antibodies (Fig. 2I, L), suggesting that the fluorescent signals from the respective primary antibody (rabbit anti-troponin T or mouse anti-sarcomeric α-actinin) staining are specific in Figure 2C-H.
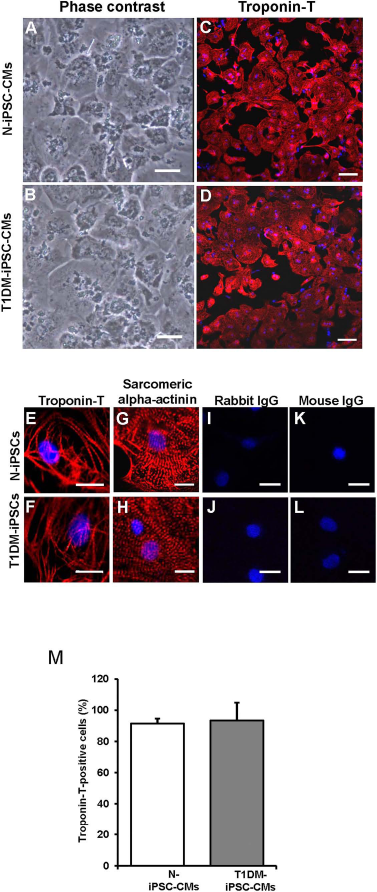
Phenotypic characterizations of CMs differentiated from N-iPSCs and T1DM-iPSCs (N-iPSC-CMs and T1DM-iPSC-CMs, respectively). (A, B) Phase contrast images of monolayer of spontaneously contracting CMs cultured on Matrigel-coated culture dish. Scale bars: 50 μm. (C, D) Immunostaining of cardiac-specific marker troponin T obtained at low magnification. Scale bars: 100 μm. (E–H) Immunostaining of cardiac-specific marker troponin T and sarcomeric α-actinin at high magnification. N-iPSCs-CMs and T1DM-iPSCs-CMs exhibited organized patterns of striation. Nuclei are stained blue with Hoechst 33342. (I–L) Immunostaining of iPSC-CMs with either rabbit IgG or mouse IgG as isotype controls of the primary antibodies (rabbit anti-troponin T and mouse anti-sarcomeric α-actinin). The images did not show any red fluorescent signals (E–H). Scale bars: 20 μm. (M) Troponin T-positive cells expressed as percentage of total cell number.
Both N-iPSC-CMs and TWM-iPSC-CMs Exhibit Three Major Types of Cardiac Action Potentials and Are Responsive to β-Adrenergk Stimulation
Functional properties of differentiated CMs were confirmed by recording action potentials (APs) and testing response to a β-adrenergic stimulant. ADP50 and APD90, dV/dt max, and MDP were analyzed from APs recorded from spontaneously contracting CMs. We categorized the recordings into three major types of cardiac APs: nodal-like, atrial-like, and ventricular-like APs (Fig. 3A). The criteria used for the categorization of AP properties were atrial- and ventricular-like APs displayed more negative MDPs with higher dV/dtmax than nodal-like cells (33). Ventricular-like APs had longer APDs than atrial cells. We observed significant differences in dV/dt max and MDP between N-iPSC-CMs and T1DM-iPSC-CMs. Both N-iPSC-CMs and T1DM-iPSC-CMs exhibited the three major types of cardiac APs (Table 1). Application of β-adrenergic stimulant isoproterenol increased the rate of contraction in both N-iPSC-CMs and T1DM-iPSC-CMs, indicating the presence of functional cardiac β-adrenergic receptors in these differentiated CMs (Fig. 3B).

Functional characterization of CMs differentiated from N-iPSCs and TIDM-iPSCs. (A) Representative intracellular recordings of three major types of cardiac action potentials. Both N-iPSC-CMs and TIDM-iPSC-CMs were able to differentiate into nodal-like, atrial-like, and ventricular-like cardiomyocytes. (B) Baseline contracting rate of differentiated CMs and the contracting rate of CMs in response to 500 nM isoproterenol, a β-adrenergic agonist (n = 9, three contracting clusters each from three independent differentiations/each cell line, *p < 0.05 compared to baseline).

Mitochondrial function of N-iPSC-CMs and TIDM-iPSC-CMs cultured in varying glucose concentrations. Representative trace of oxygen consumption rate (OCR) of N-iPSC-CMs demonstrating basal OCR, ATP-linked OCR, proton leak-induced OCR, maximal OCR reserve capacity, and nonmitochondrial OCR measured after consecutively adding oligomycin, FCCP, and antimycin A. (B) Prior to analysis, cells were incubated for 1 h in the unbuffered DMEM containing either 5.5 mM glucose or 25 mM D-glucose supplemented with 100 nM insulin. TIDM-iPSC-CMs featured lower basal OCR compared to N-iPSC-CMs when cultured in both 5.5 mM and 25 mM glucose. Glucose concentration did not affect basal OCR in both cell lines. (C–F) Percentages of ATP-linked OCR (C), proton leak-induced OCR (D), maximal OCR (E), and reserve capacity (F) relative to baseline OCR were comparable between the cell lines and independent of the glucose concentration (n = 3 independent differentiations/cell line, triplicates, *p < 0.05 compared to N-iPSC-CMs in 5.5 mM glucose, #p < 0.05 compared to N-iPSC-CMs in 25 mM glucose).
Action Potential Properties of N-iPSC-CMs and TIDM-iPSC-CMs
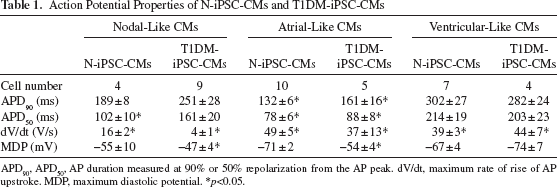
APD90, APD50, AP duration measured at 90% or 50% repolarization from the AP peak. dV/dt, maximum rate of rise of AP upstroke. MDP, maximum diastolic potential.
p<0.05.
Bioenergetics of Differentiated CMs
OCR and ECAR of intact iPSC-CMs were assessed in varying glucose concentrations using an extracellular flux analyzer. Independently of the glucose concentration, the basal OCR was significantly lower in T1DM-iPSC-CMs compared to N-iPSC-CMs (Fig. 4A and B). Varying glucose concentrations did not influence OCR related to ATP synthesis, OCR-related proton leak, maximal OCR, or reserve capacity (Fig. 4C-F). Similarly, basal ECAR was significantly lower in T1DM-iPSC-CMs compared to N-iPSC-CMs, while the different glucose concentrations in medium did not influence basal ECAR or ECAR in response to oligomycin (Fig. 5). Upon acute injection of glucose and 2-deoxyglucose, OCR did not change (Fig. 6A). However, a significant increase in ECAR was found in both T1DM-iPSC-CMs and N-iPSC-CMs following glucose injection, while ECAR decreased after the injection of 2-deoxyglucose and then gradually returned to the baseline ECAR (Fig. 6B). When compared to medium addition, ethanol, the solvent of oligomycin, FCCP, and antimycin A, had no significant effect on OCR and ECAR of N-iPSC-CMs and T1DM-iPSC-CMs, which were incubated in 5 mM (Fig. 7) and 25 mM glucose conditions (data not shown).

ECAR of N-iPSC-CMs and TIDM-iPSC-CMs cultured in varying glucose concentrations. (A) Prior to analysis, cells were incubated for 1 h in the unbuffered DMEM containing either 5.5 mM glucose or 25 mM D-glucose supplemented with 100 nM insulin. TIDM-iPSC-CMs showed lower basal ECAR than N-iPSC-CMs exposed to both 5.5 mM and 25 mM glucose. Glucose concentration did not affect basal ECAR in either cell entity. (B) Percent increase of ECAR relative to basal ECAR in response to oligomycin, an ATP synthase inhibitor, was independent of the glucose concentration (n = 3 independent differentiations/cell line, triplicates, *p < 0.05 compared to N-iPSC-CMs in 5.5 mM glucose, #p < 0.05 compared to N-iPSC-CMs in 25 mM glucose).

Direct effect of glucose on OCR and ECAR. (A) Injection of glucose (25 mM) and 2-deoxyglucose (20 mM) did not change OCR of both cell lines. (B) Injection of glucose (25 mM) increased while 2-deoxyglucose (20 mM) decreased ECAR transiently in both cell lines (n = 3 independent differentiations/cell line, triplicates, *p < 0.05 compared to baseline of N-iPSC-CMs in 5.5 mM, #p < 0.05 compared to baseline of T1DM-iPSC-CMs).

The effect of ethanol on OCR and ECAR. Ethanol is the solvent of oligomycin, FCCP, and antimycin A that were used in the bioenergetics experiments. In the bioenergetics experiments, ethanol alone was added to the culture instead of culture medium, and the changes of OCR and ECAR were measured. (A) OCR assay of N-iPSC-CMs (a) and T1DM-iPSC-CMs (b) in 5 mM condition. (B) ECAR assay in N-iPSC-CMs (a) and T1DM-iPSC-CMs (b) in 5 mM condition. There were no significant differences (N.S.) of OCR and ECAR between medium- and ethanol-treated groups (n = 3 independent differentiations/cell line).
Discussion
In this study, we comparatively analyzed CM differentiation capacity of N-iPSCs and T1DM-iPSCs and mitochondrial bioenergetics of the CMs differentiated from N-iPSCs and T1DM-iPSCs (N-iPSC-CMs and T1DM-iPSC-CMs, respectively). The results revealed for the first time that N-iPSCs and T1DM-iPSCs showed similar potential for proliferation and differentiation into spontaneously contracting CMs exhibiting nodal-, atrial-, or ventricular-like APs. Differentiation efficiency was up to 90%. In addition, the CMs differentiated from N-iPSCs and T1DM-iPSCs shared a similar mitochondrial bioenergetics profile as evidenced by 1) the well-regulated glucose utilization at the level of glycolysis and mitochondrial oxidative phosphorylation and 2) the ability to switch metabolic pathways independent of extracellular glucose concentration, suggesting that T1DM-iPSC-CMs might be a promising autologous cell source for myocardial regeneration in type 1 diabetes patients with injured hearts.
In order to utilize TIDM-iPSC-CMs for myocardial regeneration, first a robust and efficient cardiac differentiation is required. The efficiency of generating contracting CMs from human iPSCs was low and in the range of 5% to 15% using an embryoid body differentiation system (34). Recent efforts in optimizing bone morphogenetic protein 4-mediated CM differentiation (14), and enriching CMs by vascular cell adhesion molecule surface expression (31), improved the cardiac differentiation efficiency of iPSCs and yielded to purified CMs with variable success.
Here, we used the monolayer-based directed CM differentiation protocol from Lian et al. (17). The protocol was developed for generation of CMs by temporal modulation of Wnt signaling on iPSCs through sequential treatment with a GSK3β inhibitor (CHIR-99021) and Wnt inhibitor (IWP-2). We observed comparable differentiation efficiency (over 90%) in both N-iPSCs and T1DM-iPSCs with high reproducibility. The successful cardiac differentiation in these two cell lines was confirmed by spontaneous contraction of the cells and the expression of cardiac-specific proteins (troponin T and sarcomeric α-actinin) (Figs. 1 and 2). Importantly, these contracting cells were responsive to a β-adrenergic agonist and exhibited cardiac APs. These data suggest that highly purified functional CMs can be generated from TIDM-iPSCs by manipulation of a single developmental Wnt pathway through culturing iPSCs in chemically defined induction medium, facilitating scalable production of TIDM-iPSC-CMs for myocardial regeneration applications. However, our differentiated cells are heterogeneous, including nodal-, atrial-, and ventricular-like CMs (Fig. 3 and Table 1). A similar finding of heterogeneous CMs differentiated from iPSCs was also reported by other groups (13). In addition, some parameters (e.g., MDP) of APs varied between N-iPSC-CMs and T1DM-iPSC-CMs. Thus, challenges remain in the generation of homogeneous ventricular CMs for regeneration of injured hearts. Alternatively, we have developed a lentiviral vector containing green fluorescence gene whose expression is under the transcriptional control of a ventricular myocyte-specific (myosin light chain-2v) promoter (4,6). Thus, green fluorescence protein-positive ventricular CMs can be enriched from heterogeneous iPSC-CM culture through fluorescence-activated cell sorting for transplantation applications.
Mitochondrial bioenergetics is vital for all aspects of cell function. Each type of cell has its unique bioenergetic profiling to meet the specialized functions and bioenergetics requirements. Thus, we next comparatively analyzed the mitochondrial bioenergetics of N-iPSC-CMs and T1DM-iPSC-CMs and the response to subacute glucose treatment. The results showed that there were no differences of ATP-linked OCR, OCR related to uncoupling, maximal OCR, and reserve capacity between N-iPSC-CMs and T1DM-iPSC-CMs. In addition, mitochondrial bioenergetics exhibited a similar response to subacutely elevated glucose in N-iPSC-CMs and T1DM-iPSC-CMs (Fig. 4). It has been suggested that in healthy CMs, glucose transport and metabolism are highly regulated by the balance of energy demand and supply of other substrates (2). Accordingly, we observed no effect of subacute extracellular high glucose on mitochondrial basal OCR, ATP-linked OCR, OCR related to uncoupling, maximal OCR, reserve capacity (Fig. 4), and basal ECAR (Fig. 5), suggesting well-regulated glucose utilization at the level of glycolysis and mitochondrial oxidative phosphorylation in both N-iPSC-CMs and T1DM-iPSC-CMs.
The corresponding increase in glycolysis rate indicated by ECAR upon inhibition of oxidative phosphorylation indicates that iPSC-CMs are capable of switching metabolic pathways. Additionally, when the glucose concentration increased acutely by glucose injection from 5.5 mM to 25 mM, we observed a significant transient increase of ECAR followed by a gradual return close to the baseline level. Similarly, when blocking glycolysis by 2-deoxyglucose, ECAR significantly decreased transiently. Under the same conditions, OCR still remained unaffected (Fig. 6). Thus, a sudden rise in glucose stimulates glycolysis transiently, while oxidative phosphorylation remains tightly controlled in the differentiated CMs. Nevertheless, CMs are highly flexible and well regulated in utilizing energy sources depending on the substrate availability and ATP demand. This is also supported by recent findings that the ATP content was comparable across various glucose concentrations in iPSC-CMs (25). Also, in adult rat CMs, OCR was independent of the glucose concentration (26).
We observed the differences in basal OCR (Fig. 4B) and ECAR (Fig. 5A) between N-iPSC-CMs and T1DM-iPSC-CMs. Lower ECAR and OCR indicate a lower metabolic activity either due to lower substrate/oxygen supply/uptake or lower energy demand in TIDM-iPSC-CMs. The supply side of that equation can be excluded as substrate, and oxygen supply is fixed in our experiments. The uptake of substrate and oxygen are controlled by multiple steps depending on the ATP demand, insulin signaling, glucose uptake by glucose transporters, glycolysis, and mitochondrial oxidative phosphorylation (1). We observed in the presence of FCCP and oligomycin for both cell lines a comparable degree of increase in OCR and ECAR, respectively, together with a comparable reserve capacity in respiration. These results suggest a similar uptake capability for both cell lines.
The main determinants for energy demand for CMs are beating rate and contractility. The beating rate differs depending on the cardiac cell subpopulation. It is fastest in sinoatrial node cells and slowest in ventricular cells. While on average we did not find a difference in beating rate between N-iPSC-CMs and TIDM-iPSC-CMs (Fig. 3B), there were variations of beating rate within a cell line over time. Thus, to completely rule out a contribution of beating rate or contractility to differences in OCR and ECAR, measurements would need to be run in parallel to bioenergetics assays, which is difficult to achieve.
We characterized the subpopulation heterogeneity qualitatively by action potential recording and established the presence of different cardiac cell types (Table 1). While we observed a higher percentage of atrial-like cardiomyocytes in N-iPSC-CMs (48%) compared to TIDM-iPSC-CMs (27%) that could explain their higher metabolic rate, we think it would be unreasonable to draw a final conclusion on the distribution of the cell type due to the relatively low cell number (around 20 for each cell line). Whether and to what extent genetic variability (either random variability or specifically T1DM-related) contributes to metabolic differences within and between the cell lines remains unknown. Only after iPSCs can be generated from the somatic cells harvested from a significant amount of healthy and T1DM-patients and then differentiated into CMs, the contributions of genetic variability to metabolic differences observed will be possibly determined.
In conclusion, we have generated for the first time functional and highly purified CMs from T1DM patient-derived iPSCs using the monolayer-based CM differentiation protocol. TIDM-iPSC-CMs and N-iPSC-CMs share similar cell characteristics in cardiac-specific protein expression, spontaneous contractions, exhibiting APs, and response to β-adrenergic stimulant isoproterenol. They also showed similar CM metabolic characteristics: the glucose metabolism is well regulated at the level of glycolysis and mitochondrial oxidative phosphorylation; and cells maintain the ability to switch metabolic pathways. Moreover iPSC-derived CMs can be generated without shortage and carry the patient's genetic information. Thus, TIDM-iPSC-CMs are a promising autologous cell source for myocardial regeneration in type 1 diabetes patients.
Footnotes
Acknowledgments
Thanks to Terri Misorski for editorial and proofreading assistance, and Dr. Wai-Meng Kwok and Dr. Quinn Hogan for patch clamp data analysis. This work was supported by P01GM066730, R01HL034708 from the NIH, Bethesda, MD, and by FP00003109 from Advancing a Healthier Wisconsin Research and Education Initiative Fund (to Dr. Zeljko Bosnjak), and by grant R01GM112696 from the NIH, Bethesda, MD (to Dr. Xiaowen Bai). The authors declare no conflicts of interest.