
Abstract
Induced pluripotent stem cells (iPSCs) offer certain advantages over embryonic stem cells in cell replacement therapy for a variety of neurological disorders. However, reliable procedures, whereby transplanted iPSCs can survive and differentiate into functional neurons, without forming tumors, have yet to be devised. Currently, retroviral or lentiviral reprogramming methods are often used to reprogram somatic cells. Although the use of these viruses has proven to be effective, formation of tumors often results following in vivo transplantation, possibly due to the integration of the reprogramming genes. The goal of the current study was to develop a new approach, using an adenovirus for reprogramming cells, characterize the iPSCs in vitro, and test their safety, survivability, and ability to differentiate into region-appropriate neurons following transplantation into the rat brain. To this end, iPSCs were derived from bone marrow-derived mesenchymal stem cells and tail-tip fibroblasts using a single cassette lentivirus or a combination of adenoviruses. The reprogramming efficiency and levels of pluripotency were compared using immunocytochemistry, flow cytometry, and real-time polymerase chain reaction. Our data indicate that adenovirus-generated iPSCs from tail-tip fibroblasts are as efficient as the method we used for lentiviral reprogramming. All generated iPSCs were also capable of differentiating into neuronal-like cells in vitro. To test the in vivo survivability and the ability to differentiate into region-specific neurons in the absence of tumor formation, 400,000 of the iPSCs derived from tail-tip fibroblasts that were transfected with the adenovirus pair were transplanted into the striatum of adult, immune-competent rats. We observed that these iPSCs produced region-specific neuronal phenotypes, in the absence of tumor formation, at 90 days posttransplantation. These results suggest that adenovirus-generated iPSCs may provide a safe and viable means for neuronal replacement therapies.
Keywords
Introduction
At the blastocyst stage of development, cells of the inner mass are capable of forming each of the three germ layers. Cells of the inner mass have been termed pluripotent, meaning that they can give rise to the mesoderm, endoderm, and ectoderm, but not the extraembryonic tissue, such as the placenta. Embryonic stem (ES) cells are isolated from the inner mass cells. Inner mass cells eventually commit to one of the three germ layers and begin to differentiate into specialized tissues that will become the brain, intestines, cardiac tissue, and all other cells found in the adult body. Typically, differentiated cells do not switch between germ layers once they have reached their designated lineage (46). The inability of differentiated cells to transform into other germ layers is associated with the inactivation of specific genes, but three approaches have proven that cell differentiation is reversible: nuclear transfer (7), cell fusion (5), and transcription factor transduction (42).
Transcription factor transduction is a prominent example of the plasticity of differentiated cells in that a disruption to the stoichiometry of transcription regulators can cause cells to change fate. In a seminal publication, Takahashi and Yamanaka (42) demonstrated that differentiated somatic cells could be reverted back to an ES-like state by forced expression of four factors, octamer-binding transcription factor 4 (Oct4), sex-determining region Y box 2
Since the initial generation of iPSCs by Takahashi and Yamanaka (42), several groups have replicated their results using skin biopsies (19), liver (1), bone marrow (31), and neural stem cells (10) from mouse (9), rat (25), and human cells (11). In the reprogramming process of generating iPSCs, Sox2, Klf4, and c-Myc can be replaced by close homologs and small molecules (15,19,22). Oct4 has been shown to be essential for iPSC generation and can only be replaced by its upstream regulator, nuclear receptor subfamily 5 group A member 2 (Nr5a2) (17). While it is possible to reprogram specific cell types using multiple factor combinations, the highest efficiencies are observed when the original four factors are used [for review, see Ho et al. (18)]. For cell reprogramming to occur, the transgenes encoding the four factors only need to be present while the iPSCs are being generated.
Once iPSCs are formed, the transgenes are typically silenced, and pluripotency is maintained and regulated by the activated endogenous genes (46). The reprogramming factors are usually silenced after iPSC formation, so research has focused on novel transfecting methods to deliver the reprogramming factors in a safer and more efficient manner. The use of iPSCs that have been reprogrammed using integrative strategies are thought to be affected by phenotypic alterations caused by genomic alterations through insertional mutagenesis or expression of oncogenic transgenes (18,29,34,44). Lentiviral transfection, using a single cassette containing four factors (39), nonintegrating polycistronic constructs (16), four separate adenoviruses containing the factors (41), nonviral single multiprotein expression vectors (21), and nonviral minicircle vectors (20) have all proven to be effective in generating iPSC colonies that express pluripotent markers and have the ability to differentiate into all three germ layers. However, the delivery system, combined with the reprogramming factors used, as well as the source of the starting cell, has a profound impact on the efficiency and differentiation capacity of the generated iPSCs [for review, see Lowry et al.(27)].
Given some, albeit limited, success with transplantation of fetal or embryonic tissue, transplantation of stem cells has gained attention as a possible treatment for neurodegenerative diseases, stroke, traumatic brain injury, as well as myocardial infarction. Transplantation of fetal or embryonic tissue into the brains of parkinsonian patients (14) and Huntington's disease patients (4) has provided some alleviation of symptoms in humans. While promising, use of fetal or embryonic tissues present several concerns beyond any ethical considerations. True ES cells are derived from the blastocyte and are extremely difficult to isolate in humans and have a tendency to form tumors or be rejected from the host brain (3). Fetal tissue is also difficult to utilize in humans because tissue needs to be isolated and used in a limited time window, typically within 4 h of obtaining the fetal tissue (8). Fetal cells, like embryonic cells, have a tendency to be rejected from the host tissue and have the possibility to give rise to tumors (8). Obtaining a significant number of cells for transplantation is also very difficult; in some studies, three to five fetuses are required per patient (8). With these challenges, embryonic and fetal tissue may not serve as the ideal source of cells for transplantation.
The critical advantages over fetal or embryonic cell transplants mean that iPSC-based approaches as a potential for treating neurodegenerative diseases have been the focus of a new line of research (37). The use of iPSCs holds great promise for the treatment of neurodegenerative diseases, such as Parkinson's disease, Huntington's disease, Alzheimer's disease, and amyotrophic lateral sclerosis due to the fact that these cells can be generated from the patient. This, in theory, should reduce problems of rejection (in that the iPSCs would be human leukocyte antigen matched with the recipient), issues of availability, and any ethical concerns that are associated with clinical transplantation of fetal or ES cells. While the possibility of autologous transplantation remains tantalizing, the exorbitant expense, regulatory issues with human cells, and the time it takes to generate patient-specific iPSCs may prevent many patients from utilizing this option (6). In addition, many of the diseases that could potentially be treated with iPSCs are acute in nature, and sufficient time to generate and fully characterize these cells may not be available (6). A more feasible option may be to create a bank of cytogenetically preserved iPSCs that could be immunologically matched to the recipient. Before iPSCs can truly be considered for clinical purposes, the ability of iPSCs to survive in the brain following transplantation, without tumor formation, and the ability of the cells to differentiate into functional neurons that can integrate into the host network must be examined.
A major aim of the present study was to examine the differences in reprogramming efficacies between using a single cassette lentivirus (LN) or a combination of nonintegrative adenoviruses (AD) in both mesenchymal stem cells (MSCs) and tail-tip fibroblasts (TTF). The immune response to transplanted iPSCs may be dependent on the reprogramming methods (6). It should be noted that iPSCs, reprogrammed using retroviruses, elicited a stronger T-cell response following subcutaneous injection in healthy mice than iPSCs derived via an episomal approach (48). Upon identifying the optimal cell type and transgene delivery system for safely generating fully reprogrammed iPSCs, the selected cells were then transplanted into adult, immune-competent rats. While suppressing the rat's immune system would increase the probability of cell survival, a second major goal of this study was to examine the natural response of the recipient following transplantation, as conventional long-term immunosuppression increases the attendant risk of infection and malignancy (6). Following transplantation, survival, differentiation, and tumorigenicity of the cells were examined at four different time points (5, 21, 63, and 90 days posttransplantation) to create a timeline of iPSC survival in the brain. This study represents one of the first to examine the viability and safety of transplanting AD-generated iPSCs into the brain of an immunecompetent rat.
Materials and Methods
Virus Construction
A single cassette LN and a combination of ADs were created using Oct4, Sox2, Klf4, and c-Myc (OKSM) (42). The construction of the single cassette LN was described previously (9). The LNs were then produced using 293T packaging cells (Clontech, Mountain View, CA, USA). Titers were 5 × 10⁸ TU/ml as determined by qPCR following transduction of HeLa cells (Sigma-Aldrich, St. Louis, MO, USA) using a serial dilution of the vectors (30). The recombinant ADs were developed in our lab at Central Michigan University (Mount Pleasant, MI, USA). First, to construct the shuttle vector, the Oct3/4–2A-Klf4–2A-Sox2 (OKS-2A) gene fragment was released from pCX-OKS-2A (Addgene, Cambridge, MA, USA; plasmid 19771) and the c-Myc gene from pCX-cMyc (Addgene, plasmid 19772) at the cloning sites of EcoRI [Addgenes, previously published by Okita et al.(35)]. The pacAd5 CMVK-NpA shuttle Vector from RAPAD CMV Adenoviral Expression System (Cat. # VPK-252, Cell Biolabs, San Diego, CA, USA) was linearized with EcoRI at the multiple cloning sites. Each of the four genes was treated for dephosphorylation and then ligated into the respective EcoRI sites of the vector. The clones with correct gene orientation were selected and further confirmed via sequencing. The recombinant AD, Ad-OKS, or Ad-Myc was generated, amplified, and prepared according to the manufacturer's instruction. The titer of each AD was determined with QuickTiter Adenovirus Titer Immunoassay Kit (Cell Biolabs).
MSC, TTF, and REF Culture
MSCs were isolated from the femur of three male adult Sprague–Dawley rats (Charles River, Rouen, France) according to previously published protocols (24). Briefly, the rat was anesthetized with ketamine and rompun (PanPharma, Fougeres, France), and the femur and tibia were isolated and placed into ice-cold sterile 0.1 M phosphate-buffered saline (PBS, Sigma-Aldrich). Using an 18-gauge needle, a hole was drilled in the head of the femur and tibia, and bone marrow was aspirated using a 25-gauge needle and syringe. The bone marrow was collected and placed into a sterile 15-ml Falcon tube (Corning, Corning, NY, USA) with 10 ml of MSC medium consisting of α-MEM (Life Technologies/Invitrogen, Carlsbad, CA, USA), 20% fetal bovine serum (FBS; Life Technologies), and penicillin/streptomycin (Life Technologies), and the tube was centrifuged at 375 × g for 7 min at 4°C. Cells were counted and plated at a density of 600,000 cells per cm2 in a 75-cm2 flask (Corning) containing 20 ml of MSC medium. Following 24 h of incubation at 37°C with 5% CO2, the MSC medium was aspirated and replaced with fresh MSC medium. After 7 days, MSCs were passaged following previous protocols (24). At passage 5, MSCs were used for transfection protocols.
TTFs were cultured from the tails of three male adult Sprague–Dawley rats (Charles River). Briefly, the donor rat was anesthetized with ketamine and rompun and had the tip of the tail (approximately 3 cm) removed using sterile scissors. The tail was washed twice with sterile PBS under a chemical safety hood. A lengthwise incision was made down the tail, and the superficial dermis was peeled away only leaving the inner white skin of the tail. The tail was minced into 3-mm pieces using a sterile scalpel blade and placed into 60-cm Petri dishes (Corning) that had been coated with 0.1% gelatin (Sigma-Aldrich). Then, 15 ml of fibroblast media (DMEM, 10% FBS, and 50 U and 50 mg/ml penicillin/streptomycin; Life Technologies) was added to the TTFs and incubated at 37°C for 5 days, at which point fibroblast cells were visualized migrating from the tail pieces. At day 5, the tail pieces were removed, and the TTFs were allowed to grow until 85% confluency. The TTFs were passaged between two and five times using the procedures applied to the MSCs, and these cells were then used for transfection protocols.
The iPSCs were grown on deactivated rat embryonic feeder cells (dREFs) that were derived from rat embryos at 15-day gestation. The embryos were isolated from a pregnant female rat and placed into sterile PBS and separated from their placenta and surrounding membranes with forceps. The head, visceral tissues, and gonads were removed, and the remaining tissue was transferred to a clean dish and washed twice with sterile PBS. This tissue was then minced, transferred to a 50-ml Falcon tube (Corning) containing 0.25% trypsin/ethylenediaminetetraacetic acid (EDTA) (Life Technologies), and incubated at 37°C for 20 min. The trypsin/EDTA was deactivated with equal parts of fibroblast medium, and the tissue was manually dissociated by gentle pipetting. The 50-ml tube was then left at room temperature for 5 min to allow the debris to settle, and the supernatant was transferred to a separate 50-ml Falcon tube and centrifuged at 175 × g for 5 min. Following centrifugation, the supernatant was discarded, the cells were resuspended in 1 ml of fibroblast medium, counted, and plated at 200,000 cells per cm2 in 75-cm2 flasks containing 15 ml fibroblast medium. The next day, the media was replaced, and any remaining debris or floating cells were removed. Cells were allowed to grow to 80% confluency, at which point they were passaged.
Prior to use in iPSC cultures, the rat embryonic fibroblasts were deactivated using mitomycin C. Briefly, mitomycin C (Sigma), at a final concentration of 6 μg/ml, was added directly to the culture medium and incubated at 37°C for 3 h. Following deactivation, the medium containing mitomycin C was aspirated, and the cells were rinsed twice using sterile PBS. The cells were then passaged, and 100,000 dREFs per well were plated into 12-well plates (Corning) or 500,000 dREFs per well were plated into six-well plates (Corning) and incubated at 37°C with 5% CO2 for 24 h. On the next day, the medium was replaced, removing any nonadherent cells, with the residual dREFs being used for iPSC culture within 48 h.
Transfection
TTFs and MSCs were grown in 12-well culture dishes until 90% confluent. When the cells reached 90% confluence, the culture medium was aspirated, and the cells were washed with sterile PBS. One milliliter of medium (DMEM with 10% FBS) containing either both ADs (1.44 μl/ml AD-OKS and 1.07 μl/ml AD-Myc) or the single cassette LN (0.8 μl/ml Lenti-OKSM) was added to each well and was incubated for 4 days, at which point morphological changes were observed. After 4 days of incubation, half of the virus-containing medium was aspirated and replaced with iPSC medium [DMEM, 15% FBS, 1% nonessential amino acids (Life Technologies), 0.1 μM β-mercaptoethanol (Sigma), and 50 U and 50 mg/ml penicillin/streptomycin]. This process was repeated every 48 h until the colonies were large enough to be selected (typically between 18 and 25 days). To select the colonies, the iPSC medium was removed, and 250 ml of 0.25% trypsin/EDTA was added to each well for approximately 30 s. Using a sterile pipette, each colony was selected and pipetted into a 96-well plate (Corning) containing iPSC medium. This process was repeated for each colony in the 12-well plate. The 96-well plate was centrifuged, and the colonies were resuspended in iPSC medium and transferred into a 12-well plate containing deactivated feeders.
Passage
The iPSCs were passaged every 5–6 days into a new six-well plate containing deactivated feeders. During passaging, the medium was carefully removed and discarded, and the cells were rinsed twice with sterile PBS. Then, 500 ml of 0.25% trypsin/EDTA was added to each well for 2–3 min at 37°C to allow the iPSC colonies to detach. Following incubation, the trypsin/EDTA was deactivated with equal parts FBS. The solution containing trypsin/ EDTA, FBS, and detached cells was collected in a 15-ml tube. The 15-ml tube was then centrifuged at 250 × g for 5 min at 4°C. The supernatant was discarded, the cells resuspended in 1 ml of iPSC medium, counted, and plated at a density of 1 million cells per well in a six-well plate containing dREFs. During each passage, a small number of dREFs would detach and be replated with the iPSCs. This small number of dREFs was accounted for in all in vitro analyses.
Flow Cytometry
After four passages, the iPSC colonies were analyzed via flow cytometry for markers of pluripotency. The pluripotent panel, provided by Abcam (Cambridge, UK) included Tra-1–60, stage-specific embryonic antigen 3 (SSEA3), SSEA4, Nanog, and Oct4. The preparation of iPSCs for flow cytometry followed a standard lab protocol (24). Briefly, iPSCs were plated into a 96-well plate and incubated in the primary antibody for 30 min on ice. The cells were then rinsed and incubated with the corresponding secondary fluorescent antibody (Life Technologies). Alexa Fluor 488 was used for Tra-1–60, SSEA4, and SSEA3. Alexa Fluor 568 was used for Nanog and Oct4. The data collection and analysis was performed on a Becton Dickinson Biosciences (Franklin Lakes, NJ, USA) LSRII with FACSDIVA. Approximately 10,000 cells were analyzed for each label.
Immunocytochemistry
The same pluripotent markers used for flow cytometry were also used for immunocytochemistry. The cells were grown on poly-l-ornithine-coated, 20-mm glass coverslips (Sigma) for 4 days. The cells were then fixed using 4% paraformaldehyde (Sigma) for 10 min at 4°C and analyzed within 48 h. Then, the coverslips were placed in a blocking solution containing 0.1% Triton X-100 (Life Technologies) and 10% normal goat serum (Jackson ImmunoResearch, West Grove, PA, USA) in PBS for 1 h. The blocking solution was then aspirated, and the primary antibodies were added according to the manufacturer's (AbCam) recommended dilution in 0.1% Triton X-100 and PBS. A double labeling was performed with rat SSEA3-mouse SSEA4 and mouse Tra-1–60-rabbit Nanog. Rabbit Oct4 was analyzed using single labeling. The primary antibodies were incubated at 4°C overnight. The primary antibodies were then aspirated, and the coverslips were rinsed three times. Secondary antibodies were then added according to the manufacturer's recommended dilutions. The SSEA3 and Tra-1–60 were labeled with Alexa Fluor 488-conjugated secondary antibodies (Invitrogen), and the SSEA4, Nanog, and Oct4 were labeled with Alexa Fluor 568-conjugated secondary antibodies (Invitrogen). The coverslips were incubated with the secondary antibodies at room temperature for 1 h. The secondary antibody was then aspirated, and the coverslips were rinsed three times. For cellular localization, Hoechst 33258 (Sigma) was added to each coverslip at a dilution of 1:1,000 for 5 min at room temperature. The Hoechst was then aspirated, the coverslips rinsed three times, and then the coverslips were mounted onto glass slides using Prolong Gold Antifade reagent (Invitrogen). Imaging was done using a Zeiss Axioskop 2 plus and analyzed using Axiovision 4.7 (Zeiss, Oberkochen, Germany). Images were taken at 20× magnification from at least 12 locations per coverslip. Exposure time for each secondary antibody (Hoechst, 488 and 594) was held constant for each label examined across all groups.
In Vitro Differentiation
The TTF-AD, TTF-LN, MSC-AD, and MSC-LN iPSCs were differentiated into neuronal lineages, using a modified neural rosette protocol (28). Briefly, iPSCs were plated into a six-well plate at a density of 415 cells per ml2. Cells were allowed to adhere to the plastic and expand over 48 h in iPSC medium. After 48 h, iPSC medium was removed and replaced with neural induction medium [DMEM/F12 supplemented with 5% B27, 5% MEM nonessential amino acids, and 1 mg/ml heparin (Life Technologies)]. Half of the medium was replaced with fresh neural induction medium every 3 to 4 days. Differentiated iPSCs were visualized using ICC for neuronal marker neural cell adhesion molecule (NCAM) and neural progenitor marker nestin (Abcam; both at 1:500) using either Alexa Fluor 488- or Alexa Fluor 594-conjugated secondary antibodies (Invitrogen).
Quantitative RT-PCR
The iPSCs were also analyzed in vitro using quantitative RT-PCR to delineate levels of pluripotency. RNA isolation followed the protocol of Ohnuki et al. (33). Briefly, RNA from each cell line was isolated using Trizol (Invitrogen) and purified with the RNeasy kit (Qiagen, Hilden, Germany). The cDNA was synthesized using QuantiTect Reverse Transcription Kit (Qiagen). Primers consisted of pluripotent markers Oct4, Sox2, Klf4, and c-Myc (Integrated DNA Technologies, Coralville, IA, USA). The RNA and cDNA quantity was measured using a NanoDrop 2000 (Thermo Scientific, Waltham, MA, USA). Analyses of transcripts were performed by quantitative PCR using 2× QuantiTect SYBR Green RT-PCR Master Mix (Qiagen). The glyceraldehyde 3-phosphate dehydrogenase gene (GAPDH) was used as an endogenous control gene. Primers consisted of Oct4, Sox2, Klf4, and c-Myc (Table 1). Quantitative-PCR was performed on MyiQ (BioRad, Hercules, CA, USA), using the following cycling conditions: 10 min at 95°C, then 40 cycles of 10 s at 95°C, 10 s at 50°C, and 30 s at 72°C; a melt curve analysis was run starting at 65°C for 10 s, then increased by 1°C for 10 s and repeated 30 times to an end temperature of 95°C. The PCR products melt curves were analyzed and then were resolved on agarose gels and visualized with ethidium bromide (both Sigma). The fold change of each iPSC lineage was calculated using the ΔΔCT normalizing the cycle threshold of each primer pair to GAPDH and then comparing this value to the normalized cycle threshold of the TTFs.
Primer Sequences for Quantitative RT-PCR
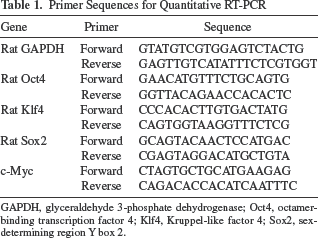
GAPDH, glyceraldehyde 3-phosphate dehydrogenase; Oct4, octamer-binding transcription factor 4; Klf4, Kruppel-like factor 4; Sox2, sex-determining region Y box 2.
Transplantation
Thirty-two adult male Sprague–Dawley rats (Charles River) weighing between 250 and 275 g were used in this study. Twenty rats were unilaterally transplanted with 400,000 adenovirus-generated iPSCs, derived from TTFs (TTF-AD) and suspended in Hank's balanced salt solution (Life Technologies). These iPSCs had been passaged 15–20 times. In addition, 12 rats were injected with 400,000 dREFs. The iPSCs were used at passages 15–20, as previous studies have shown that epigenomic reprogramming is typically incomplete at early passages following derivation (26,40). Briefly, animals were anesthetized by intraperitoneal injection of ketamine and rompun, had their heads shaved, and were placed into a stereotaxic device (David Kopf Instruments, Tujunga, CA, USA). A single burr hole was drilled 0.7 mm anterior and −2.8 mm lateral to bregma. A Hamilton syringe (Reno, NV, USA) was loaded with 400,000 iPSCs or dREFs at a concentration of 200,000 cells per μl. The Hamilton syringe was slowly lowered to −6.0 mm ventral compared to bregma, and the cells and vehicle were injected at 0.8 μl per minute. Following injection, the syringe was left in place for 2 min, then raised to −5.6 mm from bregma, and a second injection of 1 μl of cells was performed using the same procedure. At the conclusion of injections (a total of 400,000 cells), the Hamilton syringe was left in place for 3 min, and then slowly retracted, and the incision was sutured (Premocron, Tuttlingen, Germany). The rats were monitored daily for weight gain, signs of infection, and atypical behaviors.
Perfusion, Slicing, Immunohistochemistry, Imaging
At 5, 21, 63, and 90 days following transplantation, five rats transplanted with iPSCs and three rats transplanted with dREFs were randomly selected and overdosed with ketamine and rompun and intracardially perfused with ice-cold PBS, followed by 4% paraformaldehyde. Their brains were then carefully removed and placed into 4% paraformaldehyde for 24 h at 4°C, prior to being transferred into 30% sucrose (Sigma) for 48 h at 4°C. The brains were then flash frozen using methylbutane (Sigma) and stored at −80°C prior to sectioning at 16 μm on a cryostat (CM3050, Leica, Buffalo Grove, IL, USA) (38). The tissue sections were then mounted on pig gelatin-coated slides (Sigma) and processed using double fluorescent immunohistochemistry. Nonspecific binding sites were blocked by incubating the tissue in 10% normal goat serum, 0.1% Triton X-100, and PBS for 1 h at room temperature. The tissue was then incubated in primary antibody (1:500 dilution in PBS and 0.1% Triton X-100) overnight at 4°C. Primary antibodies from Abcam included anti-rat cluster of differentiation 11b (CD11b; activated microglia), anti-mouse ionized calcium-binding adapter molecule 1 (IBA1; macrophages), anti-rabbit glial fibrillary acidic protein (GFAP; astrocytes), anti-mouse neuronal nuclei (NeuN; mature neurons), and anti-rabbit dopamine- and cyclic-AMP-regulated phosphoprotein of 32 kDA (DARPP-32; medium spiny neurons of the striatum). The tissue was then rinsed and incubated at room temperature for 1 h with the appropriate secondary antibody. Secondary antibodies consisted of Alexa Fluor 488 and Alexa Fluor 594 (Invitrogen).
Fluorescent images were captured using a Zeiss Axiovert 200M at 20× magnification, and confocal immunfluorescent images were captured using a Nikon Eclipse Ti A1R with a 40× oil objective. Images were analyzed using ImageJ (NIH, Bethesda, MD, USA). Images of the transplanted cells were captured from seven sections of each animal, starting at 0.7 mm anterior to bregma and three sections, approximately 200 μm apart, anterior and posterior to the transplant site. Average intensity of the label, counts of positively labeled cells, as well as percent of colocalization between the transplanted iPSCs and NeuN or DARPP-32 was analyzed between all groups using ImageJ. Densitometric measures were taken from images taken in the striatum, and the average intensities were normalized to the contralateral hemisphere. Cells were counted as positive cells if they showed (1) antibody immunoreactivity within the cell body, (2) the nucleus of that cell was within the counting frame without touching the exclusion lines, and (3) the nucleus of that cell was in focus.
Statistical Analysis
All statistics were analyzed using SPSS v16.0 (IBM, Armonk, NY, USA). Multivariate analysis of variance (ANOVA) was used to analyze all data, except for the PCR measures comparing cell source and reprogramming methods, in which a univariate ANOVA was utilized. Protected least significant differences post hoc (PLSD) analyses were performed when appropriate. In all analyses, the significance was established at p lt; 0.05.
Results
iPSC Generation
It was observed that iPSC colonies could be generated with TTFs and MSCs with either the single cassette LN or the combination of ADs. All transfection conditions displayed typical iPSC colony morphology and were readily expanded once placed onto deactivated feeder cells (Fig. 1). Transfection efficiency was similar between reprogramming method. However, it was observed that MSCs more readily formed typical iPSC colonies than TTFs (Table 2). An average of 0.011% of MSCs was reprogrammed into iPSC-like colonies after exposure to either the AD pair or the single cassette LN. An average of 0.006% of TTFs was reprogrammed into iPSC-like colonies after exposure to either the AD pair or the single cassette LN. It is not surprising that MSCs displayed a higher reprogramming efficiency, as it has been previously found that adult stem cells are more readily converted to iPSCs than are cells that are further differentiated in the same specimen (43). These present findings indicate that both the ADs and the LN are capable of inducing iPSC-like colonies at a similar efficiency. While it should be noted that reported efficiencies can vary between studies due to the various criteria used for delineating iPSC colonies and whether the initial number of starting cells or the amount of proliferated cells are used in the calculation (18). Despite this variability, the efficiencies observed in this study are similar to those previously published [for review, see Zhang et al. (47)].
Reprogramming Efficiencies of iPSCs

The efficiency of reprogramming methods was determined by dividing the total number of iPSC colonies observed per well at 20 days posttransfection to the total number of starting cells. MSC-AD, mesenchymal stem cell-adenovirus; LN, lentivirus; TTF, tail-tip fibroblast.
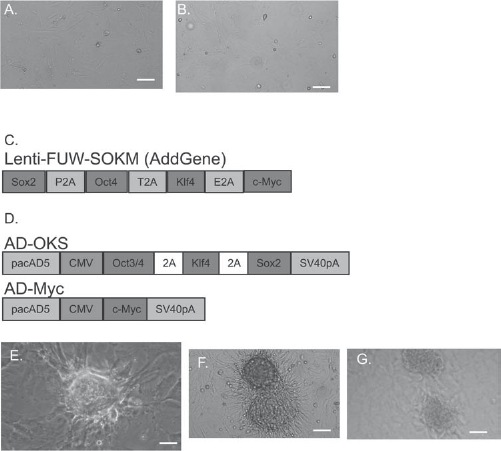
iPSC induction. Both MSCs (A) and TTFs (B) were reprogrammed using either a single cassette LN (C) or a combination of ADs (D). All conditions reliably created induced pluripotent stem cell (iPSC) colonies (E) that were expanded on deactivated feeder cells (F; TTF-AD and G; TTF-LN). (A, B, F, and G) are imaged at 10×; scale bar: 100 μm. (E) Imaged at 20×; scale bar: 50 μm. AD, adenovirus; LT, lentivirus; Sox2, sex-determining region Y box 2; P2A, porcine teschovirus-1 self-cleaving 2A peptide; Oct4, octamer-binding transcription factor 4; T2A, Thosea asigna virus self-cleaving 2A peptide; Klf4, Kruppel-like factor 4; E2A, equine rhinitis A virus self-cleaving 2A peptide; CMV, cytomegalovirus; SV40pA, simian virus 40 polyadenylation signal.
iPSC Characterization
All iPSCs generated for this study displayed an upregulation of pluripotent markers as assessed by immunocytochemistry, flow cytometry, and quantitative RT-PCR. Immunocytochemistry revealed that all lineages of iPSCs (TTF–AD, TTF–LN, MSC–AD, and MSC–LN) displayed typical morphology of pluripotent cells and were positive for markers SSEA3, SSEA4, TRA-1–60, Nanog, and Oct4 (Fig. 2). No observable differences were noted between the four lineages of iPSCs that were analyzed. Also, TTFs, MSCs, or dREFs did not show positive expression of the pluripotent markers (data not shown). Flow cytometry revealed that both TTFs and MSCs had an upregulation of pluripotent markers following reprogramming, irrespective of whether they were generated via lentiviral or adenoviral approaches (Fig. 3). All lineages displayed upregulation of SSEA4, Tra-1–60, Nanog, and Oct4 when compared to the source cells (TTFs or MSCs) and to the feeder cells (dREFs). There was no observable difference between lentiviral or adenoviral reprogramming methods. However, TTFs, regardless of reprogramming method, displayed a higher expression of pluripotent markers when compared to MSCs. While MSCs appeared to form iPSC colonies at a higher rate, the colonies generated from TTFs appear to be more efficiently reprogrammed.

Immunocytochemistry of iPSCs. Immunocytochemistry (ICC) revealed that TTFs reprogrammed with ADs expressed pluripotent makers TRA-1–60 (A), Nanog (B), stage-specific embryonic antigen 3 (SSEA3) (D), SSEA4 (E), and Oct4 (G). TTFs reprogrammed with a LN also expressed pluripotent markers TRA-1–60 (K), Nanog (L), SSEA3 (N), SSEA4 (O), and Oct4 (I). Merged images are displayed in (C, F, H, J, M, and P). MSC-AD and MSC-LN displayed similar expression of pluripotent markers (data not shown), while TTF, MSC, or dREFs did not express pluripotent markers. All images were taken at 20×; scale bar: 50 μm.

Flow cytometry data of iPSCs. Flow cytometry data revealed that all iPSC lineages displayed an upregulation of pluripotent markers SSEA4, TRA-1–60, Nanog, and Oct4 compared to both starting cell types (MSC and TTF) as well as dREFs.
Quantitative RT-PCR revealed that all of the generated lineages of iPSCs expressed an upregulation of pluripotent genes. However, changes of expression were apparent between cell source and reprogramming method (Fig. 4). It was observed that the upregulation of the reprogramming genes was consistent between MSCs and TTFs, when the LN was used. This may be due to the integrative nature of the LN and the forced expression of the reprogramming genes. It was observed in the adenoviral-reprogramming condition that expression levels were higher for Oct4, Klf4, and c-Myc in the reprogrammed TTFs compared to those in MSCs, indicating that the cell source is important when reprogramming with adenoviruses. A significant effect of the reprogramming method was observed for the pluripotent genes Oct4 [F(3, 11) = 132.99, p lt; 0.001] (Fig. 4A), Klf4 [F(3, 11) = 1199.322, p lt; 0.001] (Fig. 4B), and c-Myc [F(3, 11) = 582.45, p lt; 0.001] (Fig. 4D), with AD-generated iPSCs displaying greater fold increases than lentiviral-generated iPSCs.

Quantitative RT-PCR of iPSCs. Quantitative RT-PCR revealed that all iPSCs generated had an upregulation of genes responsible for regulating pluripotency. It appears that Oct4 (A), Klf4 (B), and c-Myc (D) expression is dependent on the reprogramming method employed and that adenoviral reprogramming produced greater increases, regardless of cell source. It should be noted that Klf4 (B) and Sox2 (C) were dependent on the starting cell source with TTF producing greater increases for Klf4 and MSCs produced greater increases for Sox2. *Significant difference between LN and AD. #Significant source difference. Bar graph represents mean value; error bars represent SEM.
However, it should be noted that the starting cell source also had a significant effect on Klf4 expression, with TTFs displaying the highest expression of Klf4 [F(3, 11) = 1087.26, p lt; 0.001]. A significant interaction was observed for the pluripotent gene Sox2 [F(3, 11) = 6.959, p lt; 0.05], with MSC-generated iPSCs producing a greater increase of Sox2 when compared to TTF-generated iPSCs (Fig. 4C). Also, a significant effect on the reprogramming method was observed for Sox2 [F(3, 11) = 15.35, p lt; 0.01], with AD-generated iPSCs producing a larger increase (Fig. 4C). Lastly, a significant interaction of cell source and reprogramming method was observed for the expression of c-Myc [F(3, 11) = 582.45, p lt; 0.001], with TTFs and AD-generated iPSCs yielding greater increases than MSC or lentiviral-generated iPSCs (Fig. 4D). These findings demonstrate the importance of the cell source, as well as the type of reprogramming method that is employed for producing highly pluripotent cells.
Adenoviral transfection was capable of activating pluripotent genes in both MSCs and TTFs in a manner similar to lentiviral reprogramming for the genes Klf4 and Sox2. This approach yielded greater increases for the genes Oct4 and c-Myc, suggesting that endogenous activation of pluripotent genes is dependent on reprogramming methods. It was observed that the expression of pluripotent genes was more consistent between lines of LN-generated iPSCs, regardless of the cell source, suggesting their expression was forced. Given that with TTFs being more readily converted to iPSCs, it is apparent that the cell source has an impact on reprogramming when the AD pair is used. Taken together, quantitative RT-PCR suggests that TTFs are a more desirable cell source for reprogramming into iPSCs, and adenoviral transfection is comparable, if not more effective, than lentiviral transfection for the generation of iPSCs.
In Vitro Differentiation of iPSCs
Immunocytochemistry revealed that all lineages of iPSCs (TTF–AD, TTF–LN, MSC–AD, and MSC–LN) differentiated into neuronal-like cells. During differentiation, iPSCs changed from a colony formation into cells that displayed a neuronal-like morphology. These neuronal-like cells were positive for neuronal (NCAM) and neural progenitor (nestin) cell markers (Fig. 5). No between-group differences were observed in the percent of differentiated iPSCs that were positive for NCAM [F(3,33) = 1.578, p > 0.05]. However, a significant between-group difference was observed in the percent of differentiated iPSCs that were positive for nestin [F(3,33) = 3.321, p lt; 0.05]. Protected least significant difference (PLSD) analyses revealed that the TTF–AD lineage displayed significantly less colocalization with nestin than both the MSC–LN and TTF–LN lineages (Fig. 5Q). The lower expression of nestin in the TTF–AD group may be indicative of these cells shifting from a progenitor state to a more fully differentiated state than the other differentiated iPSCs. These data show that all of the generated iPSC colonies were capable of differentiating into neuronal-like cells, regardless of starting cell source or reprogramming method.

Immunocytochemistry of in vitro differentiation of MSCs or TTF iPSCs from AD or LN transfection into neural rosettes. All lineages of iPSCs were capable of differentiating into neuronal precursor cells. Colocalization between iPSCs (blue) and NCAM (green) was observed for all lineages of iPSCs, indicating differentiation into neuronal phenotypes. Some iPSC lineages also displayed colocalization with nestin (red) a marker of immature neural development. (A–D) MSC–LN, (E–H) MSC–AD, (I–L) TTF–LN, (M–P) TTF–AD. All images were taken at 20×; scale bar: 50 μm. Bar graph (Q) represents mean value; error bars represent SEM.
Transplantation of iPSCs: Survival and Differentiation
Based on the in vitro analysis, it was determined that TTF–AD iPSCs would be the best choice for our transplantation work. The TTF–AD iPSCs were chosen because of their nonintegrative nature, their consistently high levels of pluripotency (as measured by ICC, flow cytometry, and quantitative RT-PCR), and their ability to readily differentiate into neuronal lineages in vitro. Following intrastriatal transplantation in the rat, the TTF–AD iPSCs were capable of surviving up to 90 days (Fig. 6M). A significant difference between iPSC- and dREF-transplanted rats was observed in the optical densitometric measures for macrophages, detected by IBA1 [F(7,141) = 6.500, p lt; 0.01], with the highest expression in the 21-day iPSC transplant group (Fig. 6R). A significant between-group difference was also observed in the optical densitometry for the activated microglia marker, CD11b [F(7,141) = 3.435, p lt; 0.01] with the iPSC group showing the highest densities at 5 and 21days posttransplantation (Fig. 6S). These data suggest that iPSCs derived from TTFs and reprogrammed with ADs are capable of surviving in the brain of a healthy, adult rat for up to 90 days and that the upregulation of both IBA1 and CD11b at 21 days posttransplantation suggests an immune response from the host that dissipates over time.
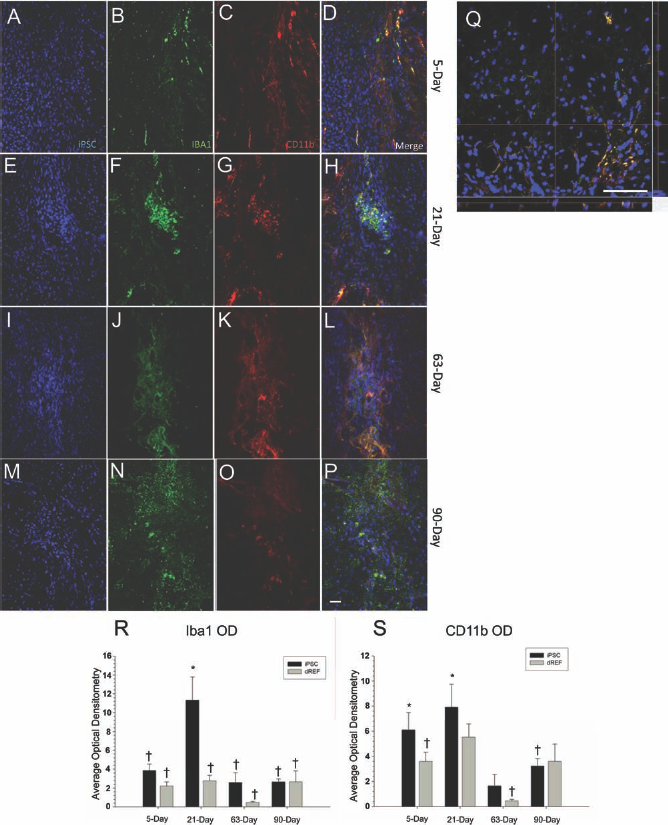
Immune response to transplanted iPSCs. Activated microglia [ionized calcium-binding adapter molecule 1 (IBA1); red] and macrophages [cluster of differentiation 11b (CD11b); green] were present at the site of iPSC (blue) transplantation. IBA1 expression was significantly upregulated 21 days following iPSC transplantation, but significantly decreased over time, suggesting a tolerance to the cell transplantation (R). CD11b expression was downregulated between 21 and 63 days in the iPSC-transplanted rats (S). (A–D) Five-day survival; (E–H) 21-day survival; (I–L) 63-day survival; (M–P) 90-day survival. (A–P) taken at 20×; (Q) 40× confocal image from 21-day survival group (the time point in which the greatest immune response was observed). Scale bar: 50 μm. *Significant from 63-day dREF. †Significant from 21-day iPSC group. Bar graph represents mean value; error bars represent SEM.
Albeit, not in neural transplantations, other groups have shown that terminally differentiated cells, developed from iPSCs, elicit a limited immune response when subcutaneous injections, skin grafts, or bone marrow transplantation was performed (2). It can be speculated that the early inflammatory response observed in this study was caused by the innate cell immunity and that this response may be adaptive in nature, thus leading to tolerance induction of the graft (6).
A significant between-group difference was observed in the optical densitometric measures for GFAP [F(7,175) = 7.096, p lt; 0.01], with the 5-day and, especially, the 21-day iPSC groups having the highest measures of GFAP (Fig. 7N). The GFAP response was localized to the needle tract in both the iPSC and dREF transplant groups, and this decreased after 21 days, suggesting that the astrocyte activation may be due to the surgical procedure, rather than a specific reaction to the transplanted cells. Very little GFAP was observed within the transplant of either cell type, suggesting that there was no astrocyte infiltration within the transplanted cells. Colocalization was also analyzed for GFAP and the transplanted iPSCs or dREF with less than 1% of the cells showing any colocalization (data not shown), suggesting that the transplanted cells did not differentiate into glial phenotypes.
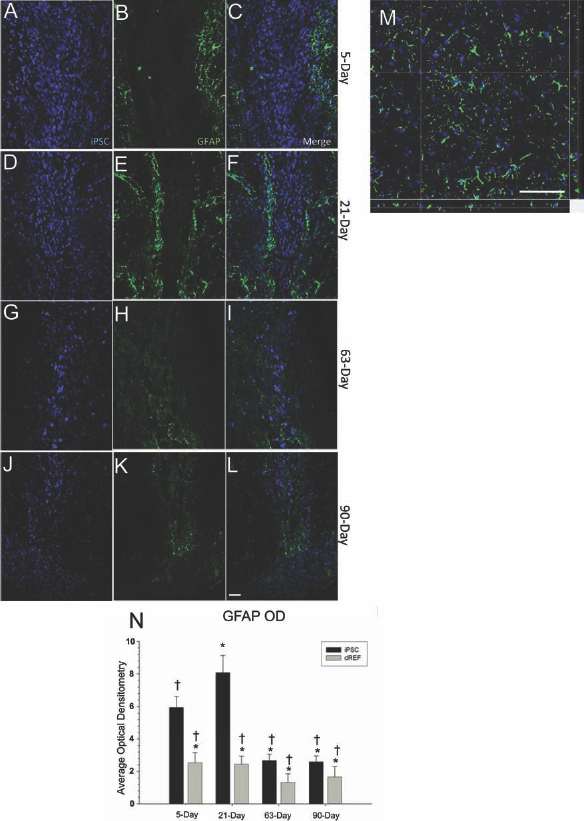
Astrocyte activation to the transplanted iPSCs. Astrocytes [glial fibrillary acidic protein (GFAP); green] were present around the needle track following transplantation of iPSCs (blue). An upregulation of GFAP was observed at 21 days (N) but decreased at 63 and 90 days. (A–C) Five-day survival; (D–F) 21-day survival; (F–I) 63-day survival; (J–L) 90-day survival. (A–L) taken at 20×; (M) 40× confocal image from 21-day survival group (the time point in which the greatest astrocytic density was observed). Scale bar: 50 μm. *Significant from 5-day iPSC. +Significant from 21-day iPSC group. Bar graph represents mean value; error bars represent SEM.
No significant differences were observed between groups for the number of cells at each transplant site [F(7,111) = 1.845, p = 0.086] (Fig. 8R). Although an immune response of activated microglia (CD11b), macrophages (IBA1), and astrocytes (GFAP) were present around the transplantation site, the transplanted cells (both iPSC and dREF) survived for the entire 90-day study in the brains of healthy, adult rats. It should be noted that pluripotent cells can survive in the absence of immunosuppressants following heart transplantation in mice (32) or bone marrow transplantation in rats (12). Although both iPSCs and dREFs had similar survival rates in the present study, there were significant between-group differences in the percentage of transplanted cells that colocalized with the mature neuron marker, NeuN [F(7,111) = 16.321, p lt; 0.001] (Fig. 8S) and the medium spiny marker, DARPP-32 [F(7,111) = 9.342, p lt; 0.001] (Fig. 8T). The iPSCs colocalized with NeuN significantly more than did the dREFs at all time points, except for those in the 63-day transplantation group. Similarly, more iPSCs colocalized with DARPP-32 than did dREFs at all time points, suggesting that the transplanted iPSCs can differentiate into regionspecific cells.
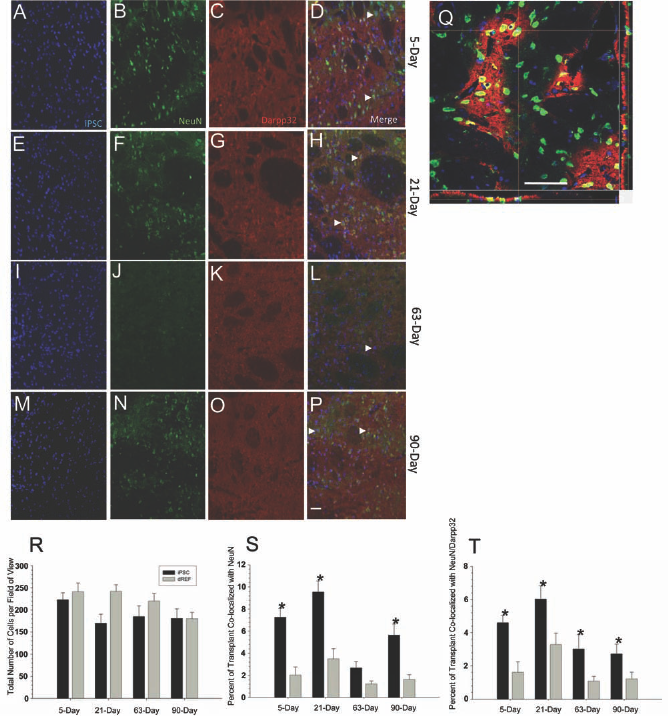
Neuronal differentiation of transplanted iPSCs. Transplanted iPSCs (blue) displayed colocalization (white arrowheads) with a mature neuronal marker (NeuN; green) and a specific medium spiny neuron marker (Darpp32; red) within the striatum of healthy rats. No significant differences were observed in the number of surviving cells at any time point between iPSC or dREF transplants (R). Transplanted iPSCs displayed significantly more colocalization with NeuN than their dREF counterparts at all time points, except for those at 63 days (S). However, transplanted iPSCs had significantly more colocalization with Darpp32 than did their dREF counterparts at all time points (T). (A–D) Five-day survival; (E–H) 21-day survival; (I–L) 63-day survival; (M–P) 90-day survival (S). (A–P) taken at 20×; (Q) 40× confocal image from 21-day survival group (the time point in which the greatest amount of iPSC colocalization was observed). Scale bar: 50 μm. *Significant from corresponding dREFs. Bar graph represents mean value; error bars represent SEM.
Discussion
The present study compared iPSCs derived from MSCs and TTFs generated using either a single cassette LN or a combination of ADs. All reprogrammed cells showed expression of pluripotent markers SSEA3, SSEA4, Tra-1–60, Nanog, and Oct4 by flow cytometry and immunocytochemistry. Quantitative PCR revealed that TTFs reprogrammed with the novel adenoviral combination created for this study expressed the highest overall expression of pluripotent genes, relative to the other iPSC lineages tested in this study, suggesting that these cells may possess more pluripotency. Adenoviral transfection of somatic cells may hold more clinical relevance for therapeutic interventions, due to the fact that the viral constructs are not integrated into the genome. The observed survival, absence of tumors, and neuronal differentiation into highly region-specific cells suggest that AD-generated TTF iPSCs may provide a safe and viable alternative to ES cells and MSCs for therapeutic treatment of CNS disorders.
While it has been suggested that iPSCs may be hypoimmunogenic when transplanted into other organs of the body (2,6,36), the degree of immunogenicity of iPSCs when transplanted into the brain is still unknown. The present study provides new evidence concerning the degree of immunogenicity of transplanted iPSCs in the brain. While an inflammatory response, in the form of activated microglia, macrophages, and astrocytes, was observed around the transplantation site, long-term survival of the transplanted iPSCs was also observed, suggesting that the host immune system developed some tolerance to at least a large subset of the transplanted iPSCs. However, the degree to which iPSCs are immunologically privileged may be highly dependent on a continuum of factors, including the timing, location, and health of the host brain (36). Nonetheless, the ability of the transplanted iPSCs to differentiate into region-specific neurons, in the presence of the immune response, suggests that these cells also may be sufficiently robust to survive and differentiate when transplanted into a host brain that is compromised by damage or disease.
While the intact striatum may not provide the ideal environment for studying the efficacy of the transplanted cells (23), this study provides proof-of-principle that iPSCs derived in this manner can survive and differentiate into mature neuronal phenotypes in vivo. Preliminary findings from our lab suggest that these iPSCs are at least as therapeutically efficacious in a rat model of Huntington's disease as in the healthy rat striatum (13). In addition to this study, our lab has transplanted the TTF AD-generated iPSCs into the brain of over 100 rats. Although only gross morphological changes (i.e., cresyl violet and cytochrome oxidase) are being examined, no aberrant cell growth or cell masses have been observed, suggesting that these cells do not form teratomas following transplantation into the brains of either healthy wild-type or rodents with the HD transgene.
In summary, this study demonstrates that the use of iPSCs mitigates many of the issues that arise with the use of ESCs. The four lineages of iPSCs that were generated in this study all displayed characteristics of pluripotent cells, were easily isolated from nonembryonic tissue, and were easily expandable in vitro. In addition, no tumors were observed after transplantation into immune-competent brain, suggesting that adenoviral-generated iPSCs could be safe for transplantation. Finally, the finding that iPSCs differentiated into region-specific neurons helps to validate their use as a potential cell replacement strategy for damage or disease to the central nervous system.
Footnotes
Acknowledgments
Support for this project was provided by a Partner University Fund grant (Chateaubriand fellowship from the Embassy of France in the US to K.D.F.), INSERM U643 (to K.D.F. and L.L.), and funding from the John G. Kulhavi Professorship and Field Neurosciences Institute (to G.L.D.). The authors declare no conflicts of interest.