
Abstract
Although several types of somatic cells have been reprogrammed into induced pluripotent stem cells (iPSCs) and then differentiated to hepatocyte-like cells (iHeps), the method for generating such cells from renal tubular epithelial cells shed in human urine and transplanting them into animal livers has not been described systematically. We report reprogramming of human urinary epithelial cells into iPSCs and subsequent hepatic differentiation, followed by a detailed characterization of the newly generated iHeps. The epithelial cells were reprogrammed into iPSCs by delivering the pluripotency factors OCT3/4, SOX2, KLF4, and MYC using methods that do not involve transgene integration, such as nucleofection of episomal (oriP/EBNA-1) plasmids or infection with recombinant Sendai viruses. After characterization of stable iPSC lines, a three-step differentiation toward hepatocytes was performed. The iHeps expressed a large number of hepatocyte-preferred genes, including nuclear receptors that regulate genes involved in cholesterol homeostasis, bile acid transport, and detoxification. MicroRNA profile of the iHeps largely paralleled that of primary human hepatocytes. The iHeps engrafted into the livers of Scid mice transgenic for mutant human SERPINA1 after intrasplenic injection. Thus, urine is a readily available source for generating human iHeps that could be potentially useful for disease modeling, pharmacological development, and regenerative medicine.
Introduction
Directed differentiation of pluripotent stem cells into chosen cell lineages offers great promises for disease modeling, drug discovery, and evaluation, as well as cell-based therapies of various diseases (6,10). Advances in generating human induced pluripotent stem cells (iPSCs) from somatic cells by transient expression of reprogramming factors have provided new opportunities to generate patient-specific cell types of various lineages (5,19,24,29). Many different types of somatic cells have been used for reprogramming into iPSCs. Skin fibroblasts are most commonly used for this purpose, but keratinocytes, peripheral blood cells, adipose-derived stem cells (ADSCs), amniotic cells, and cord blood endothelial cells have been also used as the starting cells (1,8,13,14,23,25,26). As isolating such somatic cells involves minimally invasive procedures, investigators explored other sources for somatic cells that can be accessed noninvasively.
Recently, Zhou et al. successfully reprogrammed epithelial cells shed in the urine into iPSCs (30). Evaluation of marker proteins indicated that these cells are exfoliated tubular epithelial cells. Normally, approximately 2,000 to 7,000 cells are detached from the human renal tubular system and shed daily in the urine (31). The cell culture technique is simple and has been used successfully in subjects of all ages and both genders. The round and elongated cell types that emerge after culturing the cells are similar in gene expression profile (16,30,31). These observations make these cells attractive for reprogramming into iPSCs.
We used a modification of our previously reported protocol to differentiate the iPSCs sequentially to definitive endoderm (DE), hepatic progenitor cells, and finally to hepatocyte-like cells (iHeps) (2). The iHeps exhibited the polygonal morphology characteristic of human hepatocytes, including the presence of two nuclei in some of the cells (3,9,21). In addition, the iHeps expressed hepatocyte-preferred genes and miRNAs to various extents and exhibited several hepatocyte-specific functions, such as glycogen storage, indocyanin green uptake, urea synthesis, and albumin secretion.
To our knowledge, this is the first detailed characterization of iHeps originating from renal tubular epithelial cells, isolated from human urine.
Materials and Methods
Collection and Cultivation of Urinary Epithelial Cells
The urinary epithelial cells were collected and cultured as previously described (30,31). Briefly, 250-500 ml of freshly donated, midstream urine was collected in sterile containers, and the cells were pelleted by centrifuged at 400
Generation and Cultivation of Human iPSCs
The human urinary epithelial cells were reprogrammed by nucleofection of episomal expression vectors pCXLE-hOCT3/4-shp53-F (27077), pCXLE-hSK (27078), and pCXLE-hUL (27080) (Addgene, Cambridge, MA, USA) using the Amaxa Basic Nucleofector Kit for primary mammalian epithelial cells (VPI-1005; Lonza) as described by Okita et al. (15). Briefly, 1 × 10 6 urinary cells were resuspended in 100 μl of supplemented nucleofector solution. One microgram of each episomal expression vector was added to the cell suspension and immediately transferred into a cuvette to run the nucleofection program T-013 of the nucleofector device (Lonza). After nucleofection, the cells were resuspended in 500 μl of UCM and transferred onto two wells of a Matrigel (BD Biosciences, San Diego, CA, USA)-coated six-well plate (Thermo Fisher Scientific, Waltham, MA, USA).
Our second strategy for reprogramming urinary epithelial cells was based on transferring the four Yamanaka reprogramming factors [octamer-binding transcription factor 4 (Oct3/4), sex-determining region Y (SRY)-box 2 (Sox2), Kruppel-like factor 4 (Klf4), and v-myc avian myelocytomatosis viral oncogene homolog (c-Myc)] using replication-defective recombinant Sendai viral vectors (CytoTune-iPS Reprogramming Kit; No. A13780-01; Invitrogen, Thermo Fisher Scientific). One million urinary epithelial cells were plated on two wells of a six-well plate. On day 1, the four kit components were added to 1 ml of UCM and transferred to one well containing the urinary epithelial cells. The next day, the medium was replaced with fresh UCM. The cells were cultured for the next 6 days, changing the medium every other day with UCM, before replating onto a six-well plate precoated with Matrigel (BD Biosciences). After 24 h, the UCM was changed to mTeSR iPSC medium (Stem Cell Technologies, Cambridge, MA, USA). Both plates were observed every day for the emergence of characteristic cell clumps or colonies. The colonies were counted 12 to 28 days after transduction. iPSCs were harvested and maintained on Matrigel-coated plates in mTeSR cell culture medium and dissociated with 1 U/ml of dispase (Stem Cell Technologies) into small clusters and subcultured every 4 to 6 days.
Characterization of Human iPSCs
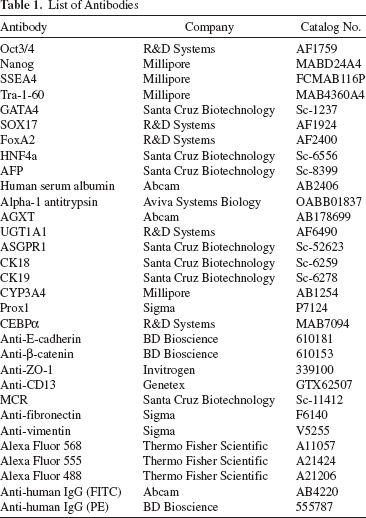
Expression of Oct3/4, Nanog, TRA-1-60, and SSEA4 was verified by immunofluorescence staining using corresponding antibodies (Table 1). To evaluate spontaneous differentiation to the three germ layers in vivo, 1 × 10 6 iPSCs were injected subcutaneously into the neck of immunodeficient NOD/Scid mice (Jackson Laboratory, Bar Harbor, ME, USA) or beneath the kidney capsule as described (http://www.stembook.org/node/723). Tumors appeared in 8 to 10 weeks after injection. After excision, the tumors were fixed, embedded in paraffin, and sections were stained with hematoxylin and eosin (H&E; Sigma-Aldrich). All animal experiments were performed with the approval of the Institutional Animal Care and Use Committee (IACUC) of Albert Einstein College of Medicine and were within the guidelines for humane care of laboratory animals of Albert Einstein College of Medicine.
List of Antibodies
Karyotyping
The iPSCs, grown in Matrigel-coated dishes, were synchronized using 0.1 μg/ml of Colcemid solution (Invitrogen). After fixation with fresh methyl alcohol/glacial acetic acid (3:1; Sigma-Aldrich), a small quantity of the cells was spread onto 10 slides. Chromosomes were examined, counted by phase-contrast microscopy, and photographed (200×).
Differentiation of Human Urinary Epithelial Cell-Derived iPSCs Into iHeps
Stepwise-directed differentiation of the iPSCs into iHeps was achieved by a modification of the method reported previously (2). Briefly, 1 to 5 × 10 4 UiPSCs at a passage number of 20–30 were plated onto six-well plates precoated with Matrigel (BD Biosciences). The next day, UiPSCs were seen as small colonies with ~60% confluence. The medium was changed to DMEM/F12 enriched with 100 ng/ml recombinant Activin A (PeproTech, Rocky Hill, NJ, USA), 100 ng/ml fibroblast growth factor-2 (FGF2; PeproTech) plus 50 ng/ml recombinant human Wnt3a (R&D Systems, Minneapolis, MN, USA) and was maintained for the next 3 days. Concentrations of KnockOut SR Xenofree medium (KSR; Life Technologies) was 0%, 0.2%, and 2.0% for the first, second, and final 24 h, respectively. For the next 8 days, cells were cultivated in DMEM/F12 supplemented with 10% KSR, 1 mM NEAA, 1 mM L-glutamine, 1% dimethyl sulfoxide (DMSO; Sigma-Aldrich), and 100 ng/ml hepatocyte growth factor (HGF; PeproTech). Cells were then grown for 3 days in 10% KSR, 1 mmol/L NEAA, 1 mM L-glutamine, and 10−7 mol/L dexamethasone (Sigma-Aldrich).
Immunocytochemistry
Cells were fixed with freshly prepared 4% paraform-aldehyde (PFA; Wako, Richmond, VA, USA) for 30 min, washed with PBS, and permeabilized with 0.5% Triton X-100 (Thermo Fisher Scientific) in PBS for 15 min. Cells were then blocked with 3% bovine serum albumin (BSA; Sigma-Aldrich) in PBS for 30 min, followed by incubation with a primary antibody (Table 1) in 1% BSA solution at 4°C for 1 h. After extensive washing with PBS, cells were incubated with a secondary antibody labeled with Alexa Fluor 555 (Invitrogen), Alexa Fluor 568 (Invitrogen), or Alexa Fluor 488 (Invitrogen) in 1% BSA solution at room temperature (RT) for 30 min. Cells were washed again, counterstained with 4′,6-diamidino-2-phenylindole (DAPI; Sigma-Aldrich), and visualized using a fluorescence microscope (Zeiss AxioVert 200M; Carl Zeiss Inc., Thornwood, NY, USA).
Real-Time qRT-PCR
RNA was extracted with the Qiagen RNeasy Mini Kit (Qiagen, Hilden, Germany) for each individual sample and assessed for its purity and concentration with NanoDrop 2000 spectrophotometer (Thermo Fisher Scientific) and reverse transcribed using SuperScript III First-Strand synthesis kit (Cat. No. 18080-051; Life Technologies). Primers for quantitative gene expression RT-PCR SYBR Green assays were designed using primer3 software (http://biotools.umassmed.edu/bioapps/primer3_www.cgi) to gen erate an amplicon of 60–150 bp that is spread over exon junction areas unless it was impossible. Primers designed were not to discriminate multiple transcript variants within given gene and avoided any known sequence variability. Assays for several potential reference genes were also designed. The sequences of primers along with Entrez gene IDs are presented in Table 2.
Gene Symbols and Primer Sequences

All real-time PCRs were performed in duplicate for each gene. All samples tested with particular assays were run on the same plate to avoid plate-to-plate variation. An assay for each region was set up as follows: for 10 μl of total reaction volume, 5 μl of 2X USB VeriQuest Fast SYBR qPCR master mix (Affymetrix, Santa Clara, CA, USA, PN 75690), 200 nM of each primer, 4 ng of template reverse-transcribed RNA, and water were used. SYBR Green assays were run on 7500FAST instrument (Applied Biosystems, Thermo Fisher Scientific) in the fast mode under conditions recommended by the master mix manufacturer, namely, uracil–DNA glycosylase (UDG) treatment at 50°C for 2 min, 95°C for 5 min followed by 40 cycles of 95°C for 3 s and 60°C for 30 s followed by a melt curve stage. Data were analyzed by the 7500FAST instrument software v2.0.6 (Applied Biosystems, Thermo Fisher Scientific). Assay validations using five 10-fold dilutions of cDNA ranging from 40 to 0.004 ng of RNA input per reaction showed linear range and detection limit of 40 ng to 0.04 ng for all assays tested with PCR efficiency 98%–110%. Each reaction plate included duplicate wells of no template control reactions for each assay. Among 15 potential reference genes tested, N-acetyltransferase 1 (NAT1), ubiquilin 1 (UBQLN1), and F-box and WD repeat domain containing (FBXW2) were selected as least variable. Their mean Ct value was used in data analysis by the ΔCt method. Values of “iPS cells,” “hepatic differentiation, day 3,” and “hepatic differentiation, day 14” represent the mean of ΔCt of three independent differentiation experiments, using two iPSC lines generated by Sendai viral vectors, and one iPSC line generated by episomal vectors. Values for “primary human hepatocytes” represent a single specimen. Relative expression values were calculated by the 2-ΔCt method multiplied by hundred and shown in a logarithmic scale.
Detection of the loss of episomal plasmids or Sendai virus after reprogramming was carried out according to manual instructions of the episomal iPSC reprogramming plasmid kit (SBI, No. SC900A-1; System Bioscience, Palo Alto, CA, USA) and TaqMan iPSC Sendai detection kit (No. A13640; Applied Biosystems).
MicroRNA Expression Profiling
Arrays of DNA oligonucleotides that corresponded to the sense sequences of 529 mature human miRNAs (Sanger database 2012) with 5′ amino modifier at C6 were printed on Corning epoxide slides (Cat. No. 40043; Corning, NY, USA) in 3XSSC buffer in a final concentration of 50 nM (50 fmol per spot) in quadruplicates at the Albert Einstein College of Medicine as previously described (17). The slides were treated before hybridization as previously described (2). Small RNA-enriched sample (250–500 ng; mirVana kit; No. 1560; Ambion, Thermo Fisher Scientific) was used for the target preparation with some modifications from Goff et al. (7). Briefly, poly (A) tailed RNA was submitted to cDNA synthesis using dT17 RT primer with 3DNA capture sequence on the 5′ end complimentary to sequence attached to either Oyster 550 or Oyster 650 carrying 3DNA dendrimer (http://genisphere.com/sites/). Tagged cDNA was combined and concentrated in the Nanosep 10K omega centrifugal device (No. OD010C34; PALL Life Sciences, Port Washington, NY, USA). Retrieved volume was adjusted to 15 μl, mixed with 2X-SDS-based hybridization buffer (No. C600V600S25; Genisphere, Hatfield, PA, USA) heated for 10 min at 75°C and applied to arrays for hybridization at 50°C overnight. The next day arrays were washed and hybridized for 4 h at 64°C with the mixture of custom 3DNA (900) Dendrimer Oyster 550/Oyster 650 signal amplifiers (Cat. Nos. AA9050 and AC9060; Genisphere). All further steps were done previously described (17). Average intensity for each probe was computed and then normalized on global median intensity for a particular slide. Values were log2 transformed and submitted to hierarchical cluster analysis by Eisen's Gene Cluster 3.0 and Java Treeview software, available for free download from http://softadvice.informer.com/Open_Source_Cluster_Exe.html and https://sourceforge.net/projects/jtreeview/, respectively.
Glycogen Content
Cells were fixed in alcoholic formalin (40% formaldehyde and 95% ethanol, 1:10 dilution) for 1 h. Periodic acid–schiff (PAS) staining was carried out on cells using a kit (395B-1KT; Sigma-Aldrich) according to the manufacturer's instructions. Diastase digestion was performed to confirm that positive staining was due to the presence of glycogen.
Indocyanine Green Staining
Indocyanine green (ICG; MP Biomedicals, Santa Ana, CA, USA) was dissolved in DMEM (Lonza) containing 10% FBS to a final concentration of 1 mg/ml. iHeps were incubated with 1 mg/ml ICG at 37°C for 15 min. Afterward, cells were washed three times with PBS and examined by bright-field microscopy. After the examination, the dish was refilled with DMEM containing 10% FBS, and the cells were examined again 3 h later.
Urea Secretion
The iHeps or primary human hepatocytes (10 6 ) were cultured in fresh media for 16 h. Urea secretion into the media was analyzed using a urea assay kit (Sigma-Aldrich) according to the manufacturer's instructions.
Flow Cytometry
iHeps were released with trypsin/EDTA and washed with PBS at day 14 of differentiation, and then fixed with 4% PFA (Wako) for 30 min. After permeabilization with 0.5% Triton X-100 for 15 min, cells were blocked with 3% BSA for 30 min. The cells were then incubated with primary antibodies against human- specific antibodies (Table 1) for 30 min, followed by incubation with a secondary antibody labeled with Alexa Fluor 555 (Invitrogen) or Alexa Fluor 488 (Invitrogen) for an additional 30 min. Flow cytometry was performed on an LSR II Flow Cytometer (BD Biosciences), and data were analyzed using the FACS Diva software.
Mouse Transplantation Model
Transgenic mice (PiZ) were originally generated by Sifers et al. (20) by inserting into the mouse germline a 14.4-kb DNA fragment of the human genome containing the entire SERPINA1 gene carrying a G-to-A transition at nucleotide position 11,940 in exon 5, which leads to the expression of a mutant form of α-1 antitrypsin (ATZ) with a glutamic acid to lysine substitution at amino acid 366. Accumulation of the misfolded ATZ protein within hepatocytes produces endoplasmic reticulum stress. We showed previously that wild-type mouse cells transplanted into the livers of the PiZ mice proliferate spontaneously, repopulating the host liver by cell competition (4). For transplantation of human iHeps, we bred PiZ mice with immunodeficient Scid mice, which are homozygous for the prkdc gene mutation [National Cancer Institute (NCI), Bethesda, MD, USA], Scid/NCr, C.B-Igh-1b/lCr Tac-Prkdcscid, and backcrossed to generate PiZ/Scid mice. The PiZ/Scid mice were maintained at the Animal Institute of Albert Einstein College of Medicine. All animal experiments were performed with the approval of the Institutional Animal Care and Use Committee (IACUC) of the Albert Einstein College of Medicine and were within the guidelines for humane care of laboratory animals.
Cell Preparation and Transplantation
On the day of transplantation, iHeps were released from the culture dish using trypsin/EDTA and suspended in PBS. After counting and determination of viability by trypan blue (Gibco) exclusion method, the cells were stored on ice for up to 60 min until transplantation. Two 5- to 6-week-old male PiZ/Scid mice were anesthetized by inhalation of a nitrous oxide/oxygen isoflurane gas mixture (Abbott Laboratories, Abbott Park, IL, USA). The iHeps were transplanted as previously described (4). Briefly, the caudal pole of the spleen was exposed through a left flank incision, and a ligature was fashioned into a loose knot around the caudal pole. One million iHeps were injected into the splenic pulp using a syringe with a 27-gauge needle. The knot was then tightened, and the incision was closed.
Liver Immunohistochemistry
PiZ/Scid mice were sacrificed 3 months after iHep transplantation, and livers were harvested. Liver fragments fixed in 10% formaldehyde (Sigma-Aldrich) were washed with 70% alcohol, progressively dehydrated, and embedded in paraffin (Sigma-Aldrich). The tissue sections were dewaxed, rehydrated, and heated in a microwave oven for 3 min in an Antigen Unmasking Solution (pH 6.0; Vector Laboratories, Burlingame, CA, USA). The sections were treated with 3% H2O2 (Sigma-Aldrich) for 10 min at RT before blocking with 10% goat serum (Abcam, Cambridge, MA, USA) for 1 h. After this, the sections were exposed to primary antibodies (Table 1) at 4°C overnight. After intense washing with PBS, the sections were exposed to horseradish peroxidase (HRP)-conjugated secondary antibodies (Millipore) for 2 h at RT. Next, 3,3-diaminobenzidine (DAB) Peroxidase Substrate Kit (Vector Laboratories) was used to detect HRP secondary antibodies according to the manufacturer's instructions. Slides were counterstained with hematoxylin (Sigma-Aldrich) and dehydrated before application of mounting medium (Dako, Carpinteria, CA, USA).
For simultaneous detection of human serum albumin (HSA)-containing iHeps and polymerized globules of ATZ, paraffin sections of the recipient PiZ/Scid mouse livers were hydrated and blocked with PBS containing 10% normal donkey serum (Abcam), 0.1% Triton® X-100, and 1% BSA for 45 min at RT. The sections were then incubated overnight at 4°C with an anti-α-1 antitrypsin mouse monoclonal antibody (Abcam) and an anti-HSA polyclonal antibody (Abcam) at 1:100 dilution. The antibody binding was visualized using secondary anti-mouse IgG antibodies conjugated with Alexa Fluor 568 (Life Technologies) and anti-rabbit IgG antibodies conjugated with Alexa Fluor 486 (Life Technologies). The sections were then covered with a mounting solution containing DAPI (Vector Laboratories) for visualization of the nuclei.
Human Primary Hepatocytes and Cell Lines
Cryopreserved isolated human hepatocytes were purchased from Triangle Research Labs (TRL; Charlottesville, VA, USA). Newborn human foreskin fibroblasts (NuFFs) were purchased from Amsbio (Cambridge, MA, USA). Cell suspensions were handled and seeded according to the manufacturer's instructions.
Statistical Analysis
SPSS 18.0 software (IBM, Armonk, NY, USA) was used for statistical analysis. Values are presented as mean with standard deviation (SD). Analysis was performed by Student's t-test. A value of p < 0.05 was considered as statistically significant.
Results
Isolation and Storage of Human Urinary Epithelial Cells
Human urine samples were collected after obtaining informed consent from donors and approval from the institutional review board (IRB) of the Albert Einstein College of Medicine. The urine donors did not receive any financial or material incentive. We collected 250–500 ml of freshly voided midstream urine from two individuals. Both donors provided five urine samples at different time points. After 4 to 6 days of cultivation, one to five colonies emerged per well of a six-well plate in at least four of the five urine samples from each donor (Fig. 1A). Stable cell populations grew in 4 days after first passaging of the cells. Consistent with previous reports, the cell colonies showed two types of morphologies: one showing a smooth-edged contour and the other with a cobble stone-like cell morphology (31). To determine whether the urine sample could be stored for transportation before culturing the epithelial cells, we kept freshly donated urine on ice for 4 to 48 h before isolating and culturing the cells by our standard procedure. Significantly, cells harvested from urine samples stored for 48 h showed an only slightly delayed cell growth compared with cells isolated from freshly voided urine or urine stored for 4 h (Fig. 1B).

Human urinary epithelial cells. (A) Urinary epithelial cells at day 5 and day 10 after isolation. (B) Urinary epithelial cells isolated and cultured after 4 and 48 h of storage at 4°C. Scale bars: 200 μm.
Characterization of Human Urinary Epithelial Cells
To validate the renal origin of the newly generated urinary epithelial cell colonies, and to distinguish the cells with elongated morphology from human fibroblasts, we performed immunofluorescence microscopy to detect markers of human epithelial cells, fibroblasts, and renal tubular epithelial cells (Fig. 2). Neonatal foreskin fibroblasts (NuFFs) were used as a control. The urinary epithelial cells displayed a positive staining for the epithelial markers, E-cadherin, β-catenin, and zonula occludens-1 (ZO-1), whereas fibroblasts were negative for those markers. The urinary epithelial cells were positive for the fibroblast marker fibronectin but showed a much fainter staining for another fibroblast marker, vimentin. The urinary epithelial cells were strongly positive for the renal proximal tubular marker CD13. The mineralocorticoid receptor (MCR), also known as the aldosterone receptor or nuclear receptor subfamily 3, group C, member 2 (NR3C2), was expressed in urinary cells indicated by positive staining. These results confirmed that cells cultured from urine were epithelial cells of renal tubular origin.
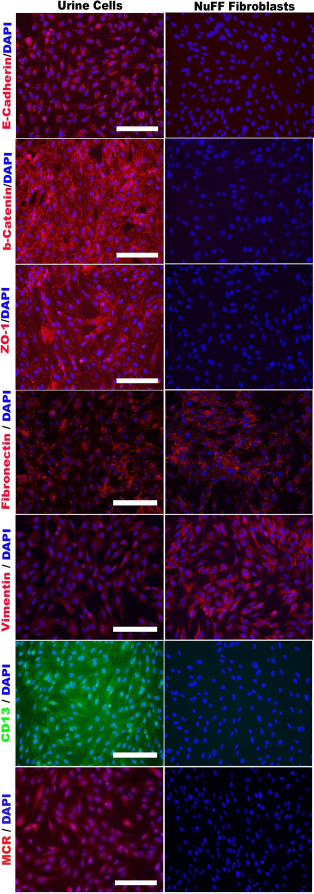
Characterization of urinary epithelial cells. Immunostaining of urinary epithelial cells for epithelial markers (E-cadherin, β-catenin, and ZO-1), fibroblast markers (fibronectin and vimentin), renal epithelial marker CD13, and mineralocorticoid receptor MCR. Scale bars: 200 μm.
Integration-Free Generation of iPSCs From Urinary Epithelial Cells
We have used two different strategies for reprogramming the urinary epithelial cells of both donors, which do not involve integration of the transgenes into the cellular genome. The first method was to infect the urinary epithelial cells at passage 2 with recombinant Sendai viruses expressing the reprogramming factors hOCT3/4, hSSOX2, hKLF4, and hc-MYC. In the second approach, we transfected the urinary epithelial cells with a set of three oriP/EBNA episomal plasmids (consisting of the latent origin of replication, oriP and the nuclear antigen-1, EBNA of the Epstein–Barr virus) that express the reprogramming factors OCT4, SOX2, KLF4, L-MYC, LIN28, and an shRNA against p53 by nucleofection (Amaxa). By each of these approaches, small colonies with iPSC morphologies appeared in 3 to 5 weeks, when using urinary cells from both donors (Fig. 3A). The colonies were picked and expanded on Matrigel-coated dishes using mTeSR media without feeder cells. Both methods provided satisfactory reprogramming efficiency; however, the Sendai virus-based method was slightly more efficient when comparing urinary cells derived from the same donor. Using the Sendai virus method, we obtained 49 colonies 20 to 25 days after infection. On the basis of the initial cell number of 1 million cells, the calculated efficiency is 0.0049%. With the episomal plasmids, 35 days after nucleofection of 1 million urinary epithelial cells, we obtained 28 colonies, leading to a calculated efficiency of 0.0028%. This difference could be significant in cases where only a small number of somatic cells are available for reprogramming.

Characterization of urinary epithelial cell-derived iPSCs. (A) iPSC colonies observed after reprogramming urinary epithelial cells with Sendai virus or episomal vectors. (B) Immunocytochemical staining of pluripotency markers Oct3/4, Nanog, SSEA4, and Tra-1-60 in Sendai virus or episomal vector-derived iPSCs. (C) iPSC lines differentiated into all three germ layers after subcutaneous injection into NOD/Scid mice (hematoxylin and eosin staining). Scale bars: 100 μm (A–C). (D) iPSCs exhibited normal karyotype. Analysis of iPSC lines generated using recombinant Sendai viruses or OriP episomal plasmid.
Characterization of the iPSCs
At passage 4, iPSC lines reprogrammed with either oriP/EBNA-1 episomal vectors or recombinant Sendai viruses were evaluated for the presence of embryonic stem cell (ESC)-specific transcription factors, such as OCT3/4 and NANOG, and cell surface proteins, such as SSEA4 and TRA-1-60. iPSC lines derived by both methods exhibited positive immunofluorescence staining for all four ESC-specific antigens (Fig. 3B). An iPSC line was considered to be stable when it retained its morphological characteristics and continued to express undiminished levels of OCT3/4, NANOG, SSEA4, and TRA-1-60 after at least 16 passages. No differences in staining pattern or intensity were found when iPSCs derived from urinary epithelial cells were compared with those derived from fibroblasts (data not shown). Consistent with the immunofluorescence findings, real-time RT-PCR analysis showed a high expression of pluripotency marker genes LIN28A, MYC, NANOG, POU5F1 (encoding OCT3/4), and SOX2 (Fig. 4B). To evaluate the capacity of the iPSCs to differentiate into cells belonging to all three germ layers in vivo, iPSC lines derived from both Sendai virus and oriP/EBNA-1 episomal vector-derived iPSCs were injected subcutaneously and beneath the renal capsule of NOD/Scid mice. All iPSC lines gave rise to teratomas containing cells from all three germ layers, as shown by H&E staining of tissue sections (Fig. 3C). All iPSC lines were found to be normal by karyotypic analysis (Fig. 3D). Using highly sensitive qPCR methods, we have found that after more than 16 passages, the episomal plasmid sequences and the Sendai viral sequences were undetectable in the iPSCs (data not shown).

Decline of pluripotency markers after directed differentiation of iPSCs toward hepatocytes. (A) Immunofluorescence staining of pluripotency markers Oct3/4, NANOG, SSEA4, and TRA-1-60 in iPSCs at day 3 of directed differentiation. One representative experiment out of three is shown. Scale bars: 100 μm. (B) Real-time qRT-PCR analysis of pluripotency markers LIN28A, MYC, NANOG, POU5F1 (OCT4), and SOX2 expression in iPSCs and iPSCs at day 3 (DE) and day 14 (iHep) of directed differentiation toward hepatocytes. Data are presented as means of three independent experiments. One specimen of primary human hepatocytes (PHH) was used for comparison.
Efficient Directed Differentiation of Human Urinary Epithelial Cell-Derived iPSCs to iHeps
Two iPSC lines from both donors generated by either Sendai virus or oriP/EBNA-1 episomal vectors were differentiated to iHeps.
Immunocytochemistry and Gene Expression Profiles
One day after treating urinary epithelial cell-derived iPSCs with Wnt3a (50 ng/ml), Activin A (100 ng/ml), and FGF2 (100 ng/ml), the cell morphology changed markedly from the typical iPSC colony structure. During the following 2 days, differentiation toward DE was driven further by adding knockout serum replacement (KSR) at progressively increasing concentrations. This treatment resulted in a marked decline in the expression of pluripotency markers OCT3/4, NANOG, SSEA4, and TRA-1-60 in 3 days, as shown by immunocytochemical staining (Fig. 4A). This result was corroborated by gene expression profiles using real-time RT-PCR. The pluripotency genes LIN28A, MYC, NANOG, POU5F1 (OCT3/4), and SOX2 that are highly expressed in iPSCs were downregulated after inducing the differentiation to DE (Fig. 4B). Expression of these genes was downregulated further during subsequent steps of hepatic differentiation.
In parallel with the downregulation of pluripotency markers, DE markers SOX17, FOXA2, and GATA4 increased during these 3 days. The nuclei of 85%–90% of the cells at the DE stage (hepatic differentiation, day 3) stained positively for all three endodermal markers (Fig. 5A). Hepatocyte nuclear factor 4a (HNF4α) was expressed at a low level at this stage of hepatic differentiation. Real-time RT-PCR analysis verified the upregulation of SOX17, FOXA2, and GATA4, as well as that of 15 other genes that are known to be highly expressed in cells at day 3 of hepatic differentiation (Fig. 5B).

Appearance and decline of DE markers during directed differentiation toward hepatocyte lineage. (A) Immunocytochemistry staining of DE markers SOX17, FOXA2, GATA4, and HNF4α in iPSCs at day 3 after hepatic differentiation. One representative experiment out of three is shown. Scale bars: 100 μm. (B) Real-time qRT-PCR results of 18 DE markers in iPSCs and iPSCs at day 3 and day 14 after hepatic differentiation. Data are presented as means of three independent experiments. One specimen of primary human hepatocytes (PHH) was used for comparison.
In the next step, to induce hepatic specification, the cells with DE characteristics were treated with HGF at 100 ng/ml for the next 8 days. Immunocytochemical staining of the cells showed that the expression of HNF4α was markedly upregulated after HGF exposure (Fig. 6A). a-Fetoprotein (AFP), a marker of fetal hepatocytes, was highly expressed at this stage. The cells also expressed both cytokeratin 18 (CK18), a cytoskeletal protein, and the bile duct epithelial marker cytokeratin 19 (CK19).

Characteristics of iHeps after directed differentiation toward hepatocyte-like iHeps. (A) Immunofluorescence staining for early hepatocyte markers HNF4α, AFP, CK18, and the biliary epithelial marker CK19 at day 11 of directed differentiation toward hepatocyte-like cells. Scale bars: 100 μm. (B) Immunofluorescence staining for mature hepatocyte markers, AGXT, albumin (Alb), ASGPR1, CEBPα, Cyp P450 3A4 (Cyp3A4), and Prox1 at day 14 of hepatocyte-directed differentiation. One representative experiment out of three is shown. Scale bars: 100 μm. (C) Real-time qRT-PCR results of 94 hepatocyte markers in iPSCs at day 3 (DE) and day 14 (iHep) of hepatocyte-directed differentiation. Data are presented as means of three independent experiments. One specimen of primary human hepatocytes (PHH) was used as positive control. (D) iPSC morphology at day 14 of hepatocyte-directed differentiation. Scale bar: 100 μm.
To induce further maturation of the hepatic progenitorlike cells to cells with hepatocyte-like characteristics, we treated the cells with 10−7 mol/L dexamethasone for 3 additional days. After this period (hepatic differentiation, day 14), immunofluorescence staining showed that the cells expressed hepatocyte-preferred proteins including HSA, asialoglycoprotein receptor 1 (ASGPR1), serine-pyruvate aminotransferase (AGXT), CCAAT/enhancer-binding protein α (CEBPα), cytochrome P450 3A4 (CYP3A4), prospero homeobox protein 1 (PROX1), and UDP-glucu ronosyltransferase 1-A1 (UGT1A1) (Fig. 6B).
For broader characterization of the gene expression profile of the cells, we analyzed the expression of 94 genes that are expressed in mature primary human hepatocytes (PHH) by real-time RT-PCR. At day 14 at hepatic differentiation, cells expressed ASGPR1 and ASGPR2, and the ATP-binding cassette subfamily B member 11 (ABCB11/BSEP) that is located at the canalicular surface of hepatocytes (Fig. 6C). mRNA expression for these genes was significantly higher in cells at day 14 in comparison with cells at the DE stage (day 3 of hepatic differentiation) but lower than that in PHH. Real-time RT-PCR showed in general that cytochrome P450 (CYP) family of proteins was expressed at a lower level in cells at day 14 than in PHH (Fig. 6C). Nonetheless, some CYP genes were upregulated at day 14 in comparison with cells at the DE stage of differentiation. CYP2C9 expression was comparable to that in PHH, whereas CYP3A5 and CYP3A7 were expressed at a lower level. Interestingly, CYP3A7 carries out a role in fetal livers that is comparable with the function of CYP3A4 in adult livers. As CYP3A4 expression was very low in cells at day 14 of hepatic differentiation and CYP3A7 was upregulated, these results suggest the immaturity of the iHeps in the context of CYP expression. Expression of several genes encoding cytoplasmic proteins was upregulated in the cells at the final step of hepatic differentiation (Fig. 6C). Glutathione S-transferase A1 (GSTA1), cytosolic dehydroepiandrosterone sulfotransferase (SULT2A1), fatty acid-binding protein 1 (FABP1), methionine adenosyltransferase I (MAT1A), nicotinamide N-methyltransferase (NNMT), and members of UDP-glucuronosyltransferase 2 family (UGT2B4 and UGT2B10) were all upregulated in cells at day 14 of hepatic differentiation compared with the cells at day 3. Genes expressing proteins localized at other organelles (nucleus, Golgi apparatus, mitochondria, and peroxisomes) were variably upregulated (Fig. 6C). CEBPα and the nuclear constitutive androstane receptor (CAR) were expressed significantly in cells at day 14. The peroxisomal enzyme AGXT was also expressed efficiently.
We also investigated the expression of genes encoding proteins that are produced and secreted into the blood by hepatocytes (Fig. 6C). All genes in this group that were tested were upregulated significantly at hepatic differentiation (day 14), compared with cells at the DE stage (day 3). These included AHSG, ALB, ALDOB, AMBP, ANG, APCS, CFB, CFHR2, CPB2, CRP, FGA, FGB, FGG, HGF, Hp, HPX, ITIH1, ITIH2, ITIH3, ITIH4, KNG1, ORM1, ORM2, and RBP4. Genes for α-1 antitrypsin-1 (SERPINA1), apolipoproteins (APO), and the hormone angiotensin (AGT) were also expressed at the final step of iHep differentiation. At this time point, the iHep morphology was fully developed toward the polygonal morphology of hepatocytes (Fig. 6D).
Numerous microRNAs (miRNAs) show specific expression patterns that are specific for both tissue type and developmental stage. To elucidate the pattern of miRNA changes, expression level changes of 141 miRNAs at different time points (day 3, day 11, and day 14) during the directed differentiation were selected to generate a heatmap (Fig. 7). miR-122 is known to be a hepatocyte-specific miRNA, which accounts for about 72% of the total miRNA in these cells (26). Our results, based on three independent experiments, showed that miR-122 is expressed at day 11 and day 14 of directed differentiation of the iPSCs toward iHeps. Members of the miR-302 family (miR-302a, b, c, d, and miR-367) were expressed in iPSCs and DE (day 3) but were downregulated at later time points (day 11 and day 14). An onco-miRNA cluster (miR-106, 17, 18, 19, 20, and 92) is expressed in iPSCs. Expression of these miRNAs was downregulated during differentiation, but some of these continued to be expressed, although at a reduced level.

miRNA expression profiles during hepatic differentiation of urine-cell derived iPSCs. A heat map of human miRNAs that were differentially expressed at various stages of hepatic differentiation (day 3, day 11, and day 14) is shown. Primary human hepatocytes and iPSCs served as controls. Three independent hepatic differentiation experiments are depicted. For cluster analysis, normalized signal intensity data were converted into log2. Values above 1 (positive in log2 scale) are shown in red, below 1 (negative in log2 scale) in green, equal to 1 (0 in log2 scale) in black, and absent values in gray.
Functional Analysis of iHeps
After the final step of hepatocyte-directed differentiation, we investigated some hepatocyte-specific functions of the iHeps. Periodic acid–Schiff staining proved their ability to synthesize and store glycogen (Fig. 8A). The iHeps were able to internalize ICG (Fig. 8A) and release it after a few hours. The cells produced and secreted urea in the media. Urea secretion by iHeps (6.61 ng/μl) approached the level observed with primary human hepatocytes (8.07 ng/μl) (Fig. 8B).

Functional analysis of iHeps. (A) Glycogen content of iHeps as shown by PAS staining, with or without diastase treatment, and indocyanine green uptake and release by iHeps. Scale bars: 100 μm for all micrographs in (A). (B) Urea secretion by iHeps into the media. Data are presented as means of three independent experiments ± SD. ∗p < 0.05. (C) Representative flow cytometric analysis of iHep cells revealed positive staining for albumin, AGXT, ASGPR1, UGT1A1, and CEBPα.
Flow Cytometric Analysis for Liver-Specific Proteins
To quantify the proportion of iHeps that express liver-specific proteins, the iHeps were released from the culture dishes and costained with antibodies against HSA, AGXT, UGT1A1, ASGPR1, and CEBPα. Flow cytometric analysis showed that a majority of the iHeps expressed HSA (84.5%), AGXT (83.1%), UGT1A1 (79.5%), and CEBPα (74.2%), while a subset of these cells expressed ASGPR1 (45.9%) of the total iHep population (Fig. 8C).
Engraftment of iHeps in the Liver of PiZ/Scid Mice
To determine the engraftability of the iHeps in mouse liver, in a pilot study we transplanted 1 million iHeps by intrasplenic injection into PiZ/Scid and control Scid mice. Three months after transplantation, livers were collected and sections were stained with PAS, which visualized ATZ globules (Fig. 9A). Liver sections were also stained for HSA using a human-specific antialbumin antibody. The human albumin-containing cells were visualized using the DAB detection system. Several small cell clusters dispersed throughout the liver stained positively for human albumin in the livers of PiZ/Scid recipients (Fig. 9A). In contrast, only few single iHeps were observed in Scid control mouse livers, suggesting a moderate repopulation efficacy by human iHeps in the PiZ/Scid recipients. Double immnofluorescence staining of paraffinized liver sections for mouse α-1 antitrypsin AAT (ATZ) and HSA showed that, as expected, the human albumin-positive cells did not contain ATZ globules, whereas most host cells did contain the globules (Fig. 9B).
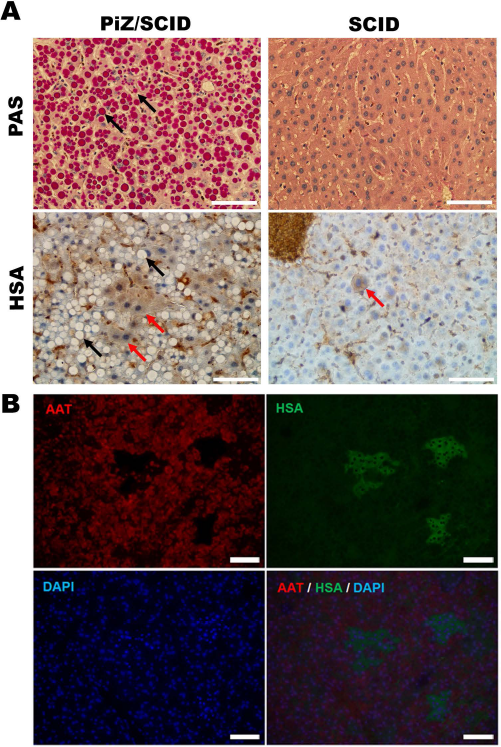
Immunohistochemical staining of PiZ/Scid mouse liver sections 3 months after iHep transplantation. (A) PiZ/Scid mouse (four copies of Piz gene) liver exhibiting mutant human AAT globules (black arrows) stained red after PAS staining. Scid mouse exhibiting no such globules after PAS staining. PiZ/Scid mouse presenting clusters of HSA-positive engrafted iHep cells that are devoid of AAT globules (red arrows). Livers of Scid mice (without the PiZ gene) lacked AAT globules but showed the engraftment of single HSA-stained iHeps (red arrow). (B) Double immunofluorescence staining of the liver section of PiZ/Scid recipient mice for AAT and HSA showed that the HSA-positive clusters of the engrafted iHeps did not contain AAT globules. The DAPI-stained nuclei show blue fluorescence. Scale bars: 100 μm.
Discussion
Isolated human hepatocytes are critically needed for disease modeling, drug development, and hepatocyte transplantation. The universal shortage of donor livers poses a major hurdle to all these applications and highlights the need for a renewable source of human hepatocytes. Breakthrough studies enabling the generation of iPSCs has focused the attention of several laboratories, including ours, to differentiating iPSCs to hepatocytelike iHeps (18). Of the various somatic cells that have been used to generate iPSCs, renal tubular epithelial cells shed in the urine are the most noninvasive cell type to collect, and therefore these cells could play an important role in personalized medicine. However, hepatocyte-directed differentiation of iPSCs generated from human renal tubular epithelial cells had not been characterized in detail before. While this article was in review, Si-Tayeb et al. reported that hepatocyte-like cells derived from urinary epithelial cells of patients with autosomal dominant hypercholesterolemia due to a specific mutation of proprotein convertase subtilisin/kexin type 9 (PCSK9) exhibited reduced PCSK9 secretion and low-density lipoprotein (LDL) uptake (22), providing another example of disease modeling based on iHeps. In this study, in addition to extensively characterizing the urinary epithelial cell-derived iHeps, we tested whether these cells were able to engraft in livers after transplantation into a mouse model of α-1 antitrypsin deficiency.
Cell colonies obtained after 4–6 days of cultivation of urinary epithelial cells could be grown to a stable cell population within the next 2 weeks. The positive staining for the renal epithelial marker CD13 confirmed that cells cultured from urine were of renal tubular origin. Our finding that urinary epithelial cells could be isolated and cultured from urine that was stored for 48 h at 4°C would enable urine samples to be transported to a laboratory from the site of collection, such as patients' homes or other collection sites. The two reprogramming strategies that we used do not leave any genomic footprint and generate iPSC lines with typical pluripotent stem cell features (Fig. 3). The method using recombinant Sendai viruses is more expensive but also provides higher reprogramming efficiency, compared with the method using episomal vectors. This difference could be significant in cases where only a small number of somatic cells are available for reprogramming.
Wnt3a is expressed at a critical stage of human liver development (27). In combination with Activin A, it enhances the induction of definitive endoderm and subsequent hepatic lineage specification. To improve the efficiency of DE generation, we modified our previous hepatocyte-directed differentiation protocol (2) by adding 50 ng/ml recombinant human Wnt3a during the first 2 days of differentiation. This modification enhanced the downregulation of pluripotency markers, along with a simultaneous increase in the expression of DE markers such as SOX17, FOXA2, and GATA4 (Figs. 4 and 5). Nearly all the cells reached the DE stage at this phase of differentiation, which could improve the quality of iHeps and their quantitative yield at a later time point of differentiation. Consistent with previous reports, almost no cells expressed HNF4α at this stage (21). This outcome was expected because HNF4α is highly expressed in extraembryonic endodermal cells, but not in visceral endoderm, which results from exposure to Activin A. HNF4α, a transcription factor that plays a pivotal role in liver development by regulating the expression of several hepatocyte-preferred genes, was markedly upregulated in the cells after exposure to HGF, coinciding with the assumption of the polygonal shape that is characteristic of hepatocytes. Interestingly, cells at this stage expressed both CK18, a cytoskeletal protein characteristic of hepatocytes and CK19, which is a bile duct epithelial marker (Fig. 6A). Such dual expression is characteristic of hepatic progenitor cells, which give rise to both hepatocytes and bile duct epithelial cells.
HSA was strongly expressed in the iHeps. FABP1, MAT1A, NNMT, UGT2B4, and UGT2B10 were upregulated in cells at day 14 after hepatic differentiation compared with the DE stage, indicating progressive attainment of these essential functions. ALDOB, which plays a key role in both glycolysis and gluconeogenesis, was expressed substantially in iHeps. AGXT, which expresses a peroxisomal enzyme that reduces oxalate production by hepatocytes, was also expressed efficiently. The iHeps-expressed ASGPR1 and ASGPR2, which are located at the sinusoidal surface of hepatocytes and mediate the endocytosis of asialoglycoproteins from circulation, and ABCB11/BSEP, which is located at the canalicular surface of hepatocytes and transports bile salts from hepatocytes into the bile, were upregulated in iHeps (Fig. 6B and C). These results may perhaps indicate a polarization of the iHeps and suggest the appearance of important metabolic functions in the iHeps, at least on the mRNA level. However, further immunochemistry experiments would indicate a polarization of the iHeps. Interestingly, expression of UGT1A1, which is expressed mostly after birth in human liver, was observed in the iHeps. Expression of ASGPR1 and UGT1A1 indicates that iHeps are similar to mature hepatocytes in some respects. On the other hand, CYP3A7 carries out a role in fetal livers that is comparable with the function of CYP3A4 in adult livers. As CYP3A4 expression was very low in the iHeps and CYP3A7 was upregulated, our results suggest the persistence of some characteristics of fetal hepatocytes in the iHeps in the context of CYP expression. Consistent with this, the expression of AFP, which is characteristic of fetal hepatocytes, persisted to a significant extent in the iHeps. Thus, the iHeps, which are artificially differentiated in vitro, exhibit mixed characteristics of fetal and mature hepatocytes. Other important gene expressions detected by real-time RT-PCR included GSTA1 and SULT2A1. These enzymes detoxify drugs and other exogenous substances, as well as endogenous compounds within the liver. Enzymes involved in fatty acid metabolism, methylation reactions, and the glucuronidation pathway were also expressed. FABP1, MAT1A, NNMT, and members of UDP-glucuronosyltransferase 2 family such as UGT2B4 and UGT2B10 were upregulated in cells at day 14 after hepatic differentiation compared with the cells at day 3, which may indicate a progressive attainment of these essential functions in the iHeps.
Spatial and temporal expression patterns of microRNAs are important in cell lineage determination. The most abundant microRNA in the liver, miR-122, was expressed in iHeps at day 11 and day 14 of hepatic differentiation, indicating another liver-specific feature of the iHeps (Fig. 7). miR-122 expression plays a critical role in hepatic lipid metabolism and in protecting the liver against inflammation, fibrosis, and neoplastic transformation (28). Our results suggest that quantification of miR-122 expression should be a standard assay for evaluation of the level of differentiation of iHep cells. Members of the miR-302 family (miR-302a, b, c, d, and miR-367) have been reported to induce reprogramming to a pluripotent state and are considered markers of stemness (11). We found that these miRNAs were only expressed in iPSCs and the DE stage and declined markedly at later stages of differentiation (day 11 and day 14), indicating an exit from the stem cell state. Considered together, the gene expression profile of the iHeps indicates that in some respects these cells approach PHH in terms of maturation, whereas in other respects they resemble fetal hepatocytes or hepatic progenitor cells.
To determine whether the human iHeps can engraft in the mouse liver, we transplanted the iHeps into the livers of Scid mice that were transgenic for ATZ gene, which is a mutant form of human α-1 antitrypsin (PiZ/Scid) by injection into the splenic pulp, from where the cells migrate to the liver through the splenic and portal vein. As in the case of patients with the ATZ mutation, the PiZ mice, which are transgenic for the Z-type mutant human SERPINA1 accumulate the misfolded mutant protein in hepatocytes, which can polymerize forming ATZ globules and cause cellular stress. We have shown previously that wild-type primary mouse hepatocytes engrafted in the livers of PiZ mice spontaneously repopulate livers of PiZ mice (4). In the present study, we used immunodeficient PiZ mice to evaluate whether human iHeps can engraft and grow in mouse liver. As hepatocytes initially engraft as single cells after transplantation via the intrasplenic route, appearance of HSA-positive hepatocyte clusters in the Piz/Scid mouse recipients indicated both engraftment and subsequent proliferation of the human iHeps (Fig. 9). As expected, the human HSA-positive hepatocytes did not contain the ATZ globules, which was confirmed by double immunofluorescence staining.
Our findings may have an impact on future cell transplantation therapies. Directed differentiation of somatic-derived iPSCs to hepatocyte-like cells could not only provide a cell-based platform for pathophysiological studies and drug discovery but could also serve as a renewable source for hepatocyte transplantation. Availability of such cells could facilitate hepatocyte transplantation as an alternative for organ transplantation for the treatment of some inherited liver diseases. Here we have shown that human urinary epithelial cells can be efficiently reprogrammed into authentic iPSCs and then differentiated to hepatocyte-like iHeps. Extensive molecular and functional characterization of the iHeps reveals that they exhibit some characteristics of mature hepatocytes, whereas in other respects, they resemble fetal hepatocytes or liver progenitor cells. Thus, urine is a readily available source for generating human hepatocyte-like cells that could aid disease modeling, pharmacological testing, and, potentially, hepatocyte transplantation-based regenerative medicine.
Footnotes
Acknowledgments
This work was supported in part by NIDDK 1PO1 DK 096990-01 (to J.R.-C., PD: D. Perlmutter), NIDDK DK092469 (to N.R.-C.), New York Stem Cell Foundation CO26440 (to J.R.-C.), and German Research Foundation SA 2451/1-1 (to V.S.). The authors declare no conflicts of interest.