
Abstract
The study of canine bone marrow-derived mesenchymal stem cells (MSCs) has a prominent position in veterinary cell-based applications. Yet the plethora of breeds, their different life spans, and interbreed variations provide unclearness on what can be achieved specifically by such therapies. In this study, we compared a set of morphological, physiological, and genetic markers of MSCs derived from large dog breeds, namely, Border collie, German shepherd, Labrador, Malinois, Golden retriever, and Hovawart. We compared colony-forming units (CFUs) assay, population doubling time (PDT), senescence-associated β-galactosidase (SA-β-gal) activity, telomere length, and gene expression of MSCs, as well as the ability of cells to differentiate to osteogenic, adipogenic, and chondrogenic phenotypes. The influence of the culture media α-MEM, low-glucose DMEM, and high-glucose DMEM, used in cell isolation and expansion, was investigated in the presence and absence of basic fibroblast growth factor (bFGF). Initial cell yield was not affected by culturing medium, but MSCs expanded best in α-MEM supplemented with bFGF. After isolation, the number of MSCs was similar among breeds—as shown by equivalent CFUs—except in the Hovawart samples, which had fivefold less CFU. Telomere lengths were similar among breeds. MSCs divided actively only for 4 weeks in culture (PDT = ~50 h/ division), except Border collie cells divided for a longer time than cells from other groups. The percentage of senescent cells increased linearly in all breeds with time, with a faster rate in German shepherd, Labrador, and Golden retriever. Border collie cells underwent efficient osteogenic differentiation, Hovawart cells performed the best in chondrogenic differentiation, and Labrador cells in both, while German shepherd cells had the lower differentiation potential. MSCs from all breeds preserved the same adipogenic differentiation potential. In conclusion, despite variations, isolated MSCs can be expanded and differentiated in vitro, and all breeds are eligible for MSC-based therapies.
Introduction
In the field of regenerative medicine, cell-based therapies are a central theme with a rapidly expanding number of studies and publications in the last decade. Although human cell-based therapies are mostly discussed, the most consistent advances in this field were obtained in veterinary practices (8), where racehorses and pet animals, such as cats and dogs, were commonly treated. The most important and early area of interest has been orthopedics, but also lung (13), liver (15), and heart (27) were objects of these studies.
Dogs with their potential as an animal model for human disease research and their history of being important animals in many cultures have a prevalent role in the development of new therapeutic cell-based approaches. The relatively long life span, large body mass, and natural disease onset favor the use of large dogs as a model. Dogs are exposed to environmental factors, which can lead to natural development of cancer, obesity, and traumatic events. Many human genetic diseases have their canine homolog, which makes dogs a suitable animal model to develop cell-based regenerative engineering procedures.
Many of the regenerative studies conducted in dogs involved the use of mesenchymal stem cells (MSCs) due to their characteristics: ready availability in adult body, high expansion rate in vitro, and multilineage differentiation potential (21), which renders them ideal candidates for cell-based therapies. Canine MSCs had been isolated already in the 1990s and evaluated for their osteogenic potential (14). In the following years, studies investigated the potential of canine MSCs to differentiate in vitro to chondrocytes (22), osteocytes (16,25), adipocytes (29), myocytes (28), neurons (7,24), and cardiomyocytes (11). However, age and site of harvest influenced MSC yield and differentiation potential. For instance, MSCs were isolated from 5-month-old (skeletally immature) and 90-month-old (skeletally mature) mixed-breed dogs; cells derived from older dogs had lower osteogenic potential (29). The effective yield of MSCs from several sources in the adult body showed that bone marrow was a readily available source of stem cells, but canine MSCs were also successfully isolated from adipose tissue (22), amniotic fluid (6), umbilical cord vein (30), Wharton's jelly (17,23), muscles, and periosteum (18). Direct comparison of different bone marrow sources— humerus, tibia, femur, and ilium—showed that cells isolated from the humerus had the lowest cell yield and osteogenic potential (29). Surprisingly, the focused effort so far has been on defining the most appropriate site for MSC harvesting, but not on the dog breed.
There are 350 to 400 dog breeds worldwide, and even though most of them have existed for less than 200 years, the interbreed genetic diversity is high (4). No studies investigated the interbreed differences in the MSC pool and differentiation potential. Obviously, phenotypic diversity is easily recognizable by morphological traits, and breeds are most often clustered in functional groups, including companion dogs, guard dogs, hunting dogs, herding dogs, and working dogs. Given these diversities, we hypothesized that genetic divergences among breeds may also correlate with important changes on their available pool of MSCs.
In the present study, bone marrow-derived MSCs were isolated and grouped depending on the donor's breed: German shepherd, Golden retriever, Labrador, Border collie, Hovawart, and Malinois. Proportion of MSCs in bone marrow extracts was compared among breeds, as well as telomere length. Telomere shortening is an event that affects the mitotic clock mechanism, leading to cell senescence (1). MSCs were also evaluated on their ability to divide and propagate in culture in association with increasing in vitro passage number, and differentiation potential was assessed by quantification of gene and protein expression, and histology.
Materials and Methods
MSC Source and Culture
Bone marrow from six dog breeds (n = 3 per breed) was obtained during anesthesia for unrelated diagnostic or surgical procedures after informed consent of the owners was obtained and diluted in 3.8% sodium citrate (Applichem; Axonlab, Baden, Switzerland) to prevent clotting. Dog breeds included German shepherd (7.0 ± 0 years old; two males, one female), Golden retriever (4.3 ± 1.1 years old; two males, one female), Labrador (6.2 ± 1.4 years old; all males), Border collie (6.6 ± 1.5 years old; all males), Hovawart (7.6 ± 2.0 years old; all males), and Malinois (4.6 ± 1.1 years old; all males). Bone marrow harvested from iliac crest was diluted in phosphate-buffered saline solution (PBS; Applichem) and centrifuged at 500 × g for 10 min. The isolated cells (including erythrocytes) were counted and plated at a density of 5 × 10⁷ cells/cm2 in α-MEM (Amimed; Bio Concept, Allschwil, Switzerland) cell expansion medium supplemented with 10% fetal bovine serum (FBS), 100 units/ml penicillin, 100 mg/ml streptomycin, and 2.5 μg/ml amphotericin B (all Gibco; LuBioScience GmbH, Lucerne, Switzerland) at 37°C, 5% CO2 and 5% O2. After 3 days, nonadherent cells were removed, and adherent cells were washed and then cultured as described above, but supplemented with 5 ng/ ml recombinant basic fibroblast growth factor (bFGF; Peprotech; LuBioScience GmbH). MSCs were collected at 90% confluence, counted by trypan blue (Applichem) exclusion, and replated at 3 × 10³ cells/cm2. For measuring senescence-associated β-galactosidase (SA-β-gal) activity, cells were plated at 3.6 × 10³ cells/cm2 in six-well plates (TPP; Faust, Schaffhausen, Switzerland) and cultured in the presence of bFGF.
Comparison of Cell Expansion Media
High-glucose (HG) (4.5 g/L) and low-glucose (LG) (1 g/L) DMEM (both Gibco) were also used to grow freshly isolated bone marrow cells, and results were compared to α-MEM (1 g/L). In a 12-well plate (TPP), 1.8 × 10⁸ cells (eight donors from all breeds) were plated per well, and after 14 days their activity was assessed by resazurin reduction assay. Cells were incubated in resazurin solution [15 ng/ml resazurin, 2.5 ng/ml methylene blue, 0.1 mM potassium ferricyanide, 0.1 mM potassium ferro cyanide (all Applichem) in the basal media] for 2 h, and bottom well fluorescence absorbance was measured (λex = 535 nm and λem = 595 nm) using a multiwell plate fluorimeter (DTX 880–Multimode detector; Beckman-Coulter, Nyon, Switzerland). Subsequently, cells were washed with 0.9% NaCl, fixed with pure methanol, and stained with Giemsa (all Applichem).
Flow Cytometry with Canine MSC Markers
Canine MSCs were sampled at 1 × 10⁶ cells/tube to investigate the proportion of CD44- and CD90-positive and CD14-negative cells. Cells were incubated with CD14-FITC (Novus Biologicals; LuBioScience GmbH), CD44-FITC, and CD90-PE (both eBioscience, Wien, Austria) antibodies in PBS + 1% FBS for 1 h at 20°C, washed, and resuspended in PBS. Cell fluorescence was evaluated by flow cytometry in a Cell Lab Quanta'SC instrument (Beckman-Coulter), and data were analyzed using Cell Lab Quanta'SC MPL analysis software, version 1.0 (Beckman-Coulter).
Colony Forming Assay
Freshly isolated cells from bone marrow were seeded at 1 × 10⁹ cells/dish (10-cm Primaria cell culture dishes; Falcon; Milian, Wohlen, Switzerland) and grown in cell expansion media supplemented with bFGF. After 14 days, cells were stained with Giemsa as previously described.
Senescence-Associated β-Galactosidase Assay (SA-β-Gal)
MSC senescence was tested at passages 2 to 6 (P2 to P6) in all groups; however, for the German shepherd and Hovawart groups only up to P5 because of arrested cell division. Cells were fixed with 2% formaldehyde and 0.2% glutaraldehyde (both Applichem) in PBS and incubated overnight at 37°C in a freshly prepared staining solution consisting of 150 mM sodium chloride, 2 mM magnesium chloride, 30 mM citric acid/phosphate buffer, 5 mM potassium ferricyanide, 5 mM potassium ferrocyanide (all Applichem), and 1 mg/ml 5-bromo-4-chloro-3-indolyl-β-D-galactopyranoside (X-GAL; Sigma-Aldrich) at pH 6.0 (9). Following washing with PBS, cells were counterstained with hematoxylin (Invitrogen; LuBioScience GmbH), and SA-β-Gal-positive cells were enumerated by bright field microscopy (Olympus IX71, Olympus Schweiz AG, Volketswil, Switzerland).
RNA Isolation, cDNA Synthesis, and Real-Time PCR
Total RNA was isolated from monolayer cultures using TriFast reagent (PeqLAB; LabForce, Nunningen, Switzerland) according to the manufacturer's instructions. As a modification, 2 μl polyacryl carrier (PAC) (Luzerna Chem, Luzern, Switzerland) was added to aid RNA precip itation. Pellets were washed in 70% ethanol and resuspended in ultrapure water. Further, triplicates of three-dimensional MSC–collagen constructs were homogenized after 28 days in culture using Dispomix 25 homogenizer (Axonlab, Baden, Switzerland) in RNA lysis buffer of Aurum Total Mini Kit (Bio-Rad, Reinach, Switzerland), following the manufacturer's instructions with the modification of adding 2 μl PAC in the kit lysis buffer. cDNA was prepared using VILO cDNA Synthesis Kit (Invitrogen).
Real-time (RT)-PCR reactions were carried out in triplicate with the primers listed in Table 1 at a concentration of 250 nM or as described, 5 μl cDNA template, and IQ SYBR Green Supermix (Bio-Rad). Specific products were amplified by CFX96” Real Time System (Bio-Rad). RT-PCR was carried out with the following settings: denaturation 95°C for 3 min (1 cycle), 95°C for 15 s, 64°C for 20 s, and 72°C for 20 s (40 amplification cycles). PCR reactions were carried out in triplicate in a final volume of 25 μl in 96-well plates (Bio-Rad). Melting curve analysis was performed after each reaction. Gene expression differences were determined using the 2–ΔΔCt method, and the results were normalized to the expression of GAPDH.
Canine Genes Used in Quantitative RT-PCR

F, forward; R, reverse; bp, base pairs.
In Vitro Differentiation of MSCs Into Osteogenic, Chondrogenic, and Adipogenic Phenotypes
The potential of MSCs isolated from different breeds to differentiate into chondrogenic, osteogenic, and adipogenic lineages was investigated. Cultures were stimulated with the appropriate differentiation medium according to the conditions described below.
Chondrogenic Differentiation
Scaffolds made of lyo-philized collagen type I, derived from a sponge-shaped medical device (Biopad; Euroresearch, Milan, Italy) were used to support cellular growth (2 × 10⁵ cells/5 mg of collagen). After cell seeding, MSCs on constructs were expanded for 1 week in basal medium supplemented with bFGF and then differentiated for 4 weeks in chondrogenic medium consisting of DMEM/F12 + GlutaMAX (Gibco), 2.5% FBS, 100 units/ml penicillin, 100 mg/ml streptomycin, 2.5 μg/ml amphotericin B, 40 ng/ml dexamethasone (Sigma-Aldrich; Fluka Chemie GmbH, Buchs, Switzerland), 50 μg/ml ascorbic acid 2-phosphate (Sigma-Aldrich), 50 μg/ml L-proline (Sigma-Aldrich), 1× insulin–transferrin–stelenium A (ITS; Gibco), and 10 ng/ ml human recombinant transforming growth factor-β1 (Peprotech). Aggrecan gene expression and glycosaminoglycan (GAG)/DNA ratio were determined as chondrogenic markers.
GAG accumulation was quantified with Alcian blue binding assay after 6-h digestion of three constructs per sample at 60°C with 125 μg/ml papain (Sigma-Aldrich) in 5 mM L-cysteine-HCl (Sigma-Aldrich; Fluka Chemie GmbH), 5 mM Na-citrate, 150 mM NaCl, and 5 mM EDTA (all AppliChem). GAG accumulation was determined by binding to Alcian blue (Fluka); absorption was measured at 595 nm and quantified against chondroitin sulfate (Fluka) reference standards (3).
Constructs were harvested following 28 days of culture in chondrogenic medium, embedded in OCT compound (Sakura; Sysmex Suisse AG, Horgen, Switzerland) for 30 min and then frozen at –80°C. Constructs were subsequently cryosectioned at 10 μm thickness using a cryostat microtome (Microm HM560; Histocom AG, Zug, Switzerland). Detection of GAG accumulation was carried out by Alcian blue staining: sections were stained overnight with 0.4% Alcian blue dissolved in 0.01% H2SO4 (Applichem) and 0.5 M guanidine hydrochloride (Fluka); next, sections were washed for 30 min in 40% DMSO and 0.05 M MgCl2 (both Applichem), mounted with 70% glycerol (Applichem), and examined by light microscopy.
Osteogenic Differentiation
MSCs cultured in monolayer at a density of 7 × 10³ cells/cm2 were differentiated for 4 weeks in Advanced DMEM (Gibco) + GlutaMAX, 5% FBS, 100 units/ml penicillin, 100 mg/ml streptomycin, 2.5 μg/ml amphotericin B, 50 μM L-ascorbic acid 2-phosphate, 10 mM β-glycerophosphate, and 100 nM dexamethasone (both Sigma-Aldrich). von Kossa stain was used to identify mineralization deposits in the cell culture: under illumination, 5% AgNO3 (Applichem) was reduced to metal silver (black stain).
Calcium content was determined using the Calcium CPC LiquiColor test kit (StanBio; BDS International Diagnostics GmbH, Schwetzingen, Germany), as follows: cells were washed twice with PBS, incubated with 0.5 N HCl (Applichem) for 30 min at room temperature, and O-Cresolphtalein (StanBio) complex was added; calcium content in the liquid was measured, the absorbance at 595 nm, and quantified with standards. Osteopontin gene expression was determined as an osteogenic marker.
Adipogenic Differentiation
MSCs were cultured in monolayer at a density of 4 × 10⁵ cells/cm2 for 2 weeks under two different culture conditions: (1) adipogenesis maintenance medium, DMEM + GlutaMAX, 2.5% FBS, 100 units/ml penicillin, 100 mg/ml streptomycin, and 2.5 μg/ml amphotericin B (all Sigma-Aldrich); (2) adipogenesis-inducing medium, maintenance medium supplemented with 3% FBS, 5% rabbit serum (Gibco), 1 μM dexamethasone, 500 nM 3-isobutyl-1-methylxanthine, 33 μM biotin, 5 μM rosiglitazone, and 17 μM pantothenate (all Sigma-Aldrich) (18). Lipid droplets were revealed by staining with Oil red O (Fluka), and dye content was quantified by isopropanol elution and spectrophotometry by measuring the absorbance at 520 nm. Ppar-γ gene expression was determined as adipogenic marker.
Telomere Length Real-Time PCR
The protocol for telomere length real-time PCR was previously described (5). Briefly, MSCs at passage 2 were harvested, and genomic DNA (from ~1 × 10⁶ cells) was isolated from cells using a GeneJet genomic DNA purification kit (Fermentas). Genomic DNA samples (1 ng/ml) were run in triplicate in a 96-well plate (Bio-Rad) in a quantitative PCR system. In the telomere PCR, each well contained 100 nM of telomere primers (telg and telc), and in the albumin PCR, each well contained 250 nM of albumin primers (sequences of the primers are listed in Table 1). The real-time PCR program for the telomere and albumin consisted of initial denaturation at 95°C for 3 min, followed by 40 PCR cycles at 95°C for 15 s, 60°C for 20 s, and 72°C for 20 s (single fluorescence measurement). Melting curve analysis was carried out for each reaction, and standard curves were fitted for both telomere DNA and albumin DNA. Values were calculated as a ratio of telomere DNA to albumin DNA for each sample.
Statistical Analysis
Descriptive statistics were used; data collected were expressed as the mean ± SD.
Results
Isolation and Characterization of Canine MSC
Freshly isolated canine MSCs derived from bone marrow were plated with three different expansion media: α-MEM, HG and LG DMEM (Fig. 1A). After the initial plating, cells were grown in the same base media with or without supplementation of bFGF. After 14 days of culture, the activity of cells was determined by resazurin reaction. Cell activity was higher in the presence of bFGF, independently of the base medium used (cells were on average ~85% less active without bFGF). α-MEM was the best base to culture MSCs compared with HG DMEM—on average ~65% lower activity—and LG DMEM—on average ~95% lower activity. Staining with Giemsa of the colonies formed after 14 days confirmed cell activity results (Fig. 1B).

Isolation and in vitro expansion of canine mesenchymal stem cells (cMSCs). Freshly isolated cells from bone marrow extract were plated in α-MEM, HG DMEM, and LG DMEM and cultured for 14 days in the presence or absence of bFGF. Cell activity (A) was measured and compared to α-MEM + bFGF (data are represented as mean ± SD; n = 8); cell adherence and growth of cell colonies were visualized by staining with Giemsa (B).
Following cell expansion, MSCs grew in a monolayer consisting of cells with small and homogeneous, often spindle-shaped morphology (data not shown). All MSCs showed the same immunophenotype with expression of receptor molecule protein CD44 and CD90, and the absence of the hematopoietic marker CD14 (Fig. 2).
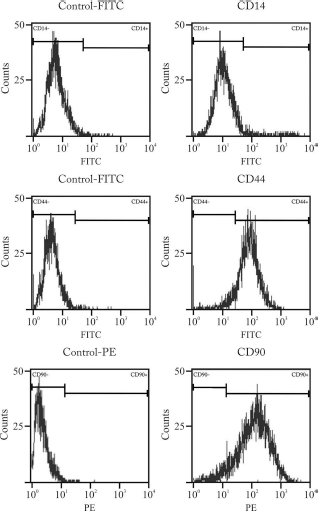
Flow cytometry analysis of canine primary culture of cMSCs. Analysis revealed that cells expressed CD44 and CD90, but not CD14, as shown by a representative sample. FITC, fluorescein isothiocyanate; PE, phycoerythrin.
Initial Pool of Canine MSCs Isolated From Bone Marrow: Colony-Forming Units Assay and Telomere Length
Colony-forming units (CFUs) assay is a key tool for defining the initial pool of MSCs present in bone marrow samples (Fig. 3A). The total number of colonies did not show great variation among the breeds, except for the Hovawart group, where we counted on average 35 colonies, against the 150 colonies present in the other groups. Also the proportion of different size colonies was similar among breed (~40% small, ~40% medium, ~20% large size) with the exception of the Golden retriever group, where large colonies were 70%, evident also in the example of Giemsa staining of colonies derived from all breeds.

The initial pool of cMSCs per breed was determined by CFU counts (A). Counts were compared among breeds (values represent mean ± SD; n = 3), and results were subdivided by the diameter of the colony formed: small (<2 mm), medium (2–5 mm), and large (>5 mm). To illustrate the interbreed variability, representative CFUs stained with Giemsa are shown below the graph. Telomere lengths of cMSC chromosome at passage 2 were measured via qPCR, and results were normalized to the quantity of albumin gene (B) (values represent mean ± SD, n = 3).
Telomere length of MSCs at passage 2 was measured using a quantitative PCR assay, and normalized to the albumin gene (Fig. 3B). The length of the telomeres was not varying excessively among breeds: German shepherd MSCs had the shortest telomere length, equivalent to 60% of the length measured in Border collie and Malinois MSCs, which had the longest ones. In Golden retriever, Hovawart, and Labrador MSCs the telomere length was slightly shorter (85%) compared with Border collie and Malinois MSCs.
Long-Term Growth Kinetics and In Vitro Senescence of Canine MSCs
In order to characterize cell senescence, primary MSCs from all breeds were cultured in vitro for 45 days. The in vitro population doubling time (PDT) of MSCs was similar for all breeds up to the 25th day of culture, oscillating between 25 and 50 h per cell division (Fig. 4A). Approximately after the 25th day of culture, PDT sharply increased to more than 100 h per division (prelude of senescence stage), except for Border collie PDT, which reached the 100 h per division after the 45th day of culture.

Cell population variations in aging cMSCs in vitro. Population doubling times (PDTs) (A) were measured at the end of every passage and plotted against time (values represent mean ± SD, n = 3). Values above 200 h/division were excluded from the graph. Cumulative population doublings (CPDs) (B) were also evaluated at the end of every passage and calculated for the following 45 days. The number of senescent cells present in cMSC population (C) at different passages for each breed was evaluated by SA-β-gal activity (values represent mean ± SD, n = 3).
Next we calculated the number of cumulative population doublings (CPDs), and MSCs did show interbreed variability (Fig. 4B): cells from German shepherd and Hovawart MSCs stopped dividing at 16 and 17 CPD, respectively, while Border collie MSCs reached 26 CPD. Golden retriever, Labrador, and Malinois MSCs reached approximately senescence after 20 CPD.
To further explore the dynamics of MSCs in ongoing culture, their SA-β-gal activity was evaluated for four in vitro passages, from P2 to P6 (Fig. 4C). The proportion of SA-β-gal-positive cells, as a percent of the total population, increased with in vitro age. The average of positive cells in the population of MSCs at P2 was ~20%, but at P4 doubled to almost ~50% and continued to increase for the following passages up to ~70% at passage 6. Interestingly, the rate of senescent cells forming was double in German shepherd, Labrador, and Golden retriever, compared with cells derived from other breeds. Hovawart MSCs had the highest proportion (already 40%) of senescent cells at P2.
MSC Differentiation Potential Depends on the Breed
Differentiation toward osteogenic, adipogenic, and chondrogenic phenotypes of MSCs was assessed by histochemical staining (Fig. 5) and gene expression (Fig. 6) analysis. The potential for osteogenic differentiation was proven by von Kossa staining of the mineralized matrix deposits after 28 days of culture (Fig. 5A) and gene expression of the bone-related marker osteopontin (Fig. 6A). Average calcium deposition (Fig. 5B) was more effective in Border collie (42 μg/ml), Golden retriever (49 μg/ml), and Labrador (64 μg/ml) cells compared to other breeds (14–24 μg/ml). Osteopontin gene expression confirmed these observations, except in the Golden retriever group, which expressed the lowest level of osteopontin. After 14 days of culture, the predisposition to adipogenesis was similar among breeds (Fig. 5A, C), as demonstrated by the measurement of the concentration of resuspended Oil red O after fat vacuole staining. Although fat formation was similar between dog breeds, the gene expression of the adipogenic marker Ppar-γ (Fig. 6B) was variable; gene expression in Golden retriever was approximately threefold higher compared with German shepherd and Labrador. Other breed MSCs expressed intermediate levels of Ppar-γ. After 28 days in chondrogenic medium, the chondrogenic potential of cells in three-dimensional culture was proven by localization on MSC-construct sections (Fig. 5A) and quantified by the accumulation of GAG (Fig. 6C). The ability of MSCs to accumulate GAG was higher in the Hovawart (20 μg/ml) and Labrador (23 μg/ml) groups, compared to the other breeds (10–13 μg/ml). Expression levels of the cartilage-specific gene aggrecan was predominant in Hovawart cells (Fig. 6C), 10-fold higher expression in comparison to German shepherd and Border collie, and fivefold in comparison to Golden retriever, Labrador, and Malinois.

Differentiation potential of cMSCs and interbreed variations. Representative pictures of differentiation are shown: osteogenic phenotype: von Kossa staining of mineralized matrix deposition (in black); adipogenic phenotype: differentiation was determined by Oil red O staining (fat containing vacuoles magnification in the inset); and chondrogenic phenotype: staining of constructs section with Alcian blue (scale bar: 200 μm) (A). Osteogenesis was assessed by quantification of calcium deposition (B), adipogenesis by Oil red O absorbance (C), and chondrogenesis by GAG accumulation (D) (values represent mean ± SD, n = 3).

MSC differentiation was confirmed by gene expression analysis of respective differentiation markers: osteopontin (osteogenic, A), Ppar-γ (adipogenic, B), and aggrecan (chondrogenic, C) (relative expression normalized to GAPDH; mean, —; n = 3.)
Discussion
In this study, we compared the in vitro expansion and differentiation potential of canine MSCs derived from six different dog breeds. We hypothesized that their future application in tissue engineering approaches and the success rate of these therapies might be influenced by the genetic differences among breeds. Prior to this report, the role of dog breed as a variable on in vitro life span and differentiation of canine MSCs have received no attention. In order to have a more comprehensive study, some of the most common large/medium dog breeds—Border collie, German shepherd, Labrador, and Golden retriever—were included as well as less common breeds—Malinois and Hovawart—and the natural limitation of including many breeds was the limited number of donors per group. Only medium- to large-size dogs were involved in this study, due to the ease of harvesting enough bone marrow material for cell isolation and the possibility to translate results to human clinical practice. We found that MSCs isolated from adult individuals belonging to different breeds show peculiar capacity of growth and differentiation; for example, Hovawart dogs had a reduced initial pool of MSCs present in the bone marrow compared to other breeds, as shown by CFU assays. Border collie-derived MSCs survived for a longer time in culture compared to other breeds and showed the highest rate of division (at day 30, ~40 h/division) and population doublings (26 doublings), as well as the lowest proportion of senescent cells (at P5, 40%). On the other end of the spectrum, results from German shepherd MSCs showed a lower rate of division (at day 30, ~120 h/division) and population doublings (16 doublings), as well as the highest proportion of senescent cells (at P5, 70%). German shepherd MSCs had also the lowest differentiation potential—confirmed by gene expression levels (RT-PCR) and protein accumulation (histological assay). Hovawart, Labrador, Malinois, and Golden retriever MSC results were between those measured for Border collie and German shepherd.
These differences are representative of the difficulties that adult stem cell therapies must face in clinical practice. The genetic pool of canine MSCs differs depending on the breed, leading to obstacles in the application and use of these cells. However, despite the small number of dog donors per group included in this study, the variability within the breed groups was acceptable, unlike the large interdonor variability we observed in our previous study on human MSCs (2). Compared to human MSCs, canine MSCs have a significant shorter life in vitro characterized by a lower rate of division and number of cell doublings, as well as a reduced differentiation potential. Canine MSCs also produced small and faint lipid droplets, a reduced number of osteogenic aggregates, and a lower amount of proteoglycans in comparison with human MSCs. This difference might correlate with the intrinsic life expectancy of the two species: average life expectancy in human is ~75 years old, while in dogs it is only ~10 years old. From an evolutionary perspective, in this case, the life expectancy of the species might be reflected in the in vitro life span of cells. However, this paradigm is not confirmed in general, as rat in vitro senescence of MSCs has not been observed (12). The divergences observed within dog breeds might resemble the differences observed interdonor in human stem cell biology (2).
Dog breeds differ considerably depending on various factors, such as size, coat type, shape, behavior, etc. Some of these differences affect directly the life span of dog breeds; for instance, larger dogs are more prone to age earlier than smaller ones, leading to a reduced life expectancy, as low as 50% in large-size dogs compared to small ones (19,20). Here we speculate that dog breed longevity might relate to the in vitro life span of the respective MSCs. When we compare the median life expectancy with the total population doublings measured in this study, we observe a direct correlation: Border collie 13.5 years versus 26 doublings, Labrador and Golden retriever 12.5 years versus 18–20 doublings, and German Shepherd 11.0 years versus 16 doublings. Telomere length is also associated with the life span of dog breeds (10): breeds with longer telomere (i.e., Labrador) live longer than breeds with shorter ones (i.e., Great Dane). Contrary to this observation, in our study no significant differences were observed among breeds in telomere length of MSCs, considering that at the time of analysis (P2) cells underwent almost the same number of cell division in vitro (~13 doublings).
The potential success of MSC-based therapies depends also on the choice of optimal cell preparation protocol. We described that the culture method influenced cellular kinetics of MSCs, depending on the expansion media used—α-MEM, LG, and HG DMEM—and the absence and presence of bFGF. Other scientific publications studying canine MSCs used α-MEM (18), LG DMEM (11), and HG DMEM (29), but there is no consensus on the most appropriate basal media. Kisiel et al. showed that variations in expansion media led to significant alteration of growth and differentiation potential (18). We observed that the initial plating of cells isolated from bone marrow was not influenced by the expansion media, but in the following stage of cell expansion, MSCs grew more effectively in α-MEM supplemented with bFGF. The MSCs used in this study showed a similar differentiation potential compared to the previously published data on canine bone marrow stem cells (11,29), as well as in comparison to stem cells isolated from adipose tissue (23,26). Furthermore in this study, we also analyzed the expression of the existing and validated markers to confirm MSC phenotype—positive expression of cell surface markers CD90 and CD44, negative expression of CD14; however, we excluded the analysis of several passages, as well as the differentiation potential assays, because such data were well documented by previous studies (14,22,29).
We observed discrepancies in the comparison of the histological marker measurements and gene expression analysis after MSC differentiation, in the specific case of the Golden retriever osteogenesis and Labrador chondrogenesis. In both differentiation cases, histological measurements were higher than the relative gene expression, and this divergence might be explained by a higher ratio of active cells versus the total number of cells in comparison to other groups, due to the intrinsic heterogeneity of MSC populations.
In conclusion, our results indicate that the potential of canine MSCs to undergo differentiation and to be manipulated in vitro is dependent on dog breed. Our results showed that MSCs from all breeds can grow and differentiate in vitro, but to different extents and in all cases not as long as human MSCs. It is possible to use several biomarkers—number of CFUs, PDT, and SA-β-gal assay—to categorize cell samples derived from a specific breed for scientific and therapeutic use. From a broader perspective, these correlations can be helpful for the future development of robust quality control approaches for MSC-related cell therapies for veterinary practice and the use of veterinary disease models in human translational research. The comparison of differentiation potential as a research tool can evaluate cell samples between breeds and reduce waste of laboratory resources by giving a preference to certain breeds. In addition, the definition of the intrinsic characteristic of each breed might lead to more accurate estimation on the effectiveness of an autologous or allogenic transplant of MSCs. Finally, the differences shown in dogs open the question of reproducibility and comparing published scientific results and clinical success rates—a relevant question to consider in the future when advanced cell therapies are applied to humans with different ethnic origins.
Footnotes
Acknowledgments
This work was supported by the Swiss Paraplegic Foundation and Swiss National Foundation Grant CR3I3_140717/1. Author contributions: Alessandro Bertolo: conception and design, collection and assembly of data, data analysis and interpretation, manuscript writing, final approval of manuscript; Frank Steffen: conception and design, provision of study material, final approval of manuscript; Cherry Malonzo-Marty: collection and assembly of data, data analysis and interpretation, final approval of manuscript; Jivko Stoyanov: conception and design, collection and assembly of data, data analysis and interpretation, manuscript writing, final approval of manuscript, administrative support. The authors declare no conflicts of interest.